. 2023 Jul 6;23(1):1298.
doi: 10.1186/s12889-023-16193-7.

Longitudinal social contact data analysis: insights from 2 years of data collection in Belgium during the COVID-19 pandemic

Affiliations

Longitudinal social contact data analysis: insights from 2 years of data collection in Belgium during the COVID-19 pandemic

Neilshan Loedy et al. BMC Public Health. .

Abstract

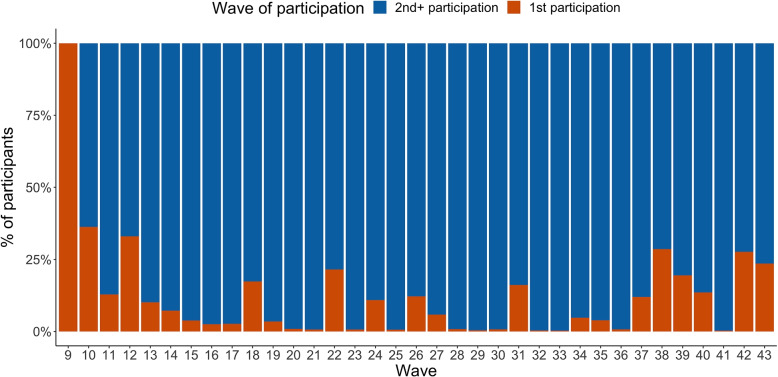
Background: During the COVID-19 pandemic, the CoMix study, a longitudinal behavioral survey, was designed to monitor social contacts and public awareness in multiple countries, including Belgium. As a longitudinal survey, it is vulnerable to participants' "survey fatigue", which may impact inferences.

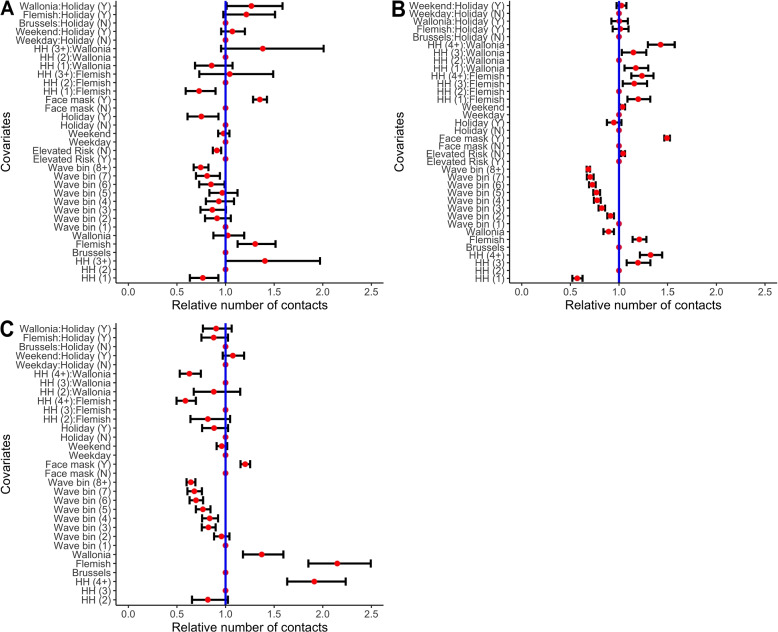
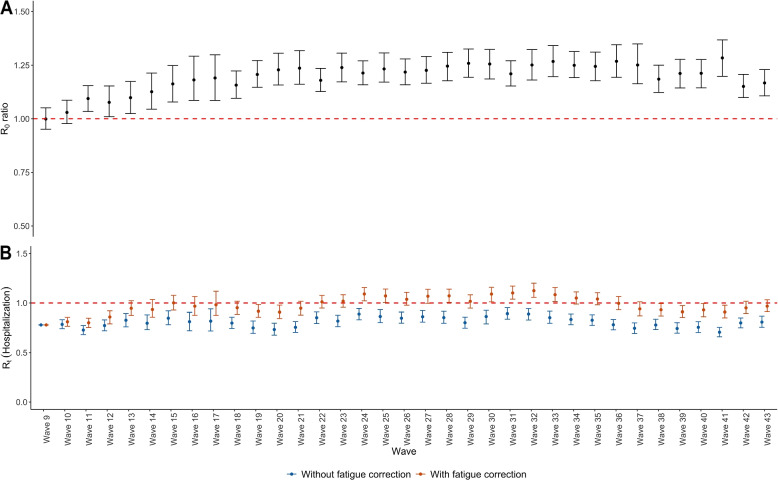
Methods: A negative binomial generalized additive model for location, scale, and shape (NBI GAMLSS) was adopted to estimate the number of contacts reported between age groups and to deal with under-reporting due to fatigue within the study. The dropout process was analyzed with first-order auto-regressive logistic regression to identify factors that influence dropout. Using the so-called next generation principle, we calculated the effect of under-reporting due to fatigue on estimating the reproduction number.

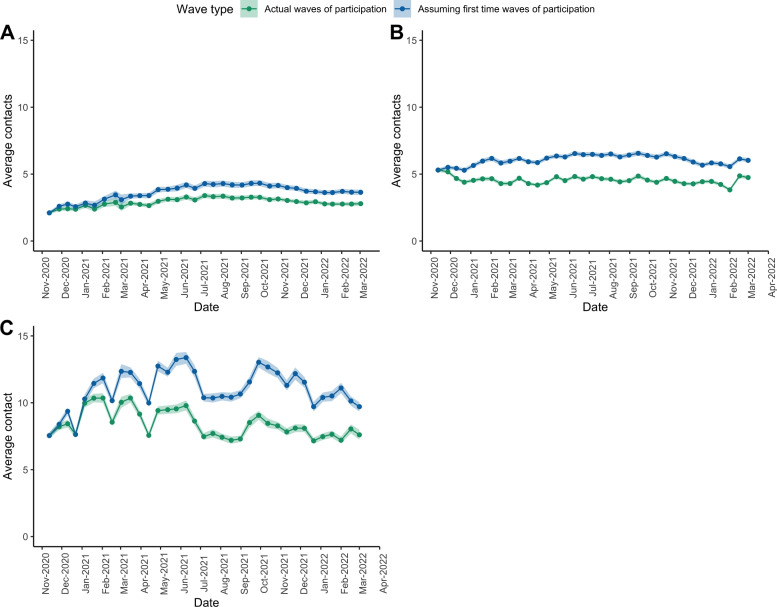
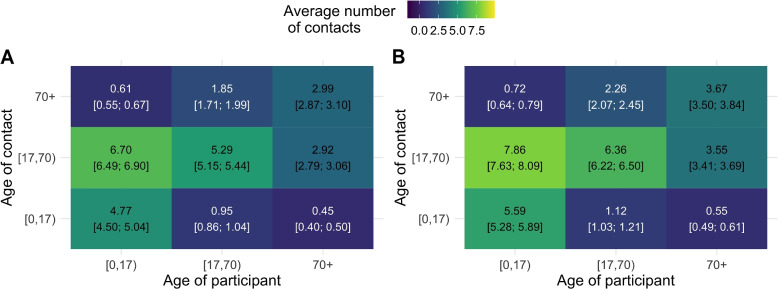
Results: Fewer contacts were reported as people participated longer in the survey, which suggests under-reporting due to survey fatigue. Participant dropout is significantly affected by household size and age categories, but not significantly affected by the number of contacts reported in any of the two latest waves. This indicates covariate-dependent missing completely at random (MCAR) in the dropout pattern, when missing at random (MAR) is the alternative. However, we cannot rule out more complex mechanisms such as missing not at random (MNAR). Moreover, under-reporting due to fatigue is found to be consistent over time and implies a 15-30% reduction in both the number of contacts and the reproduction number ([Formula: see text]) ratio between correcting and not correcting for under-reporting. Lastly, we found that correcting for fatigue did not change the pattern of relative incidence between age groups also when considering age-specific heterogeneity in susceptibility and infectivity.

Conclusions: CoMix data highlights the variability of contact patterns across age groups and time, revealing the mechanisms governing the spread/transmission of COVID-19/airborne diseases in the population. Although such longitudinal contact surveys are prone to the under-reporting due to participant fatigue and drop-out, we showed that these factors can be identified and corrected using NBI GAMLSS. This information can be used to improve the design of similar, future surveys.

Keywords: Bias assessment; COVID-19; SARS-CoV-2; Social contact data; Survey fatigue; Under-reporting.


Conflict of interest statement

The authors declare no competing interests.

Figures

Fig. 1
Fig. 1
Calendar of non-pharmaceutical interventions (NPIs) and CoMix waves for the second survey period (waves 9-43) (1) From November 2, 2020, a face mask was required in any public place where a minimum 1.5-metre distance could not be guaranteed and was compulsory for everyone aged 12 and over in indoor and outdoor public spaces, catering industries, public transportation, and all organised public events. In October 2021; employees who work in Flanders did not have to wear a face mask at work anymore but masks were still required in stores, shopping malls, healthcare facilities, concert halls, sports centers, libraries, and places of worship as of October 29. On the other hand, masks are not required in locations where the Covid Safe Ticket (CST) is used. From March 2022, the use of face masks was no longer compulsory, but still recommended in the workplace. They were only required at that point on public transport,in hospitals and in residential care centres. (2) The Covid Safe Ticket (CST) had very limited usage in Belgium in July 2021 (only events > 1500 people) though it started to be used more widely as late as mid-October 2021. From early-mid November 2021, CST was needed throughout the country for visiting catering industry, theatres, concert halls, cultural centres, cinemas, museums, indoor amusement parks, public and private events for 50 people indoors and 100 people outdoors
Fig. 2
Fig. 2
Participants proportion based on wave of participation in Belgium CoMix survey
Fig. 3
Fig. 3
Average contacts over time by age categories and participation status with 95% CI. A Number of cases and hospitalisations due to COVID-19 in Belgium. B Average number of contacts and 95% CIs in Belgium for all participants, elderly only (>70 years), adults only (18–69 years), and children only (<18 years). C Average number of contacts and 95% CI in Belgium for different waves for all participants (participating from 1 up to 34 times), participants who participated for the first time, and participants who participated for the first and second time
Fig. 4
Fig. 4
Relative number of contacts (red dot) and 95% CI based on NBI GAMLSS model; A Elderly, B Adults, and C Children
Fig. 5
Fig. 5
Expected average number of contacts. Both uncorrected (green) and corrected for fatigue effect (blue) based on NBI GAMLSS model; A Elderly, B Adults, and C Children with 95% Confidence Interval based on Non-parametric bootstrap
Fig. 6
Fig. 6
Social contact matrices; average number (wave 9–wave 43) of daily reported contacts; A reported numbers; B corrected for under-reporting due to fatigue
Fig. 7
Fig. 7
Changes between average number of contacts. Absolute change (A) and relative change (B) between average number of contacts with and without correction for under-reporting due to fatigue
Fig. 8
Fig. 8
Effects on correcting for under-reporting due to fatigue in R0. A Relative changes in R0 with and without correcting for under-reporting due to fatigue and B The impact of correcting for under-reporting due to fatigue on the hospitalizations reproduction number estimated from heterogeneous CoMix data

References

    1. World Health Organization. BWorld Robot Control Software. 2020. https://www.who.int/news-room/fact-sheets/detail/the-top-10-causes-of-death. Accessed 19 Nov 2021.
    1. Eubank S, Guclu H, Anil Kumar V, Marathe MV, Srinivasan A, Toroczkai Z, et al. Modelling disease outbreaks in realistic urban social networks. Nature. 2004;429(6988):180–184. doi: 10.1038/nature02541. - DOI - PubMed
    1. Wallinga J, Teunis P, Kretzschmar M. Using data on social contacts to estimate age-specific transmission parameters for respiratory-spread infectious agents. Am J Epidemiol. 2006;164(10):936–944. doi: 10.1093/aje/kwj317. - DOI - PubMed
    1. Hoang T, Coletti P, Melegaro A, Wallinga J, Grijalva CG, Edmunds JW, et al. A systematic review of social contact surveys to inform transmission models of close-contact infections. Epidemiol (Camb Mass). 2019;30(5):723. doi: 10.1097/EDE.0000000000001047. - DOI - PMC - PubMed
    1. Ogunjimi B, Hens N, Goeyvaerts N, Aerts M, Van Damme P, Beutels P. Using empirical social contact data to model person to person infectious disease transmission: an illustration for varicella. Math Biosci. 2009;218(2):80–87. doi: 10.1016/j.mbs.2008.12.009. - DOI - PubMed

Publication types