. 2023 Jul 6;29(1):91.
doi: 10.1186/s10020-023-00694-7.

Histone acetyltransferase P300 deficiency promotes ferroptosis of vascular smooth muscle cells by activating the HIF-1α/HMOX1 axis

Affiliations

Histone acetyltransferase P300 deficiency promotes ferroptosis of vascular smooth muscle cells by activating the HIF-1α/HMOX1 axis

Juan Shi et al. Mol Med. .

Abstract

Background: E1A-associated 300-kDa protein (P300), an endogenous histone acetyltransferase, contributes to modifications of the chromatin landscape of genes involved in multiple cardiovascular diseases. Ferroptosis of vascular smooth muscle cells (VSMCs) is a novel pathological mechanism of aortic dissection. However, whether P300 regulates VSMC ferroptosis remains unknown.

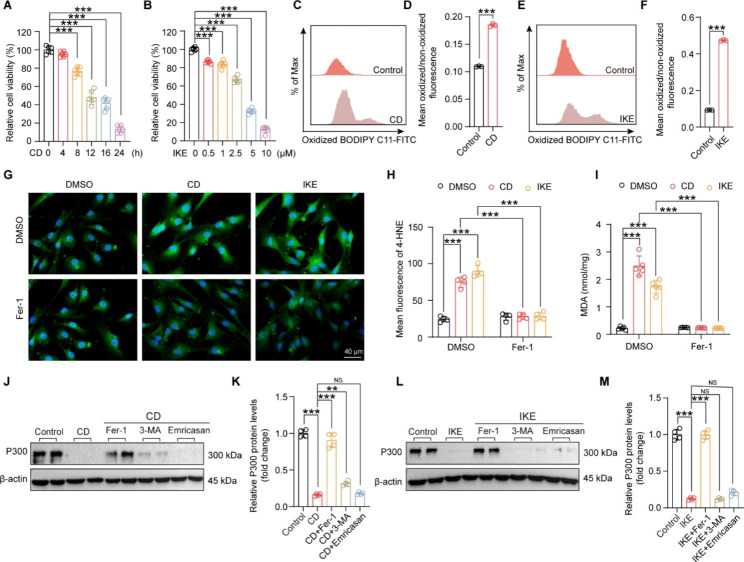
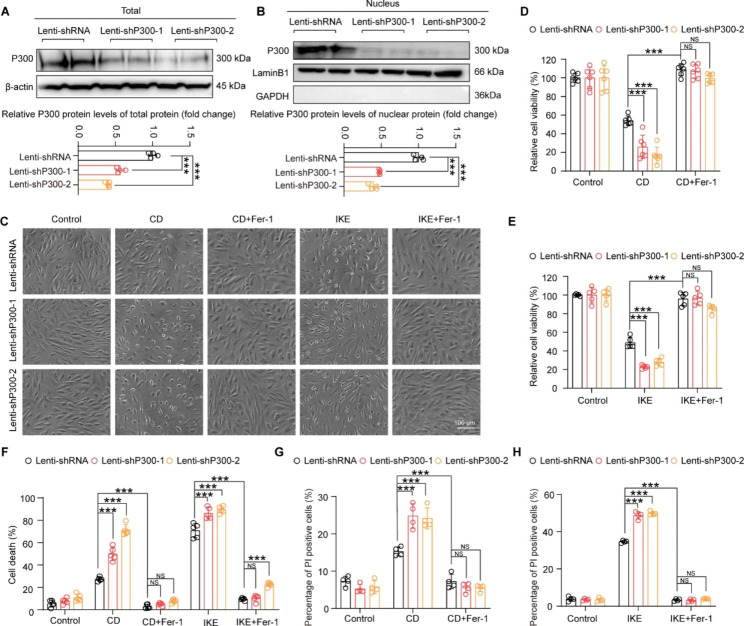
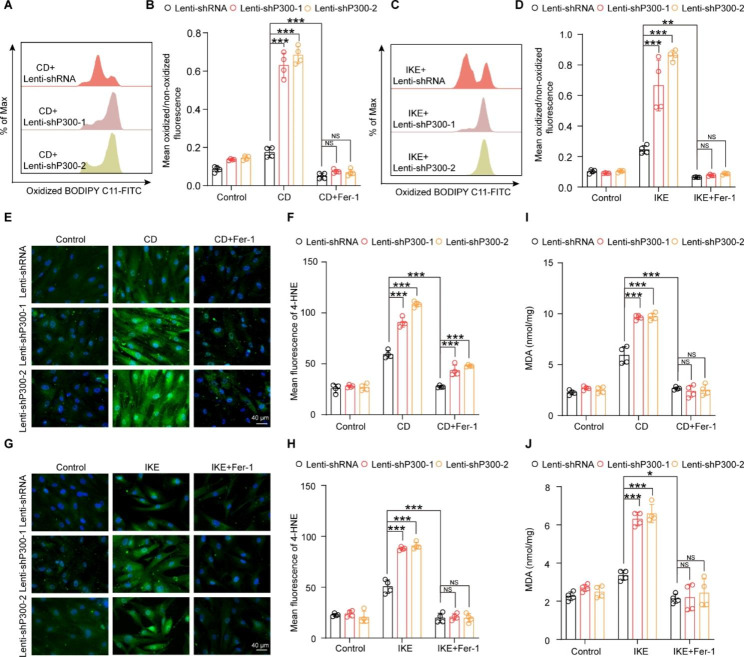
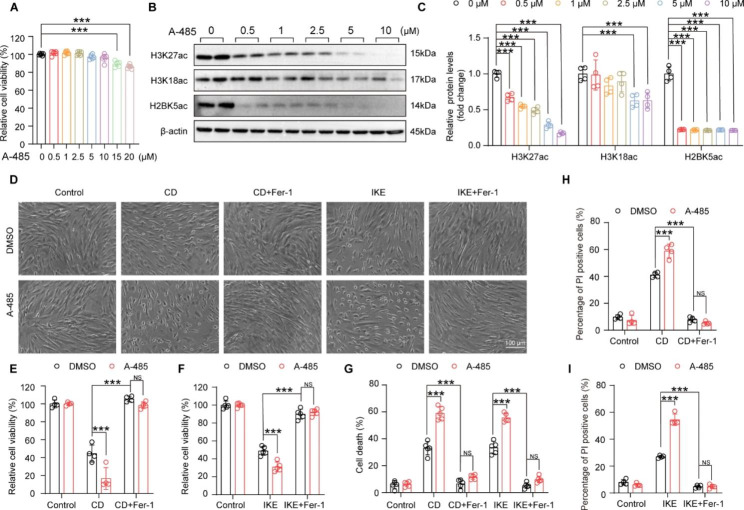
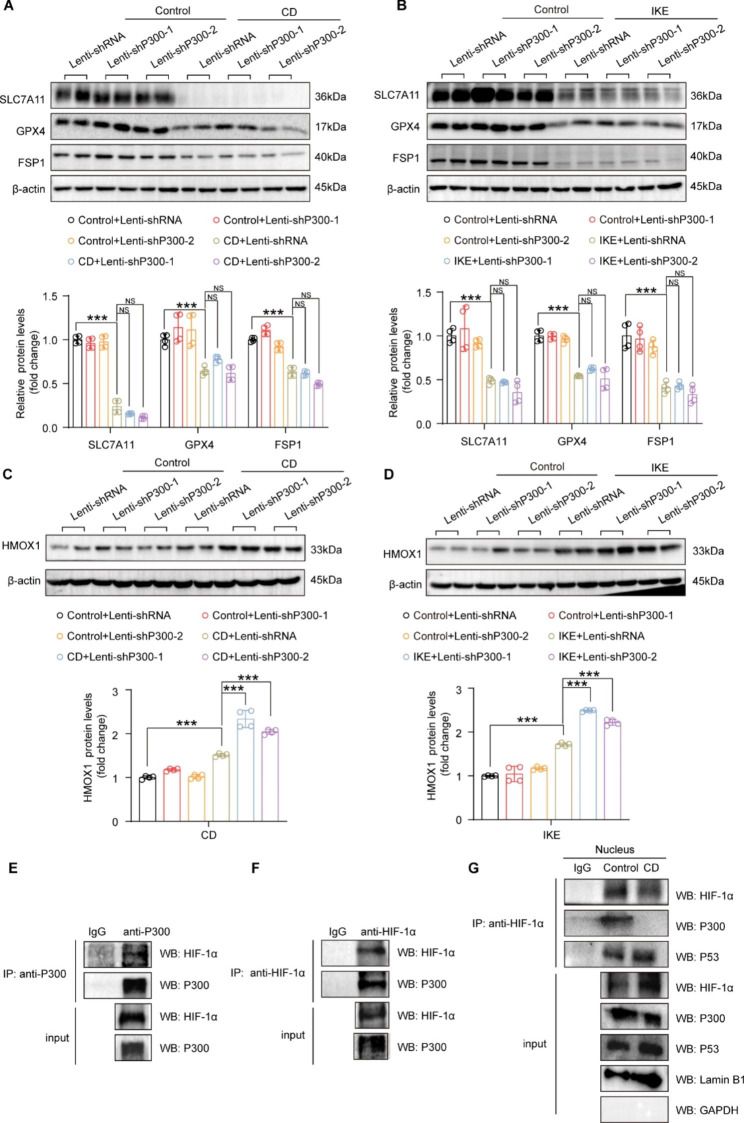
Methods: Cystine deprivation (CD) and imidazole ketone erastin (IKE) were used to induce VSMC ferroptosis. Two different knockdown plasmids targeting P300 and A-485 (a specific inhibitor of P300) were used to investigate the function of P300 in the ferroptosis of human aortic smooth muscle cells (HASMCs). Cell counting kit-8, lactate dehydrogenase and flow cytometry with propidium iodide staining were performed to assess the cell viability and death under the treatment of CD and IKE. BODIPY-C11 assay, immunofluorescence staining of 4-hydroxynonenal and malondialdehyde assay were conducted to detect the level of lipid peroxidation. Furthermore, co-immunoprecipitation was utilized to explore the interaction between P300 and HIF-1α, HIF-1α and P53.

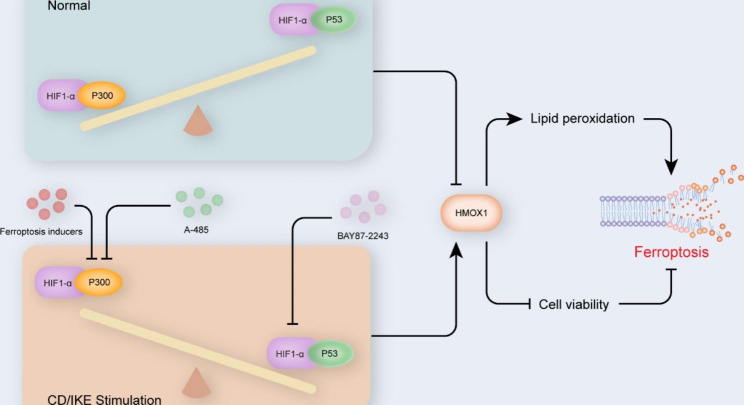
Results: Compared with normal control, the protein level of P300 was significantly decreased in HASMCs treated with CD and IKE, which was largely nullified by the ferroptosis inhibitor ferrostatin-1 but not by the autophagy inhibitor or apoptosis inhibitor. Knockdown of P300 by short-hairpin RNA or inhibition of P300 activity by A-485 promoted CD- and IKE-induced HASMC ferroptosis, as evidenced by a reduction in cell viability and aggravation of lipid peroxidation of HASMCs. Furthermore, we found that hypoxia-inducible factor-1α (HIF-1α)/heme oxygenase 1 (HMOX1) pathway was responsible for the impacts of P300 on ferroptosis of HASMCs. The results of co-immunoprecipitation demonstrated that P300 and P53 competitively bound HIF-1α to regulate the expression of HMOX1. Under normal conditions, P300 interacted with HIF-1α to inhibit HMOX1 expression, while reduced expression of P300 induced by ferroptosis inducers would favor HIF-1α binding to P53 to trigger HMOX1 overexpression. Furthermore, the aggravated effects of P300 knockdown on HASMC ferroptosis were largely nullified by HIF-1α knockdown or the HIF-1α inhibitor BAY87-2243.

Conclusion: Thus, our results revealed that P300 deficiency or inactivation facilitated CD- and IKE-induced VSMC ferroptosis by activating the HIF-1α/HMOX1 axis, which may contribute to the development of diseases related to VSMC ferroptosis.

Keywords: Ferroptosis; HIF-1α; HMOX1; P300; P53; Vascular smooth muscle cells.


Conflict of interest statement

The authors declare that they have no competing interests.

Figures

Fig. 1
Fig. 1
P300 was downregulated during ferroptosis of HASMCs. (A) Relative cell viability of HASMCs measured with a CCK8 kit after cystine deprivation (CD) treatment for 0, 4, 8, 12, 16, and 24 h (n = 6 per group). (B) Relative cell viability of HASMCs after treatment with different concentrations of imidazole ketone-erastin (IKE) (0, 0.5, 1, 2.5, 5, 10 µM) (n = 6 per group). C-F. The level of lipid ROS (oxidized BODIPY-C11/non-oxidized BODIPY-C11 ratio) detected by using a BODIPY-C11 kit in HASMCs after treatment with CD (C-D) and IKE (E-F) (n = 3 per group). G. Representative images of immunofluorescence staining with 4-HNE in HASMCs treated with DMSO and Fer-1 after CD and IKE stimulation for 16 h. H. Quantitative analysis of immunofluorescence staining of 4-HNE (n = 4 per group). I. The level of MDA measured by using an MDA assay kit in HASMCs treated with DMSO and Fer-1 after CD and IKE stimulation for 16 h. (n = 5 per group). J-M. P300 protein levels in HAMSCs after CD (J-K), IKE (L-M) stimulation for 16 h and treatment with Fer-1, 3-MA and Emricasan were measured by western blot (n = 4 per group). J and L. Representative western blot; K and M. Quantitative results. β-actin served as a loading control. Values are means ± SD; ***p < 0.001, **p < 0.01, NS, no significant
Fig. 2
Fig. 2
Knockdown of P300 reduced cell viability and increased cell death of HASMCs with CD- and IKE-induced ferroptosis. A-B. The protein level of P300 were detected by western blot in total and nuclear protein extraction of HASMCs infected with lenti-shRNA or lenti-shP300. (n = 4 per group). (A) Total protein extraction western blot; (B) Nuclear protein extraction. C. Representative images showing cell death induced by CD, IKE, alone or in combination with Fer-1 after HASMCs were infected with lenti-shRNA, lenti-shP300-1 and lenti-shP300-2. D-E. Relative viability of the indicated lentivirus-infected HASMCs evaluated by CCK8 after treatment with CD (D), IKE (E), alone or in combination with Fer-1 (n = 6 per group). F. Relative cell death of HASMCs infected with the indicated lentivirus evaluated by LDH after the treatment described above (n = 5 per group). G-H. Percentage of PI positive indicated lentivirus-infected HASMCs examined by flow cytometry with propidium iodide (PI) staining after treatment as described above (n = 4 per group). Values are means ± SD; ***p < 0.001, NS, no significant
Fig. 3
Fig. 3
Downregulation of P300 aggravated the accumulation of lipid peroxidation during HASMC ferroptosis. A-D. The level of lipid ROS (oxidized BODIPY-C11/non-oxidized BODIPY-C11 fluorescence ratio) examined by using BODIPY-C11 kit after treatment with CD (A-B) and IKE (C-D), alone or in combination with Fer-1, in HASMCs infected with lenti-shRNA, lenti-shP300-1 and lenti-shP300-2 (n = 4 per group). E and G. Representative images of immunofluorescence staining of 4-HNE in the indicated lentivirus-infected HASMCs treated with CD (E), IKE (G), alone or in combination with Fer-1. F and H. Quantitative analysis of 4-HNE (n = 4 per group). I-J. The level of MDA was evaluated by an MDA assay kit in indicated lentivirus-infected HASMCs after CD (I), IKE (J), or in combination with Fer-1 stimulation for the indicated time (n = 4 per group). Values are means ± SD; ***p < 0.001, **p < 0.01, *p < 0.05, NS, no significant
Fig. 4
Fig. 4
A-485 reduced cell viability and increased cell death of HASMCs treated with CD and IKE. A. A CCK8 assay was performed to show the relative cell viability detected in HASMCs after treatment with different concentrations of A-485 (0, 0.5, 1, 2.5, 5, 10, 15 and 20 µM) (n = 6 per group). B-C. H3K27ac, H3K18ac, and H2BK5ac protein levels in HASMCs treated with A-485 at different concentrations of 0, 0.5, 1, 2.5, 5 and 10 µM were measured by western blot (n = 4 per group). β-actin served as a loading control. D. Representative images showing cell death after treatment with DMSO and A-485 under the ferroptosis models induced by CD and IKE, alone or in combination with Fer-1. E-F. The CCK8 assay showed the relative viability of HASMCs treated with DMSO and A-485 after CD (E), IKE (F), alone or in combination with Fer-1 stimulation for the indicated time (E: n = 4 per group, F: n = 5 per group). G. An LDH assay was performed to examine the cell death of HASMCs after treating as described above (n = 5 per group). H-I. Flow cytometry with PI staining showed the percentage of PI positive cells after treatment with DMSO and A-485 under the ferroptosis models induced by CD (H), IKE (I), alone or in combination with Fer-1 (n = 4 per group). Values are means ± SD; ***p < 0.001, NS, no significant
Fig. 5
Fig. 5
A-485 aggravated the accumulation of lipid peroxidation during HASMC ferroptosis. A-D. The ratio of oxidized BODIPY-C11/non-oxidized BODIPY-C11 fluorescence detected by the BODIPY-C11 kit after treatment with DMSO and A-485 under the ferroptosis models induced by CD (A-B), IKE (C-D), alone or in combination with Fer-1 (n = 3 per group). E and G. Representative images of 4-HNE immunofluorescence staining in HASMCs treated with DMSO and A-485 after CD (E), IKE (G), alone or in combination with Fer-1 stimulation for the indicated time. F and H. Quantitative analysis of 4-HNE immunofluorescence staining (n = 4 per group). I-J. The level of MDA in HASMCs treated as described above was examined by an MDA assay kit (n = 3 per group). Values are means ± SD; ***p < 0.001, **p < 0.01, *p < 0.05, NS, no significant
Fig. 6
Fig. 6
P300 and P53 competitively bind HIF-1α to regulate HMOX1 expression during ferroptosis of HASMCs. A-B. Western blot analysis and quantification results showing SLC7A11, GPX4, and FSP1 protein levels after CD (A), and IKE (B) stimulation in HASMCs infected with lenti-shRNA, lenti-shP300-1 and lenti-shP300-2 (A-B), β-actin served as a loading control (n = 4 per group). C-D. Western blot analysis and quantification results showing HMOX1 protein levels in HASMCs infected with lenti-shRNA, lenti-shP300-1 and lenti-shP300-2 after CD and IKE stimulation. β-actin served as a loading control (n = 4 per group). E. Co-immunoprecipitation results showed that endogenous P300 interacted with exogeneous HIF-1α in HASMCs after treatment with MG132. F. The interaction between endogenous HIF-1α and exogenous P300 in 293T cells after treatment with MG132 was verified by Co-immunoprecipitation. G. Co-immunoprecipitation showed the interaction between endogenous HIF-1α and endogenous P300 and P53 after treatment with CD and MG132 in nucleus of HASMCs. Values are means ± SD; ***p < 0.001, NS, no significant
Fig. 7
Fig. 7
HIF-1α downregulation abolished the pro-ferroptotic effects of P300 deficiency in HASMCs. P300 knockdown HASMCs were infected with lenti-shRNA and lenti-shHIF-1α, and then these HASMCs were used for subsequent experiments. A-B. Relative cell viability was evaluated by CCK8 kit in HASMCs after treatment with CD (A) and IKE (B) (n = 5 per group). C-F. The level of lipid ROS (oxidized BODIPY-C11/non-oxidized BODIPY-C11 fluorescence ratio) examined by the BODIPY-C11 kit in HASMCs treated with CD (C-D) and IKE (E-F) (n = 4 per group). G-H. An MDA assay was used to detect the MDA levels of HASMCs after treatment with CD (G) and IKE (H) (n = 4 per group). I-L. Representative images of immunofluorescence staining and quantitative analysis of 4-HNE in HASMCs among the indicated groups (n = 4 per group). Values are means ± SD; ***p < 0.001, **p < 0.01, *p < 0.05, NS, no significant
Fig. 8
Fig. 8
HIF-1α inhibition eliminated the pro-ferroptotic effects of P300 deficiency in HASMCs. A-B. Relative cell viability of HASMCs infected with lenti-shRNA, lenti-shP300-1, and lenti-shP300-2 by using a CCK8 kit after treatment with CD (A) and IKE (B) in the presence or absence of BAY87-2243 (n = 4 per group). C-F. The oxidized BODIPY-C11/non-oxidized BODIPY-C11 fluorescence ratio was evaluated by BODIPY-C11 kit in the indicated lentivirus-infected HASMCs treated with DMSO and BAY87-2243 after CD (C-D) and IKE (E-F) stimulation for 16 h (n = 4 per group). G-H. An MDA assay was used to assess MDA levels in indicated lentivirus-infected HASMCs treated with DMSO and BAY87-2243 after CD (G) and IKE (H) stimulation for the indicated time (n = 4 per group). I-L. Representative images of immunofluorescence staining and quantitative analysis of 4-HNE in HASMCs among the indicated groups in the presence or absence of BAY87-2243 (n = 4 per group). Values are means ± SD; ***p < 0.001, **p < 0.01, *p < 0.05, NS, no significant
Fig. 9
Fig. 9
Schematic summary. P300 deficiency and inhibition induced VSMC ferroptosis by activating the HIF-1α/HMOX1 axis. P300 and P53 competitively bound HIF-1α to regulate HMOX1 expression. Under normal conditions, P300 interacted with HIF-1α to inhibit HMOX1 expression. When treatment with ferroptosis inducers, the decrease of P300 contributed to the interaction between P53 and HIF-1α to activate HMOX1 transcription. The activation of HMOX1 decreased cell viability and aggravated lipid peroxidation and further triggered ferroptosis

References

    1. Bouchal J, Santer FR, Hoschele PP, Tomastikova E, Neuwirt H, Culig Z. Transcriptional coactivators p300 and CBP stimulate estrogen receptor-beta signaling and regulate cellular events in prostate cancer. Prostate. 2011;71:431–7. doi: 10.1002/pros.21257. - DOI - PubMed
    1. Chakraborty R, Ostriker AC, Xie Y, Dave JM, Gamez-Mendez A, Chatterjee P, et al. Histone acetyltransferases p300 and CBP coordinate distinct chromatin remodeling programs in vascular smooth muscle plasticity. Circulation. 2022;145:1720–37. doi: 10.1161/CIRCULATIONAHA.121.057599. - DOI - PubMed
    1. Chen TQ, Hu N, Huo B, Masau JF, Yi X, Zhong XX, et al. EHMT2/G9a inhibits aortic smooth muscle cell death by suppressing autophagy activation. Int J Biol Sci. 2020;16:1252–63. doi: 10.7150/ijbs.38835. - DOI - PMC - PubMed
    1. Chen Y, He Y, Wei X, Jiang DS. Targeting regulated cell death in aortic aneurysm and dissection therapy. Pharmacol Res. 2022;176:106048. doi: 10.1016/j.phrs.2021.106048. - DOI - PubMed
    1. Chen Y, Yi X, Huo B, He Y, Guo X, Zhang Z, et al. BRD4770 functions as a novel ferroptosis inhibitor to protect against aortic dissection. Pharmacol Res. 2022;177:106122. doi: 10.1016/j.phrs.2022.106122. - DOI - PubMed

Publication types

MeSH terms