. 2023 Jul 6;24(1):379.
doi: 10.1186/s12864-023-09499-8.

Comparative genomics reveals insights into anuran genome size evolution

Affiliations

Comparative genomics reveals insights into anuran genome size evolution

Bin Zuo et al. BMC Genomics. .

Abstract

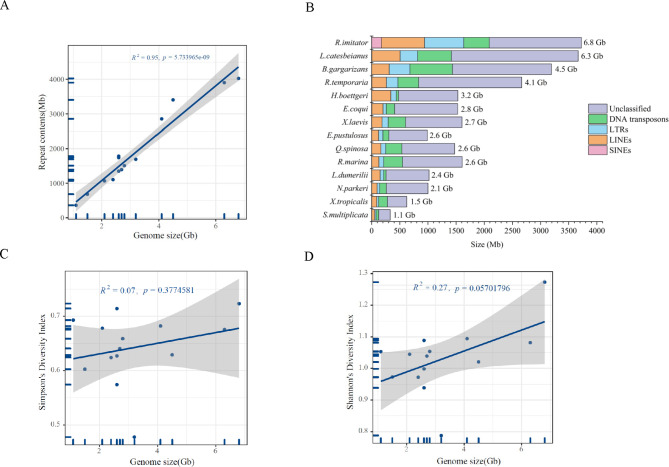
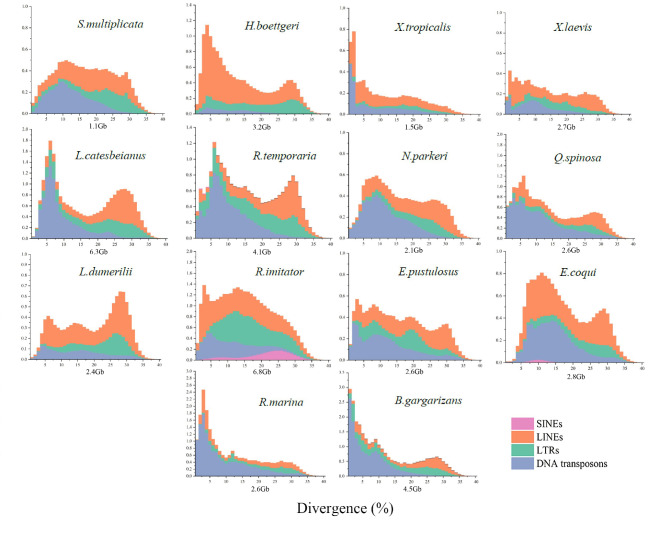
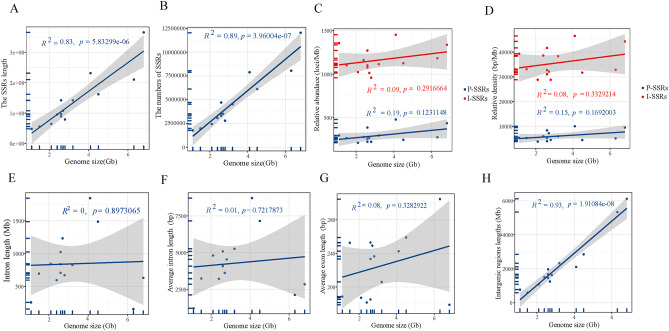
Background: Amphibians, particularly anurans, display an enormous variation in genome size. Due to the unavailability of whole genome datasets in the past, the genomic elements and evolutionary causes of anuran genome size variation are poorly understood. To address this, we analyzed whole-genome sequences of 14 anuran species ranging in size from 1.1 to 6.8 Gb. By annotating multiple genomic elements, we investigated the genomic correlates of anuran genome size variation and further examined whether the genome size relates to habitat types.

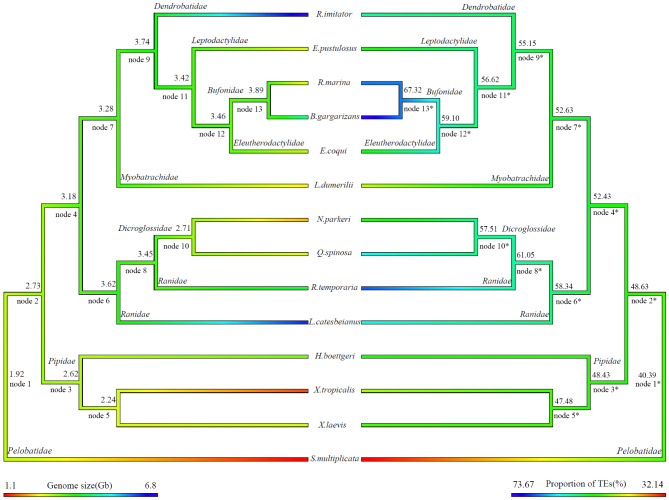
Results: Our results showed that intron expansions or contraction and Transposable Elements (TEs) diversity do not contribute significantly to genome size variation. However, the recent accumulation of transposable elements (TEs) and the lack of deletion of ancient TEs primarily accounted for the evolution of anuran genome sizes. Our study showed that the abundance and density of simple repeat sequences positively correlate with genome size. Ancestral state reconstruction revealed that genome size exhibits a taxon-specific pattern of evolution, with families Bufonidae and Pipidae experiencing extreme genome expansion and contraction events, respectively. Our result showed no relationship between genome size and habitat types, although large genome-sized species are predominantly found in humid habitats.

Conclusions: Overall, our study identified the genomic element and their evolutionary dynamics accounting for anuran genome size variation, thus paving a path to a greater understanding of the size evolution of the genome in amphibians.

Keywords: Anurans; Genome size variation; Simple repeat sequences; Transposable elements.


Conflict of interest statement

The authors declare no competing interests.

Figures

Fig. 1
Fig. 1
Shows the association between genome size and repetitive sequences/transposable elements diversity index in anuran species. (A) Positive correlation between genome size and repetitive elements. The X-axis shows the genome size, the length of the repetitive elements by the Y-axis, and the 95% confidence interval by the gray region. (B) Abundance and Distribution of the Transposable elements across anuran species. (C) Genome size and transposable element diversity index (Simpson diversity index). (D) Genome size and transposable element diversity index (Shannon Diversity Index). Gray shade represents the 95% confidence interval
Fig. 2
Fig. 2
Transposable element age distribution landscapes of anuran genome sizes. The Y-axis shows the genomic coverage of different types of TEs, and the X-axis shows the Kimura substitution level as a percentage from 0 to 40. The Y-axis represents TE abundance as a proportion of the genome (e.g., 1.0 = 1% of the genome). The distribution landscape of TE divergence is categorized as follows: L-shaped distribution (TE divergence peak less than or equal to 5%), bimodal distribution (two peaks occur), or multi-peaked distribution (more than two peaks occur)
Fig. 3
Fig. 3
Relationship between anuran genome size and exons, introns, intergenic regions and Simple Sequence Repeats, respectively. (Gray shade represents the 95% confidence interval) Figures A, B, C, D, E, F, G, and H represent the relationship between genome size and length of SSRs, number of SSRs, relative abundance of SSRs, relative density of SSRs, intron length, average intron length, average exon length, and intergenic region length for 14 anuran species
Fig. 4
Fig. 4
Reconstruction ancestral state of anuran genome size(left) and proportion of Transposable Elements(right) across 14 anuran species. Branching colors represent values reconstructed from phylogenetic relationships. The names and values on the nodes represent ancestral names and ancestral values for the branches, including Pipidae, Ranidae, Bufonidae, Dendrobatidae, Dicroglossidae, Eleutherodactylidae, Leptodactylidae, Myobatrachidae and Pelobatidae. In the figure, the nodes in the size branch of the genome (left) are represented by “node + number” (e.g., node 1), and the nodes in the TE branch are represented by “node + number*” (e.g., node 1*)

References

    1. Gregory TR. Coincidence, coevolution, or causation? DNA content, cell size, and the C-value enigma. Biol Rev. 2001;76(1):65–101. doi: 10.1017/S1464793100005595. - DOI - PubMed
    1. Gall JG. Chromosome structure and the C-value paradox. J Cell Biol. 1981;91(3 Pt 2):3s–14s. doi: 10.1083/jcb.91.3.3s. - DOI - PMC - PubMed
    1. Hahn MW, Wray GA. The g-value paradox. Evol Dev. 2002;4(2):73–5. doi: 10.1046/j.1525-142X.2002.01069.x. - DOI - PubMed
    1. Elliott TA, Gregory TR. Do larger genomes contain more diverse transposable elements? Bmc Evol Biol 2015, 15. - PMC - PubMed
    1. Petrov DA. Evolution of genome size: new approaches to an old problem. Trends Genet. 2001;17(1):23–8. doi: 10.1016/S0168-9525(00)02157-0. - DOI - PubMed

Substances

LinkOut - more resources