. 2023 Jul 6;24(1):160.
doi: 10.1186/s13059-023-03002-y.

Intronic small nucleolar RNAs regulate host gene splicing through base pairing with their adjacent intronic sequences

Affiliations

Intronic small nucleolar RNAs regulate host gene splicing through base pairing with their adjacent intronic sequences

Danny Bergeron et al. Genome Biol. .

Abstract

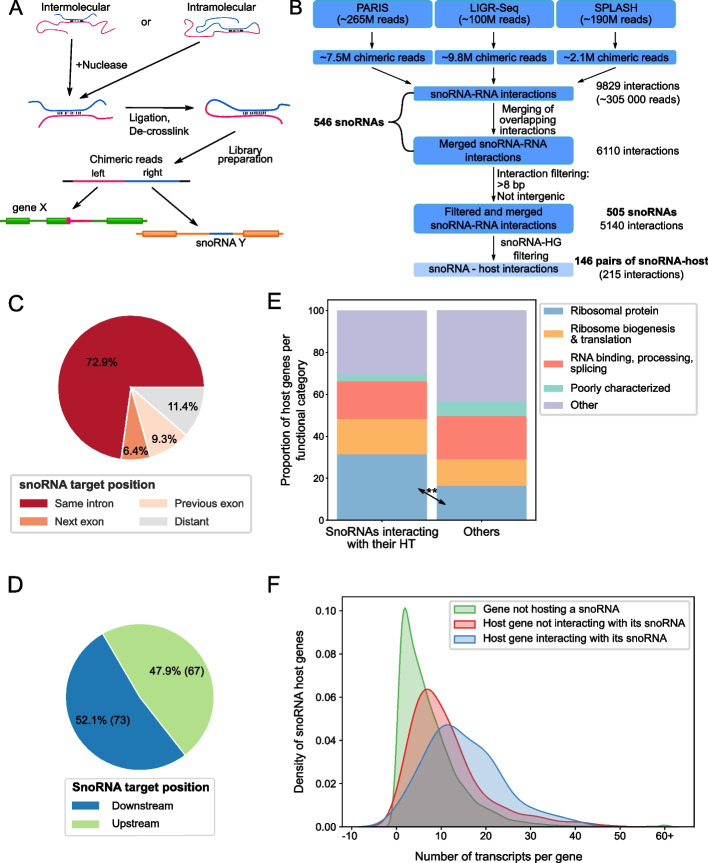
Background: Small nucleolar RNAs (snoRNAs) are abundant noncoding RNAs best known for their involvement in ribosomal RNA maturation. In mammals, most expressed snoRNAs are embedded in introns of longer genes and produced through transcription and splicing of their host. Intronic snoRNAs were long viewed as inert passengers with little effect on host expression. However, a recent study reported a snoRNA influencing the splicing and ultimate output of its host gene. Overall, the general contribution of intronic snoRNAs to host expression remains unclear.

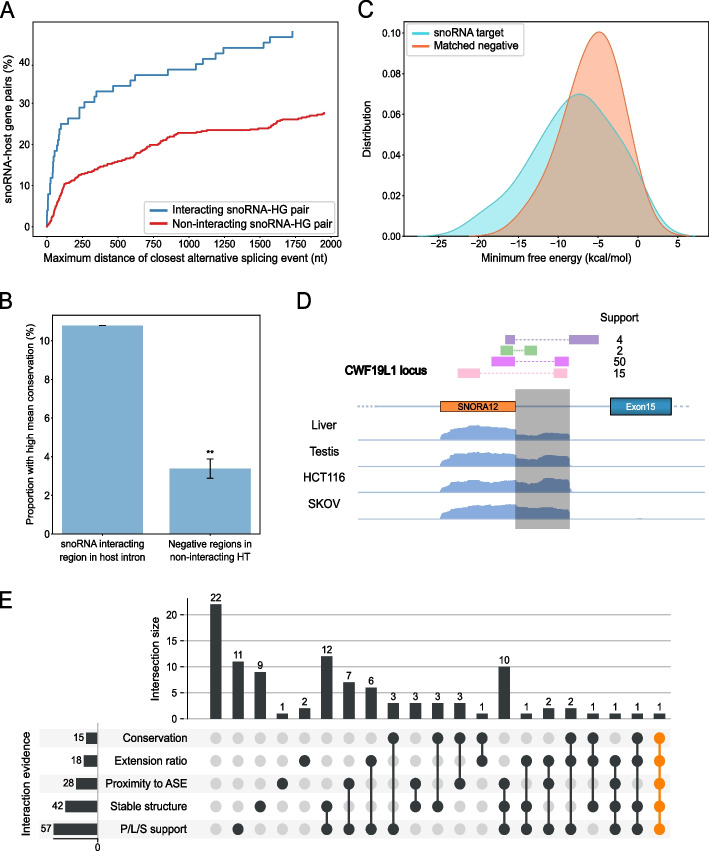
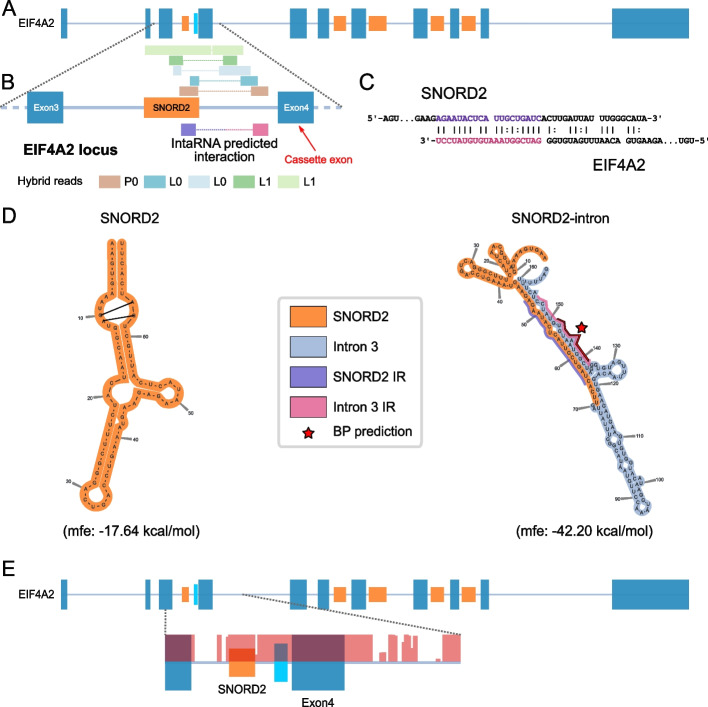
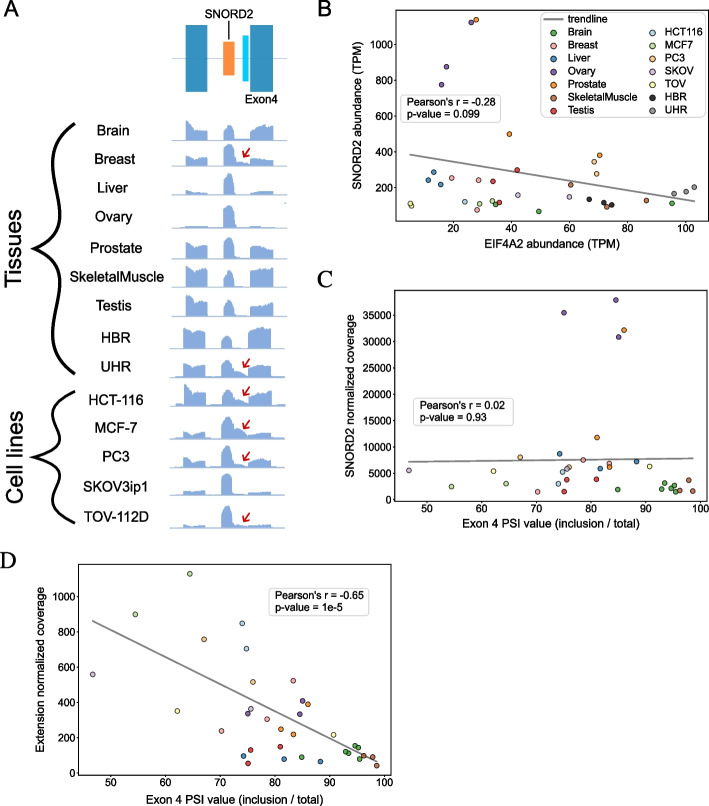
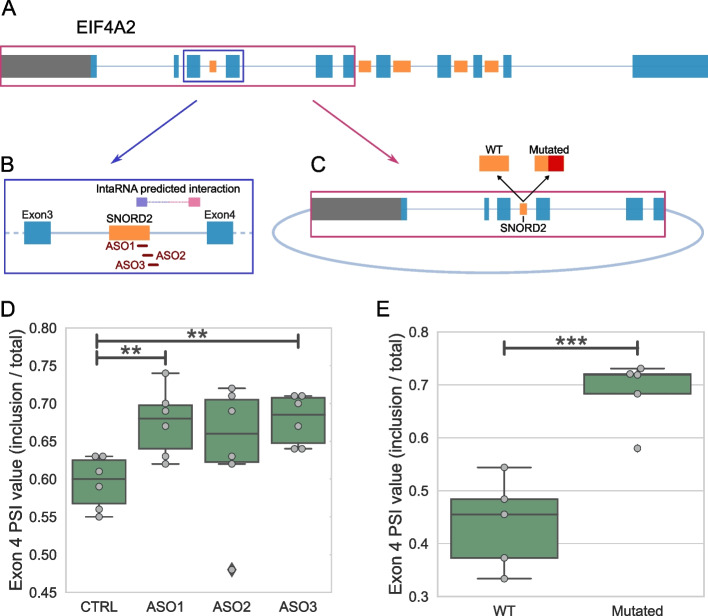
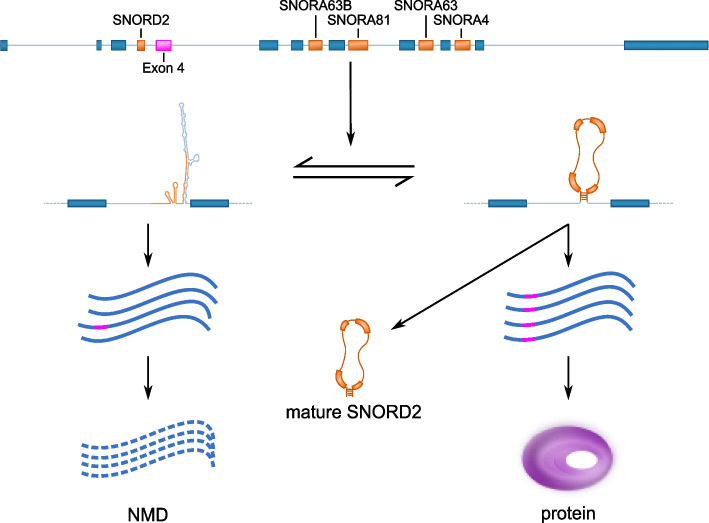
Results: Computational analysis of large-scale human RNA-RNA interaction datasets indicates that 30% of detected snoRNAs interact with their host transcripts. Many snoRNA-host duplexes are located near alternatively spliced exons and display high sequence conservation suggesting a possible role in splicing regulation. The study of the model SNORD2-EIF4A2 duplex indicates that the snoRNA interaction with the host intronic sequence conceals the branch point leading to decreased inclusion of the adjacent alternative exon. Extended SNORD2 sequence containing the interacting intronic region accumulates in sequencing datasets in a cell-type-specific manner. Antisense oligonucleotides and mutations that disrupt the formation of the snoRNA-intron structure promote the splicing of the alternative exon, shifting the EIF4A2 transcript ratio away from nonsense-mediated decay.

Conclusions: Many snoRNAs form RNA duplexes near alternative exons of their host transcripts, placing them in optimal positions to control host output as shown for the SNORD2-EIF4A2 model system. Overall, our study supports a more widespread role for intronic snoRNAs in the regulation of their host transcript maturation.

Keywords: Alternative splicing regulation; Cis-regulation; Intron; Nonsense-mediated decay; RNA secondary structure; RNA-RNA interactions; SnoRNA; SnoRNA/host gene relationship.


Conflict of interest statement

The authors declare that they have no competing interests.

Figures

Fig. 1
Fig. 1
Many snoRNAs show an interaction with their host gene transcripts. A General methodology shared between PARIS, LIGR-Seq, and SPLASH. The blue and pink lines represent two interacting RNA molecules. B Pipeline for de novo analysis of PARIS, LIGR-Seq, and SPLASH. Starting with over half a billion raw reads and keeping only chimeric reads involving snoRNAs left close to 305,000 reads which after merging overlapping reads, resulted in 6110 distinct interactions. Filtering of short interactions (≤ 8 bp) and interactions involving intergenic regions left 5140 interactions involving snoRNAs. Interactions composed of the snoRNA and its host gene (HG) transcripts were extracted (lighter blue; 215 interactions), and from those, 140 were identified between the snoRNA and a protein-coding HG. C, D Distribution of the position of the snoRNA target (i.e., interacting region) in the HG. E Comparison of functional classification of HGs between snoRNAs that interact with their host transcript (HT) vs the others. **p < 0.01. F SnoRNAs interacting with their HG are encoded in genes with complex regulation producing large numbers of transcripts. Density plot of the total number of transcripts for each protein-coding gene according to Ensembl annotation (v101). All distributions were significantly different from each other according to the Mann–Whitney U test, p-values 1.0e − 26 and 1.6e − 05 for hosts non-interacting with their snoRNA (red) vs non-host (green) and interacting snoRNA hosts (blue) vs non-interacting snoRNA hosts (red), respectively
Fig. 2
Fig. 2
Characteristics of snoRNAs interacting with their host introns support functional regulatory relationships. A SnoRNAs interacting with their HG are in close proximity to alternative splicing events. Cumulative percentage plots of the distance to the closest alternative splicing event for both snoRNAs interacting with their host intron (blue) and all other snoRNAs (red) are shown. A Mann–Whitney U test showed a significant difference between the two distributions, p = 1.2e − 5. B Intronic interaction regions between snoRNAs and host introns display unexpected levels of conservation. Bar chart showing the proportion of snoRNA-intronic interaction regions with high conservation compared to negative regions located at same distance from snoRNAs not interacting with their host transcript (HT). The mean conservation of the target regions was calculated using PhastCons on 100 vertebrates. **p < 0.01. C Minimum free energy (mfe) predicted by IntaRNA is significantly lower (Kolmogorov–Smirnov test, p = 0.038) for snoRNAs and target regions than snoRNA and matched negative regions. D TGIRT-Seq read coverage was observed from the 3′ end of SNORA12 to the intron interacting region, located in the CWF19L gene. Reads detected in two LIGR-seq datasets are shown as colored rectangles with their corresponding support (i.e., number of reads observed). Such an extension was observed for a total of 18 snoRNAs (Additional file 2: Table S1). E Upset plot displaying the features supporting a functional relationship for each of the 102 detected interactions between snoRNAs and their own intron in a protein-coding host gene. To be positive in one category, the interaction was required to pass the following thresholds: P/L/S support > 3 detected chimeric reads, stable structure required a minimal energy of the interaction duplex < 0 kcal/mol, average conservation score > 0.2, proximity to ASE required a splicing distance of closest alternative event < 150 nt and extension ratio > 2
Fig. 3
Fig. 3
The interaction between SNORD2 and its host transcript is predicted to mask the branch point. A SNORD2 is encoded in the 3rd intron of the EIF4A2 gene, which serves as a host gene for a total of 5 snoRNAs. SnoRNAs are shown in orange, exons in steel blue, and the SNORD2 interacting region in cyan and introns are displayed as lines. B Both PARIS and LIGR-seq methodologies detect interactions between SNORD2 and its host intron. Zoom in from panel A representing exons 3 and 4 of EIF4A2 as well as the intervening intron containing SNORD2. Chimeric reads detected in PARIS and LIGR-seq datasets are represented above the gene diagram. The interaction position between SNORD2 and its intron as predicted by IntaRNA (shown in C) is indicated on the diagram. C IntaRNA duplex prediction between SNORD2 and Intron 3 (minimal free energy − 5.76 kcal/mol). D SNORD2 forms a stable structure with the downstream part of intron 3. SNORD2 and SNORD2-intron were folded using the LinearPartition tool. The highly paired region (pink and violet) was also predicted by IntaRNA (see panels B and C). The branch point (BP) for the intron as predicted by the branchpointer R package is located in the middle of this strong interaction. IR: interaction region. E The target region of SNORD2 in intron 3 of EIF4A2 is highly conserved. PhastCons score (100 vertebrates) was used to represent the conservation of the EIF4A2 gene region from exon 3 to intron 4 (salmon overlay). The target region is represented in cyan
Fig. 4
Fig. 4
The SNORD2-intron structure is correlated with the splicing level of the exon 4 of EIF4A2. A SNORD2-intron is detected in RNA-seq (TGIRT-Seq) in normal human tissues and in human cell lines. Bedgraphs of RNA-Seq read profiles of the EIF4A2 exon 3–4 genomic region from normal human tissues and human cell lines show the presence of accumulation in the intronic SNORD2 interaction region (in cyan in schema at top). Red arrows show the tissues or cell lines having clear read accumulations in the intron target region. B Correlation between mature SNORD2 and EIF4A2 abundance. Scatterplot showing the abundance of the mature form of SNORD2 and of the total transcript level of EIF4A2 in the indicated tissues and cell lines. A light non-significant negative correlation was found between the level of abundance of SNORD2 compared to the level of abundance of EIF4A2 gene. C No correlation was found between the abundance of mature SNORD2 and the splicing of EIF4A2 exon 4. PSI: percent spliced in. D A significant negative correlation was found between the abundance of the SNORD2 extension and the splicing of EIF4A2 exon 4
Fig. 5
Fig. 5
Blocking the folding of the SNORD2-intron modulates the level of exon 4 inclusion. A–C Schematic representation of the double strategy to investigate the effect of blocking the SNORD2-intron on the inclusion of exon 4 of the EIF4A2 gene. The strategy includes applying ASOs designed against the SNORD2-intron, highlighted in the blue box (B). ASO1 is entirely located inside the SNORD2 sequence, while ASO2 overlaps with SNORD2 and the intron and ASO3 is mainly in the intron. The second prong of the strategy involves a minigene of the 5′ of the EIF4A2 gene, from the promoter to the 3′ end of its exon 6, highlighted in the red box (C). A mutant of the minigene was also designed with the 30 nucleotides 3′ most in SNORD2 mutated so they are no longer complementary to the branch point regions of intron 3 of EIF4A2. D Box plot showing the modulation of the percent spliced in (PSI) value of exon 4 of EIF4A2 following treatment with different ASOs in 6 different replicates. E Box plot showing the modulation of the PSI value of exon 4 of EIF4A2 in the mutant minigene as compared to the wild-type (WT). **p < 0.01 and ***p < 0.001
Fig. 6
Fig. 6
Model of the impact of SNORD2 folding on the processing of its host gene. The SNORD2 sequence in the EIF4A2 pre-mRNA can fold in a canonical way to produce the mature SNORD2, resulting in EIF4A2 transcripts including exon 4 and the production of EIF4A2 proteins. Alternatively, SNORD2 can fold into its downstream intronic region, masking the branch point of intron 3, which will lead to the exclusion of exon 4. Transcripts lacking exon 4 contain a premature stop codon in exon 5 and will be rapidly targeted and degraded by the NMD pathway [45]

Similar articles

Cited by

References

    1. Dieci G, Preti M, Montanini B. Eukaryotic snoRNAs: a paradigm for gene expression flexibility. Genomics. 2009;94:83–88. doi: 10.1016/j.ygeno.2009.05.002. - DOI - PubMed
    1. Filipowicz W, Pelczar P, Pogacic V, Dragon F. Structure and biogenesis of small nucleolar RNAs acting as guides for ribosomal RNA modification. Acta Biochim Pol. 1999;46:377–389. doi: 10.18388/abp.1999_4171. - DOI - PubMed
    1. Kiss T. Small nucleolar RNA-guided post-transcriptional modification of cellular RNAs. EMBO J. 2001;20:3617–3622. doi: 10.1093/emboj/20.14.3617. - DOI - PMC - PubMed
    1. Lestrade L, Weber MJ. snoRNA-LBME-db, a comprehensive database of human H/ACA and C/D box snoRNAs. Nucleic Acids Res. 2006;34:D158–162. doi: 10.1093/nar/gkj002. - DOI - PMC - PubMed
    1. Bachellerie JP, Cavaillé J, Hüttenhofer A. The expanding snoRNA world. Biochimie. 2002;84:775–790. doi: 10.1016/S0300-9084(02)01402-5. - DOI - PubMed

Publication types