. 2023 Dec 31;15(1):2223327.
doi: 10.1080/19382014.2023.2223327.

EP3 signaling is decoupled from the regulation of glucose-stimulated insulin secretion in β-cells compensating for obesity and insulin resistance

Affiliations

EP3 signaling is decoupled from the regulation of glucose-stimulated insulin secretion in β-cells compensating for obesity and insulin resistance

Michael D Schaid et al. Islets. .

Abstract

Of the β-cell signaling pathways altered by obesity and insulin resistance, some are adaptive while others contribute to β-cell failure. Two critical second messengers are Ca2+ and cAMP, which control the timing and amplitude of insulin secretion. Previous work has shown the importance of the cAMP-inhibitory Prostaglandin EP3 receptor (EP3) in mediating the β-cell dysfunction of type 2 diabetes (T2D). Here, we used three groups of C57BL/6J mice as a model of the progression from metabolic health to T2D: wildtype, normoglycemic LeptinOb (NGOB), and hyperglycemic LeptinOb (HGOB). Robust increases in β-cell cAMP and insulin secretion were observed in NGOB islets as compared to wildtype controls; an effect lost in HGOB islets, which exhibited reduced β-cell cAMP and insulin secretion despite increased glucose-dependent Ca2+ influx. An EP3 antagonist had no effect on β-cell cAMP or Ca2+ oscillations, demonstrating agonist-independent EP3 signaling. Finally, using sulprostone to hyperactivate EP3 signaling, we found EP3-dependent suppression of β-cell cAMP and Ca2+ duty cycle effectively reduces insulin secretion in HGOB islets, while having no impact insulin secretion on NGOB islets, despite similar and robust effects on cAMP levels and Ca2+ duty cycle. Finally, increased cAMP levels in NGOB islets are consistent with increased recruitment of the small G protein, Rap1GAP, to the plasma membrane, sequestering the EP3 effector, Gɑz, from inhibition of adenylyl cyclase. Taken together, these results suggest that rewiring of EP3 receptor-dependent cAMP signaling contributes to the progressive changes in β cell function observed in the LeptinOb model of diabetes.

Keywords: Diabetes; EP3 receptor; Gɑz; Rap1gap; cAMP; hyperglycemia; insulin secretion; prostaglandins; β-cell.


Conflict of interest statement

No potential conflict of interest was reported by the author(s).

Figures

None
Graphical abstract
Graphs showing increased blood glucose, and decreased islet insulin content, increased Ptger3 expression from WT to NGOB to HGOB mice, with no effects on expression of islet PGE2 synthetic genes or PGE2 excretion.
Figure 1.
Expression of EP3 is associated with impaired insulin secretion independent of PGE2 production. (a) Blood glucose levels in C57Bl/6J wild-type (WT), normoglycemic Leptinob (NGOB) and hyperglycemic Leptinob (HGOB) mice. N = 13–18. (b) Islet insulin content. N = 7–10. (c) Relative Ptger3 transcript levels normalized to Actb. N = 9–15. (d) Relative Ptger3 isoform transcript levels normalized to Actb. N = 4–12. (e) Selected PGE2 synthetic enzymes (Pt2g4a, Ptgs1, and Ptgs2) as normalized to Actb. N = 4–12. (f) 24 h PGE2 excretion from cultured islets. N = 6–8. In all cases, N=individual mice or mouse islet preparations, and data represent the mean ± SEM. Data was analyzed by one-way ANOVA with Tukey test post-hoc (A-C, F) or multiple t-test corrected with Tukey test post-hoc (D,E). *P<.05; **P<.01; ***P<.001; and ****P<.0001. ns = not significant.
Confocal microscopy image of mouse islet transduced with β-cell-specific FRET sensor, graphs of cAMP FRET in response to IBMX, glucose, and exendin-4, and graphs of total and fractional insulin secretion showing effects on cAMP production correlate with effects on insulin secretion in WT, NGOB, and HGOB islets.
Figure 2.
Validation of β-cell-specific cAMP FRET sensor and correlation of β-cell cAMP levels with islet pathophysiology. (a) 3D projection of WT islets expressing the β-cell specific cAMP biosensor (Epac-SH187) as recorded by two-photon microscopy. (b) Normalized fluorophore intensity (left), FRET ratio (middle) and average FRET ratio (right) from WT islets expressing cAMP biosensor treated with 100 μM 3-Isobutyl −1-methylxanthine (IBMX). N = 7 islets. Scale bar = 0.02. (c) Glucose stimulated insulin secretion from WT, NGOB and HGOB islets treated with 3.3 mM glucose or 8.3 mM glucose ±10 nM E x 4. Data is represented as both total insulin secreted (left) and fractional insulin secretion as a percent of total insulin content. N = 7–10 mice. (d) Representative Ca2+ recordings and duty cycle quantification of WT, NGOB and HGOB islets treated with 9 mM glucose followed by 9 mM glucose +10 nM E x 4. Scale bar = 0.01. (e) Representative average cAMP recordings and quantification of WT, NGOB, and HGOB islets treated with 9 mM glucose followed by 9 mM glucose +10 nM E x 4. N = 55–72 islets from three mice (NGOB and HGOB) and 90 islets from six mice (WT). Scale bar = 0.025. Error bars represent the standard error of the mean (SEM). Data was analyzed by one-way ANOVA with Tukey test post-hoc within groups and multiple T-test with Tukey test post-hoc among groups.*p < 0.05, **p < 0.01, ***p < 0.001, ****p < 0.0001. For panel E, ****p < 0.0001 as compared to WT and ####p <0.0001 as compared to NGOB.
Graphs showing that DG041 has no effects on insulin secretion, β-cell Ca2+ duty cycle, or β-cell cAMP production in WT, NGOB, and HGOB islets.
Figure 3.
Agonist-sensitive EP3 signaling does not influence WT, NGOB, or HGOB β-cell cAMP production or function. (a) Glucose stimulated insulin secretion from WT, NGOB and HGOB islets treated with 3.3 mM glucose or 8.3 mM glucose ±10 nM DG041. Data are represented as both total insulin secreted (left) and fractional insulin secretion as a percent of total insulin content. N = 7–10 mice. (b) Representative Ca2+ recordings and duty cycle quantification of WT, NGOB and HGOB islets treated with 9 mM glucose followed by 9 mM glucose +10 nM DG041. Scale bar = 0.01. (c) Representative average cAMP recordings and quantification of WT, NGOB and HGOB islets treated with 9 mM glucose followed by 9 mM glucose +10 nM DG041. Scale bar = 0.025. In (B) and (C), N = 55–72 islets from three mice (NGOB and HGOB) and 108 islets from six mice (WT). Error bars represent the standard error of the mean (SEM). Data was analyzed by one-way ANOVA among groups or multiple T-test by treatment, both with Tukey test post-hoc.*p < 0.05, **p < 0.01, ***p < 0.001, ****p < 0.0001. For panel C, ****p < 0.0001 as compared to WT and ####p <0.0001 as compared to NGOB.
Graphs showing that sulprostone reduces Ca2+ duty cycle and β-cell cAMP production in both NGOB and HGOB islets, but only affects insulin secretion in islets from HGOB mice.
Figure 4.
The EP3 agonist sulprostone reduces Ca2+ duty cycle and cAMP levels but inhibits insulin secretion only in failing β-cells. (a) Glucose stimulated insulin secretion from WT, NGOB and HGOB islets treated with 3.3 mM glucose or 8.3 mM glucose ±10 nM sulprostone. Data is represented as both total insulin secreted (left) and fractional insulin secretion as a percent of total insulin content. N = 7–10 mice. (b) Representative Ca2+ recordings and duty cycle quantification of WT, NGOB and HGOB islets treated with 9 mM glucose followed by 9 mM glucose +10 nM sulprostone. Scale bar = 0.01. (c) Representative average cAMP recordings and quantification of WT, NGOB and HGOB islets treated with 9 mM glucose followed by 9 mM glucose +10 nM sulprostone. Scale bar = 0.025. In (B) and (C), N = 55–82 islets from three mice (NGOB and HGOB) and 84 islets from six mice (WT). Error bars represent the standard error of the mean (SEM). Data was analyzed by one-way ANOVA among groups or multiple T-test by treatment, both with Tukey test post-hoc.*p < 0.05, **p < 0.01, ***p < 0.001, ****p < 0.0001. For panel C, ****p < 0.0001 as compared to WT and #### p < 0.0001 as compared to NGOB.
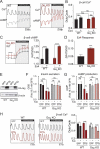
Graphs showing that Gɑz-null islets have higher β-cell cAMP levels and respond more strongly to Ex4 to potentiate cAMP levels. Graphs showing EP3γ expression reduces islet cAMP production and GSIS in a Gɑz-dependent manner, but the effect of sulprostone to reduce Ca2+ duty cycle is Gɑz-independent.
Figure 5.
Gaz-null islets have higher cAMP levels and E x 4 response, and EP3γ reduces cAMP production and GSIS or Ca2+ duty cycle in a Gɑz-dependent or -independent manner, respectively. (a) Representative simultaneous recordings of Ca2+ and cAMP in WT and Gαz KO islets treated with 9 mM glucose followed by 9 mM glucose +10 nM exendin − 4 (E x 4). Scale bars: Ca2+ = 0.1 and R470/530 (cAMP) = 0.02. (b) Quantification of islet Ca2+ duty cycle for the data shown in (A). (c) Average temporal (left) and pre/post E x 4 (right) cAMP levels for the experiments represented in (A). (d) Islet E x 4 response, as calculated by normalizing the mean cAMP levels in 9 mM glucose + E x 4 to those in 9 mM glucose alone. In A-D, N = 67–72 islets from three mice each. (e) Representative Western blot of WT and Gɑz knockout (KO) C57Bl/6N islets transduced with an adenovirus encoding HA-tagged EP3γ or a GFP control adenovirus. (f) Insulin secreted in 16.7 mM glucose from cultured islets isolated from WT or Gαz KO mice expressing EP3γ or GFP control, with and without 10 nM sulprostone. Within each experiment, the GSIS response of a group was normalized to that of its GFP control. N = 3 independent experiments. Figure adapted from Schaid et al., 2021. (g) cAMP production from cultured islets isolated from WT or Gαz KO mice expressing EP3γ or GFP control, with and without 10 nM sulprostone. Within each experiment, the GSIS response of a group was normalized to that of its GFP control. Figure adapted from Schaid et al., 2021. (h) Representative recordings of Ca2+ oscillations (left) and duty cycle quantification (right) in islets isolated from WT or Gαz KO mice expressing EP3γ or GFP control, with and without 10 nM sulprostone. N = 3 independent experiments. In all panels, error bars represent the standard error of the mean (SEM). Data was analyzed by two-way ANOVA with Tukey test post hoc (A-E) or multiple unpaired t-test corrected with Holm-Sidak test post-hoc, or unpaired t-test (F). *p < 0.05, **p < 0.01, ***p < 0.001, and ****p < 0.0001.
Figure showing high Rap1GAP intensity in membrane lysates from NGOB mice, and graphs showing increased Rap1GAP expression, Rap1GAP membrane abundance, and phospho-PKA substrate abundance.
Figure 6.
Expression and membrane localization of the Gαz effector, Rap1GAP, is associated with higher cAMP signaling in islets from highly compensating NGOB mice. (a) Representative Western blot of Rap1GAP (total cellular and membrane-associated) and β-actin in WT, NGOB and HGOB islets. (b) Quantification of total cellular Rap1GAP in WT, NGOB and HGOB islets, as normalized to β-actin. (c) Quantification of membrane-associated Rap1GAP in WT, NGOB and HGOB islets, as normalized to β-actin. (d) Representative Western blot of phospho-PKA substrate in WT, NGOB, and HGOB islets. (e) Quantification of phospho-PKA substrate as normalized to β-actin. In (B), (C), and (E), data were normalized to relative WT expression. n = 4–10 mice/group. Error bars represent the standard error of the mean (SEM). In (B), (C), and (E), data was analyzed with one-way ANOVA with Tukey test post hoc *p < 0.05, **p < 0.01, ***p < 0.001.

References

    1. Drucker DJ. Mechanisms of action and therapeutic application of glucagon-like peptide-1. Cell Metab. 2018;27(4):740–16. doi:10.1016/j.cmet.2018.03.001. - DOI - PubMed
    1. Fujita H, Kakei M, Fujishima H, Morii T, Yamada Y, Qi Z, Breyer MD. Effect of selective cyclooxygenase-2 (COX-2) inhibitor treatment on glucose-stimulated insulin secretion in C57BL/6 mice. Biochem Biophys Res Commun. 2007;363(1):37–43. doi:10.1016/j.bbrc.2007.08.090. - DOI - PMC - PubMed
    1. Kimple ME, Keller MP, Rabaglia MR, Pasker RL, Neuman JC, Truchan NA, Brar HK, Attie AD. Prostaglandin E2 receptor, EP3, is induced in diabetic islets and negatively regulates glucose- and hormone-stimulated insulin secretion. Diabetes. 2013;62(6):1904–1912. doi:10.2337/db12-0769. - DOI - PMC - PubMed
    1. Parazzoli S, Harmon JS, Vallerie SN, Zhang T, Zhou H, Robertson RP. Cyclooxygenase-2, not microsomal prostaglandin E Synthase-1, is the mechanism for interleukin-1β-induced prostaglandin E2 production and inhibition of insulin secretion in pancreatic islets*. Journal Of Biological Chemistryquery. 2012;287(38):32246–32253. doi:10.1074/jbc.M112.364612. - DOI - PMC - PubMed
    1. Tran PO, Gleason CE, Poitout V, Robertson RP. Prostaglandin E(2) mediates inhibition of insulin secretion by interleukin-1beta. J Biol Chem. 1999;274(44):31245–31248. doi:10.1074/jbc.274.44.31245. - DOI - PubMed

Publication types