. 2023 Jun 20:14:1157146.
doi: 10.3389/fmicb.2023.1157146. eCollection 2023.

Endoplasmic stress sensor Ire1 is involved in cytosolic/nuclear protein quality control in Pichia pastoris cells independent of HAC1

Affiliations

Endoplasmic stress sensor Ire1 is involved in cytosolic/nuclear protein quality control in Pichia pastoris cells independent of HAC1

Yasmin Nabilah Binti Mohd Fauzee et al. Front Microbiol. .

Abstract

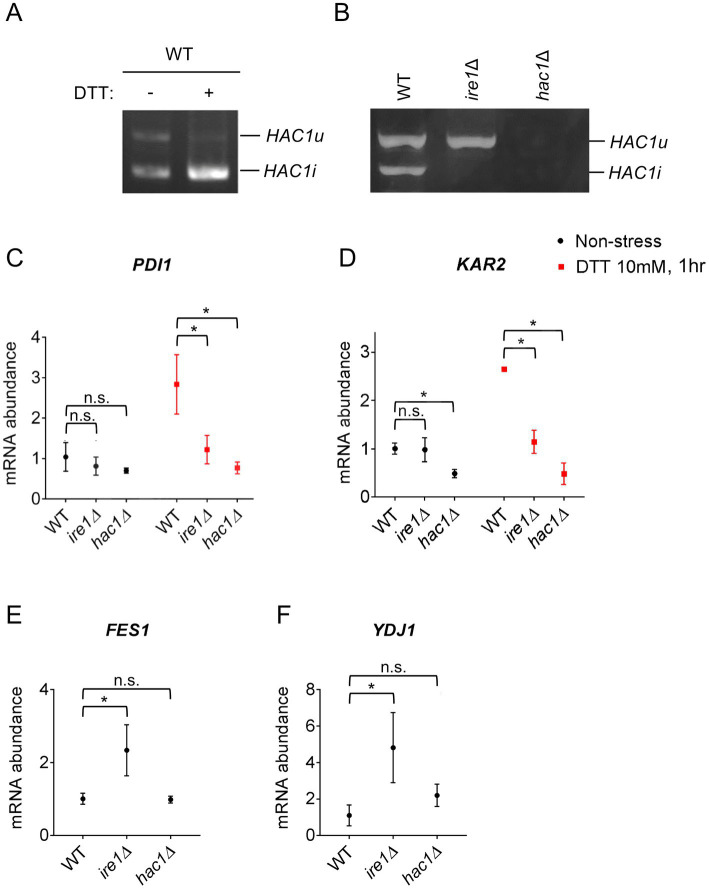
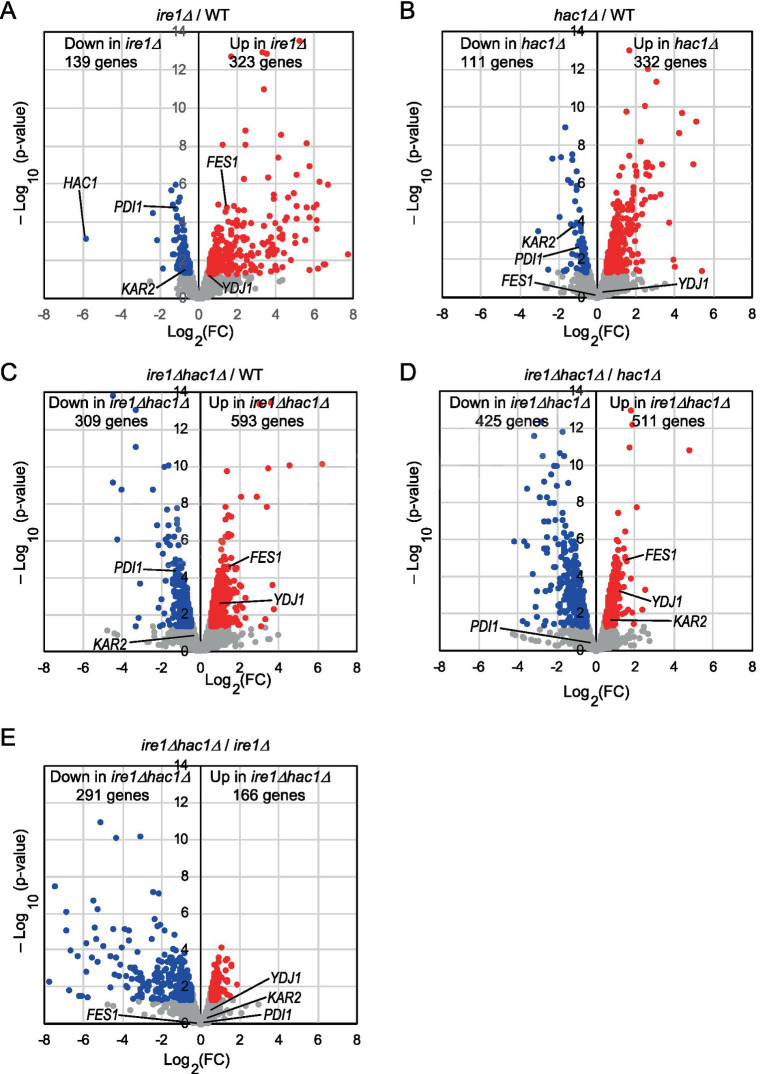
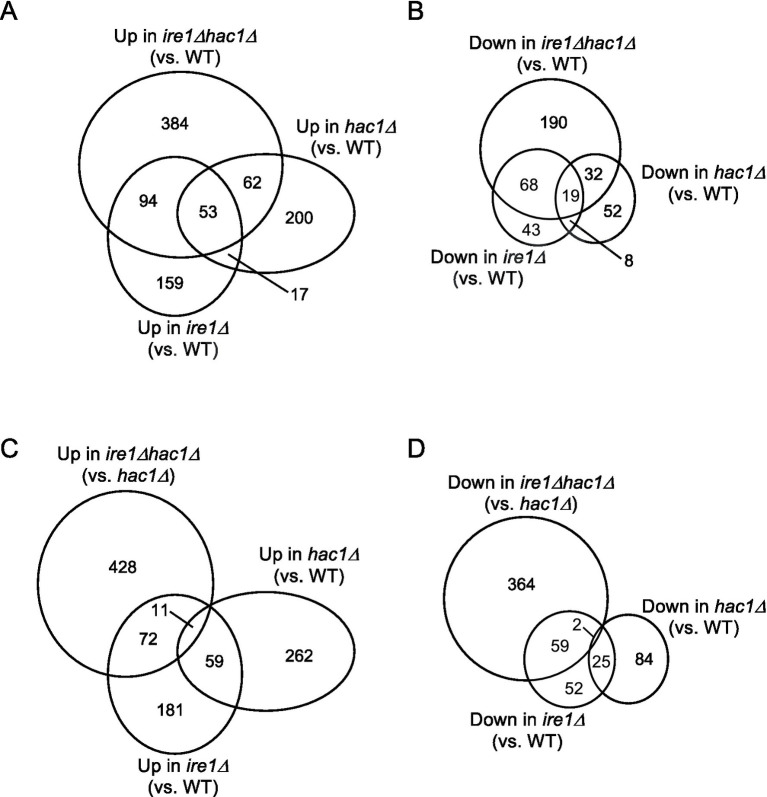
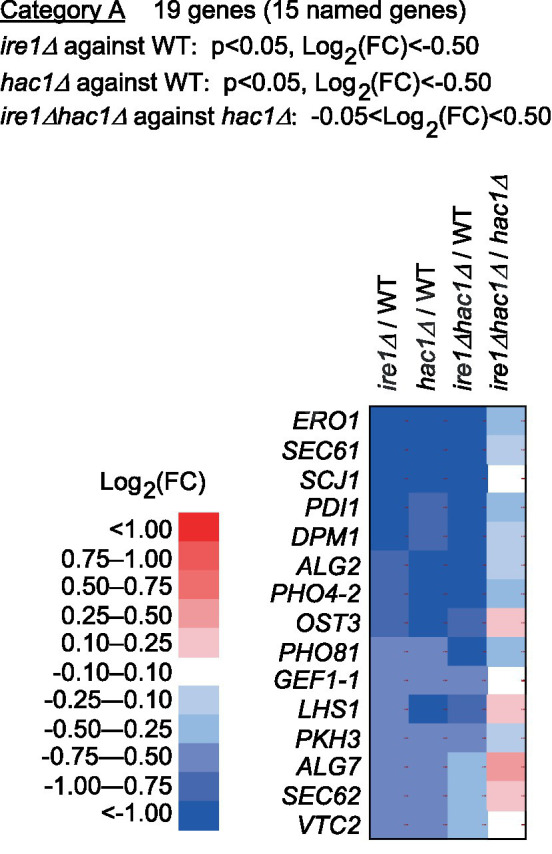
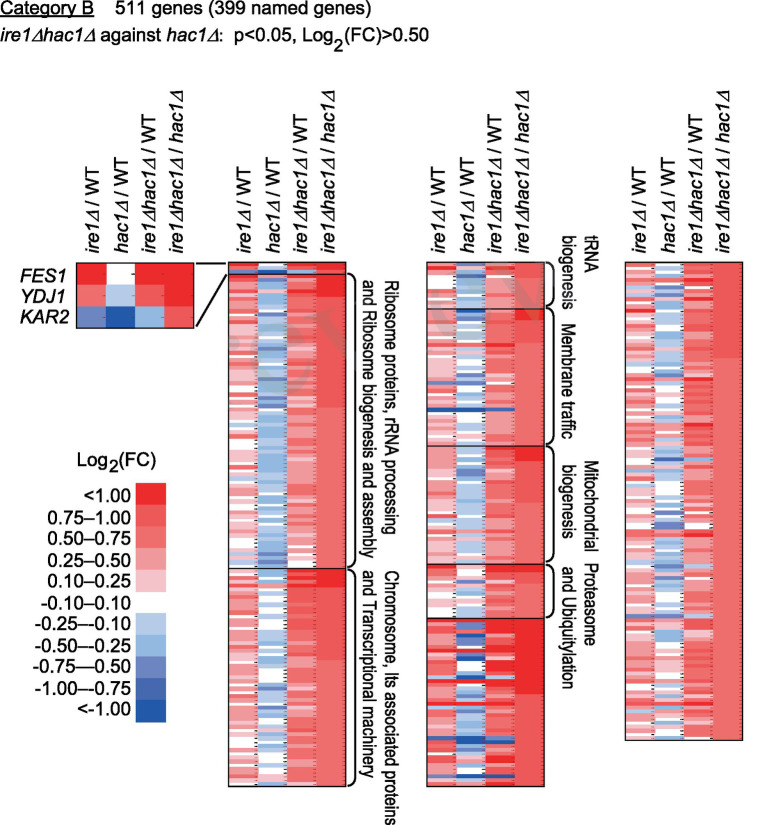
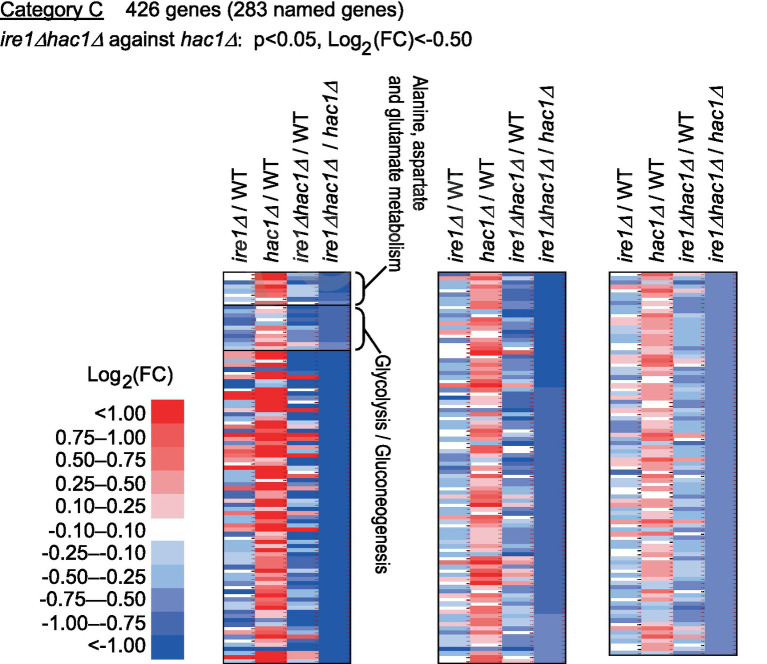
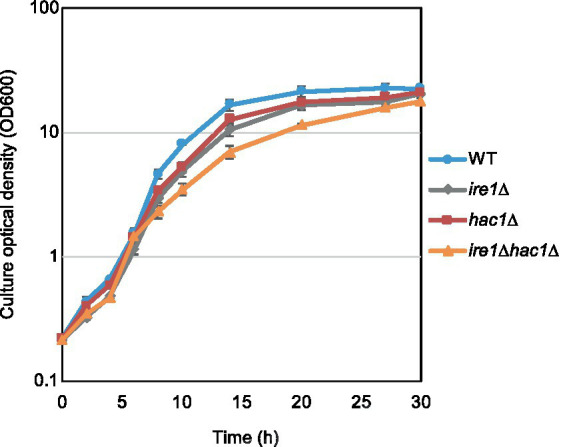
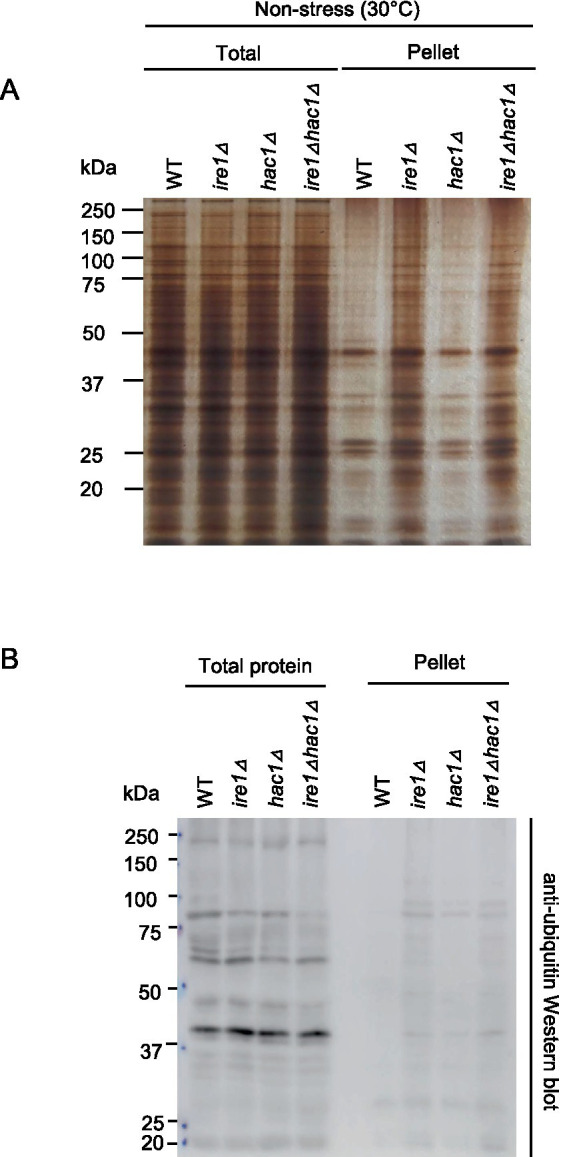
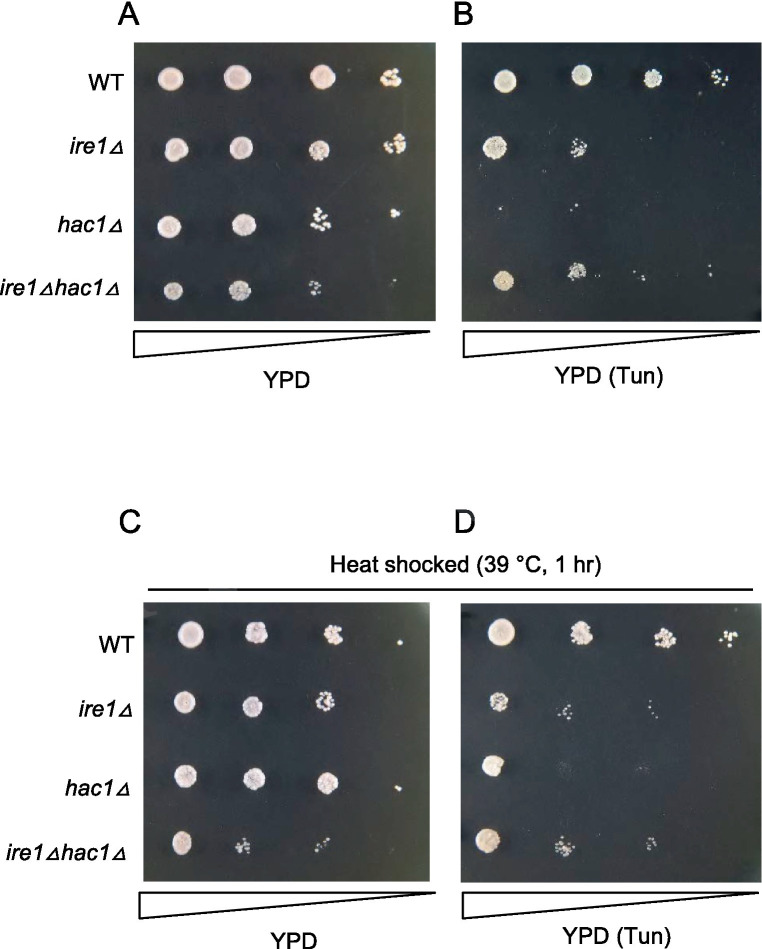
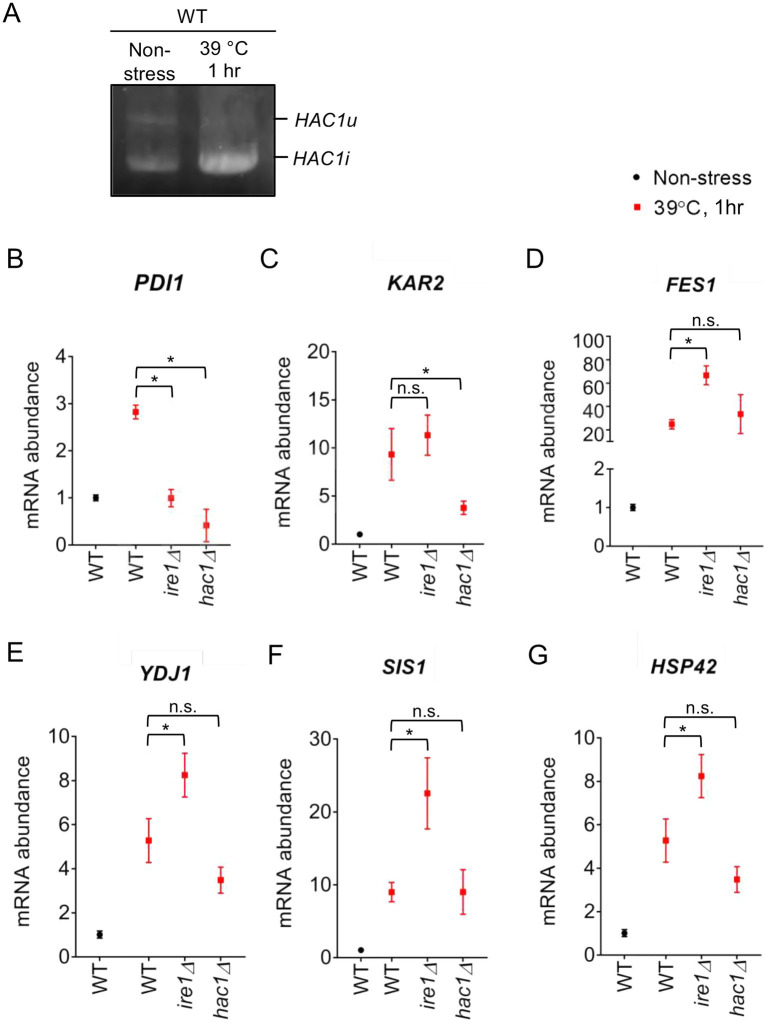
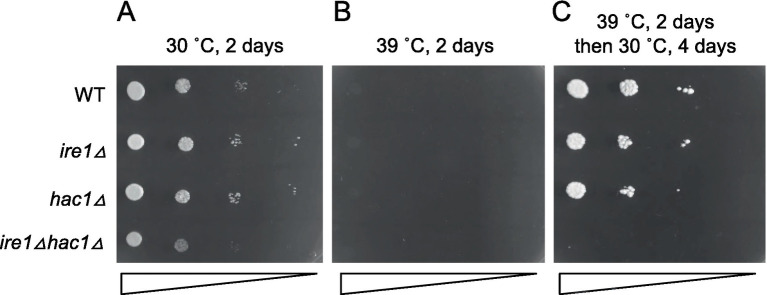
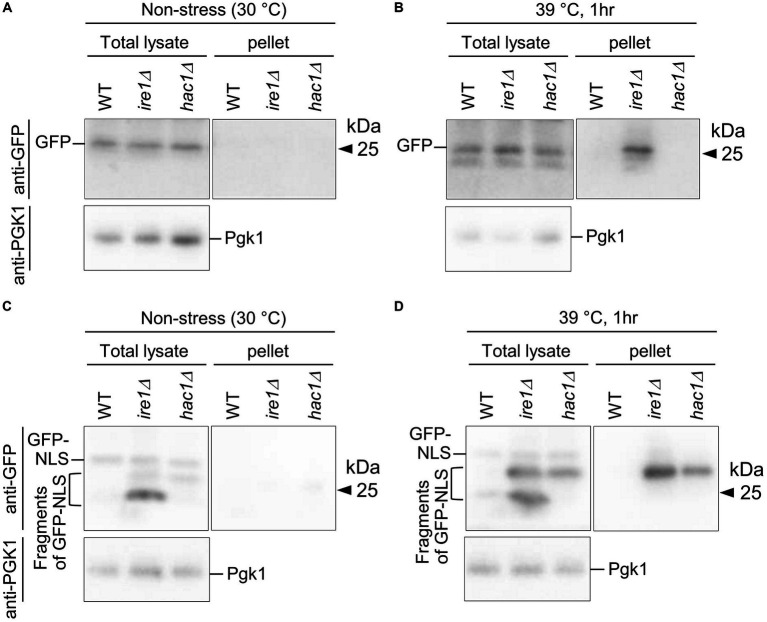
In eukaryotic species, dysfunction of the endoplasmic reticulum (ER), namely, ER stress, provokes a cytoprotective transcription program called the unfolded protein response (UPR). The UPR is triggered by transmembrane ER-stress sensors, including Ire1, which acts as an endoribonuclease to splice and mature the mRNA encoding the transcription factor Hac1 in many fungal species. Through analyses of the methylotrophic yeast Pichia pastoris (syn. Komagataella phaffii), we revealed a previously unknown function of Ire1. In P. pastoris cells, the IRE1 knockout mutation (ire1Δ) and HAC1 knockout mutation (hac1Δ) caused only partially overlapping gene expression changes. Protein aggregation and the heat shock response (HSR) were induced in ire1Δ cells but not in hac1Δ cells even under non-stress conditions. Moreover, Ire1 was further activated upon high-temperature culturing and conferred heat stress resistance to P. pastoris cells. Our findings cumulatively demonstrate an intriguing case in which the UPR machinery controls cytosolic protein folding status and the HSR, which is known to be activated upon the accumulation of unfolded proteins in the cytosol and/or nuclei.

Keywords: Pichia pastoris; endoplasmic reticulum; stress response; unfolded protein response; yeast.


Conflict of interest statement

The authors declare that the research was conducted in the absence of any commercial or financial relationships that could be construed as a potential conflict of interest.

Figures

Figure 1
Figure 1
HAC1 mRNA-splicing and UPR or HSR-marker gene-expression profiles in P. pastoris cells carrying the ire1Δ mutation or hac1Δ mutation. WT, ire1Δ (ire1Δ0), and hac1Δ (hac1::kanMX) versions of P. pastoris cells were cultured at 30°C under non-stress conditions or stressed with 10 mM DTT for 30 min. (A,B) Total RNA samples were subjected to RT-PCR to amplify HAC1 cDNA variants, which were then fractionated using agarose gel electrophoresis. (C–F) Total RNA samples were subjected to RT-qPCR analysis using PCR primer sets that were specific to the indicated genes. Values are presented as relative to that of non-stressed WT cells, which is set at 1.0. Dunnett’s test was performed using the data from WT cells as the control group. n.s.: not significant, *: significantly different (p < 0.05).
Figure 2
Figure 2
(A–E) Volcano plots displaying DEGs between two types of cells. WT, ire1Δ (ire1Δ0), hac1Δ (hac1Δ0), and ire1Δhac1Δ (ire1Δ0 hac1Δ0) versions of P. pastoris cells were cultured at 30°C under non-stress conditions, and their mRNA samples were subjected to RNA-seq analysis. See Supplementary Table S5 for the total data. In the volcano plots, the x-axis represents the Log2 of the fold change (FC), and the y-axis represents the negative decade logarithm of the value of p. DEGs (p < 0.05; Log2(FC) < −0.5 or > 0.5) are colored. We did not set the cut-off value for Log2(FC) greater than 0.5 because Ire1 was only moderately activated under our experimental conditions.
Figure 3
Figure 3
(A–D) Venn diagram presentation for DEGs between two types of cells. DEGs (p < 0.05; Log2(FC) < −0.5 or > 0.5) were extracted from the mRNA-seq data shown in Supplementary Table S5 and are presented as Venn diagrams.
Figure 4
Figure 4
Genes cooperatively induced by IRE1 and HAC1. The mRNA-seq data shown in Supplementary Table S5 were screened using the indicated criteria to extract the DEGs belonging to Category A. The heat map presents the expression profiles of the named genes in Category A, which are listed in Supplementary Table S6.
Figure 5
Figure 5
Genes suppressed by IRE1 independently of HAC1. The mRNA-seq data shown in Supplementary Table S5 were screened using the indicated criteria to extract the DEGs belonging to Category B. The heat map presents the expression profiles of the named genes in Category B, which are listed in Supplementary Table S6.
Figure 6
Figure 6
Genes induced by IRE1 independently of HAC1. The mRNA-seq data shown in Supplementary Table S5 were screened using the indicated criteria to extract DEGs belonging to Category C. The heat map presents the expression profiles of the named genes in Category C, which are listed in Supplementary Table S6.
Figure 7
Figure 7
Growth profile of P. pastoris cells carrying the ire1Δ mutation and/or the hac1Δ mutation. After setting the initial OD600 values to approximately 0.3, the WT, ire1Δ (ire1Δ0), hac1Δ (hac1Δ0), and ire1Δhac1Δ (ire1Δ0 hac1Δ0) versions of P. pastoris cells were incubated at 30°C under non-stress conditions, and the optical density of the cultures was monitored.
Figure 8
Figure 8
Induction of protein aggregation by the ire1Δ mutation. After culturing at 30°C under non-stress conditions, the WT, ire1Δ (ire1Δ0), hac1Δ (hac1Δ0), and ire1Δhac1Δ (ire1Δ0 hac1Δ0) versions of P. pastoris cells were harvested and lysed. The crude lysates (Total) were subjected to high-speed centrifugation, and pellet fractions (Pellet) were obtained. (A) Protein samples (Total: crude lysates corresponding to 6 μg protein; Pellet: preparation from crude lysates corresponding to 16 μg protein) were separated by SDS-PAGE and visualized by silver staining. (B) Protein samples (Total: crude lysates corresponding to 6 μg protein; Pellet: preparation from crude lysates corresponding to 16 μg protein) were subjected to SDS-PAGE, which was followed by anti-ubiquitin Western blotting.
Figure 9
Figure 9
Tunicamycin sensitivity of P. pastoris cells carrying the ire1Δ mutation and/or the hac1Δ mutation. Cultures (OD600 = 1.0) of the WT, ire1Δ (ire1Δ0), hac1Δ (hac1Δ0), and ire1Δhac1Δ (ire1Δ0 hac1Δ0) versions of P. pastoris cells were 10-fold serially diluted and spotted onto YPD agar plates, which were incubated at 30°C for 2 days before being photographed. In panel (A), cell were unstressed. In panels (B,D), agar plates contained 4.0 μg/mL tunicamycin (Tun). In panels (C,D), cultures were incubated at 39°C for 1 h before spotting.
Figure 10
Figure 10
Heat shock-induced alteration of HAC1 mRNA-splicing and gene-expression profiles of P. pastoris cells. (A) WT P. pastoris cells were cultured at 30°C under non-stress condition or shifted to 39°C for 1 h. RNA samples were subjected to RT-PCR to amplify the HAC1 cDNA variants, which were then fractionated by agarose gel electrophoresis. (B–G) After culture at 30°C under non-stress conditions, WT, ire1Δ (ire1Δ0), hac1Δ (hac1Δ0), and ire1Δhac1Δ (ire1Δ0 hac1Δ0) versions of P. pastoris cells were shifted to 39°C for 1 h. Total RNA samples were subjected to RT-qPCR analysis using PCR primer sets that were specific to the indicated genes. Values are presented as relative to that of WT cells cultured at 30°C, which is set at 1.0. Dunnett’s test was performed using the data from WT cells as the control group. n.s.: not significant, *: significantly different (p < 0.05).
Figure 11
Figure 11
High-temperature sensitivity of P. pastoris cells carrying the ire1Δ and/or hac1Δ mutations. Cultures (OD600 = 1.0) of the WT, ire1Δ (ire1Δ0), hac1Δ (hac1Δ0), and ire1Δhac1Δ (ire1Δ0 hac1Δ0) versions of P. pastoris cells were 10-fold serially diluted and spotted onto YPD agar plates. (A) Agar plate was incubated at 30°C for 2 days and photographed. (B) Agar plate was incubated at 39°C for 2 days and photographed. (C) After incubation at 39°C for 2 days, the agar plate was incubated at 30°C for 4 days and photographed.
Figure 12
Figure 12
Aggregation and truncation of GFP and GFP-NLS in P. pastoris cells carrying the ire1Δ mutation or hac1Δ mutation. After culturing at 30°C under non-stress conditions (A,C) or shifting to 39°C for 1 h (B,D), the WT, ire1 (ire1Δ0), and hac1Δ (hac1Δ0) versions of P. pastoris cells expressing GFP (A,B) or GFP-NLS (C,D) were harvested and lysed. The crude lysates (Total) were subjected to high-speed centrifugation, and pellet fractions (Pellet) were obtained. Protein samples (Total: crude lysates corresponding to 6 μg protein; Pellet: preparation from crude lysates corresponding to 16 μg protein) were subjected to SDS-PAGE, which was followed by anti-GFP Western blotting. Two anti-GFP blot panels in each of (A–D) are from the same membrane image. Anti-Pgk1 Western blots are used as loading control.

Similar articles

Cited by

References

    1. Ata Ö., Ergün B. G., Fickers P., Heistinger L., Mattanovich D., Rebnegger C., et al. . (2021). What makes Komagataella phaffii non-conventional? FEMS Yeast Res. 21:foab059. doi: 10.1093/femsyr/foab059, PMID: - DOI - PMC - PubMed
    1. Braakman I., Hebert D. N. (2013). Protein folding in the endoplasmic reticulum. Cold Spring Harb. Perspect. Biol. 5:a013201. doi: 10.1101/cshperspect.a013201 - DOI - PMC - PubMed
    1. Caplan A. J., Douglas M. G. (1991). Characterization of YDJ1: a yeast homologue of the bacterial dnaJ protein. J. Cell Biol. 114, 609–621. doi: 10.1083/jcb.114.4.609, PMID: - DOI - PMC - PubMed
    1. Chen S., Qiu G. (2020). Heat-stress induced expression of stress-inducible nucleotide exchange factor Fes1 in seagrass Zostera japonica. Ecotoxicology 29, 932–940. doi: 10.1007/s10646-020-02185-5 - DOI - PubMed
    1. Coelho D. S., Domingos P. M. (2014). Physiological roles of regulated Ire1 dependent decay. Front. Genet. 5:76. doi: 10.3389/fgene.2014.00076 - DOI - PMC - PubMed