. 2023 Jun 14;127(25):12206-12217.
doi: 10.1021/acs.jpcc.3c01152. eCollection 2023 Jun 29.

Quantifying Charge Carrier Localization in PBTTT Using Thermoelectric and Spectroscopic Techniques

Affiliations

Quantifying Charge Carrier Localization in PBTTT Using Thermoelectric and Spectroscopic Techniques

Shawn A Gregory et al. J Phys Chem C Nanomater Interfaces. .

Abstract

Chemically doped poly[2,5-bis(3-alkylthiophen-2-yl)thieno[3,2-b]thiophene] (PBTTT) shows promise for many organic electronic applications, but rationalizing its charge transport properties is challenging because conjugated polymers are inhomogeneous, with convoluted optical and solid-state transport properties. Herein, we use the semilocalized transport (SLoT) model to quantify how the charge transport properties of PBTTT change as a function of iron(III) chloride (FeCl3) doping level. We use the SLoT model to calculate fundamental transport parameters, including the carrier density needed for metal-like electrical conductivities and the position of the Fermi energy level with respect to the transport edge. We then contextualize these parameters with other polymer-dopant systems and previous PBTTT reports. Additionally, we use grazing incidence wide-angle X-ray scattering and spectroscopic ellipsometry techniques to better characterize inhomogeneity in PBTTT. Our analyses indicate that PBTTT obtains high electrical conductivities due to its quickly rising reduced Fermi energy level, and this rise is afforded by its locally high carrier densities in highly ordered microdomains. Ultimately, this report sets a benchmark for comparing transport properties across polymer-dopant-processing systems.


Conflict of interest statement

The authors declare no competing financial interest.

Figures

Figure 1
Figure 1
Visual summarizing the key facets of this study. (a) Neutral PBTTT-C12 (purple) is sequentially doped with FeCl3 at various concentrations to control the extent of oxidation and resulting thermoelectric properties. Oxidatively doped PBTTT (blue) contains polaronic charge carriers (likely a combination of polarons and bipolarons) and distinctly different electronic and optical properties (see the inset for a digital photograph of neutral PBTTT with a doped circular region). (b) SLoT model is used to contextualize the thermoelectric properties of PBTTT at various doping levels. At low FeCl3 concentrations and low extents of oxidation, PBTTT is lightly doped, the density of states, g(E), is lightly filled with mobile charge carriers and has a low reduced Fermi energy level, η, and the charge carriers are spatially localized with high hopping activation energies, WH (see leftmost figures in red). In contrast, at high FeCl3 concentrations and high extents of oxidation, PBTTT is heavily doped, the density of states is heavily filled with mobile charge carriers and has a high reduced Fermi energy level, and the charge carriers can be thought as spatially delocalized with little-to-no hopping activation energies. (c) Cartoon illustrating different measurement techniques and their interaction area and conditions. Thermoelectric measurements, represented by gold square contact pads and dashed gold percolated transport pathway, are indicative of the appropriately weighted bulk ensemble average charge transport in all inhomogeneous microdomains along a closed circuit and percolated pathway. In contrast, scattering and spectroscopic measurements can glean insight into microstructure and transport properties in specific microscopic domains that do not require a closed circuit and percolated pathway but may require other physical conditions to be met (e.g., periodic ordering for Bragg diffraction).
Figure 2
Figure 2
Quantifying nominal thermoelectric properties, optical properties, and extent of doping for PBTTT-C12 doped with FeCl3. (a) Electrical conductivity and Seebeck coefficient as a function of FeCl3 solution concentration. Error bars represent the sample-to-sample standard deviation. (b) UV–vis–NIR attenuation coefficient as a function of photon energy. (c) Pristine PBTTT-C12 XPS measurement and deconvolution. (d) 50 mM FeCl3 doped PBTTT-C12 XPS measurement and deconvolution. The low χ2 values, Abbe criterion, and residual signal (see Figure S6) provide a high level of confidence in these deconvolutions.
Figure 3
Figure 3
SLoT modeling of PBTTT-C12 sequentially doped with FeCl3. (a) SLoT model transport function prefactor and reduced Fermi energy as a function of carrier ratio and density. The inset illustrates the interpretation of increasing η values, akin to Figure 1. (b) Representative Arrhenius plots, where the slopes are equal to WH. Note that in this narrow temperature range (288–303 K), the electrical conductivity (and ergo σE0) oftentimes has a statistically significant temperature dependence while the Seebeck coefficient does not (ergo η does not observably vary). (c) Localization energy as a function of carrier ratio. The inset illustrates that localization decreases as carriers begin to spatially impinge, akin to Figure 1. Note that the carrier densities reported herein assume the carriers have a +1e and do not transport as a pair (i.e., bipolaron); if all charges were bipolaronic in nature, then the n values in (a, c) would be halved of what is presently shown. (d) S(σ) curve showing doping level average properties (colored squares, error bars represent sample to sample standard deviation), individual film properties (black squares), delocalized transport model (gray dashed line) and the SLoT model fit with no freely adjustable variables (black line). See Note S3 and PBTTT-SLoT.xlsx for additional details.
Figure 4
Figure 4
PBTTT-FeCl3 GIWAXS measurements and analysis. Representative diffractograms for (a) pristine, (b) 0.88 mM FeCl3 doped, (c) 2.5 mM FeCl3 doped, and (d) 50 mM doped PBTTT films. Pristine diffractogram shows annotated indices. (e) Radially integrated linecuts. (f) Lamellar (100) and π – π q values. (g) Coherence length and paracrystallinity. Note that in (f) and (g), the top and bottom x-axes are the same for both plots and that the arrows correspond to the y-axis for each data series. Explicitly, the triangle data points correspond to the left y-axes while the circles correspond to the right y-axes.
Figure 5
Figure 5
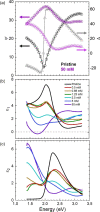
PBTTT-FeCl3 spectroscopic ellipsometry measurements, B-spline fits, and complex dielectric function calculations. (a) Representative ψ and Δ measurements for pristine and 50 mM FeCl3-doped PBTTT films with comparable thickness (∼180 nm) on glass substrates. One out of every five measured data points are shown for clarity, and lines represent the B-spline fitting, calculated using known substrate properties, known film thickness, and assumed Kramers–Kronig consistency. (b) Real component (ϵ1) of the complex dielectric function. (c) Imaginary component (ϵ2) of the complex dielectric function.
Figure 6
Figure 6
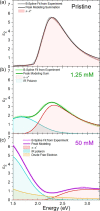
Representative SE deconvolutions as a function for PBTTT-FeCl3 doping level. (a) Pristine PBTTT, modeled using only a Cody-Lorenz oscillator for the π – π* band gap transition. (b) PBTTT doped with 1.25 mM FeCl3, modeled using a compared π – π* band gap transition and a Gaussian polaronic absorption. (c) PBTTT doped with 50 mM FeCl3, modeled using a comparable −π* optical transition and polaronic absorption as well as a Drude free electron contribution. Additional deconvolution notes and methodologies are found in Note S5.

Similar articles

Cited by

References

    1. Reynolds J. R.; Thompson B. C.; Skotheim T. A.. Handbook of Conducting Polymers; Marcel Dekker, 1998.
    1. Kroon R.; Mengistie D. A.; Kiefer D.; Hynynen J.; Ryan J. D.; Yu L.; Müller C. Thermoelectric plastics: from design to synthesis, processing and structure-property relationships. Chem. Soc. Rev. 2016, 45, 6147–6164. 10.1039/C6CS00149A. - DOI - PMC - PubMed
    1. Bubnova O.; Crispin X. Towards polymer-based organic thermoelectric generators. Energy Environ. Sci. 2012, 5, 9345–9362. 10.1039/c2ee22777k. - DOI
    1. Russ B.; Glaudell A.; Urban J. J.; Chabinyc M. L.; Segalman R. A. Organic thermoelectric materials for energy harvesting and temperature control. Nat. Rev. Mater. 2016, 1, 16050.10.1038/natrevmats.2016.50. - DOI
    1. Sirringhaus H. 25th Anniversary Article: Organic Field-Effect Transistors: The Path Beyond Amorphous Silicon. Adv. Mater. 2014, 26, 1319–1335. 10.1002/adma.201304346. - DOI - PMC - PubMed