. 2023 Jun 15;26(7):107141.
doi: 10.1016/j.isci.2023.107141. eCollection 2023 Jul 21.

Endothelial tissue remodeling induced by intraluminal pressure enhances paracellular solute transport

Affiliations

Endothelial tissue remodeling induced by intraluminal pressure enhances paracellular solute transport

Jean Cacheux et al. iScience. .

Abstract

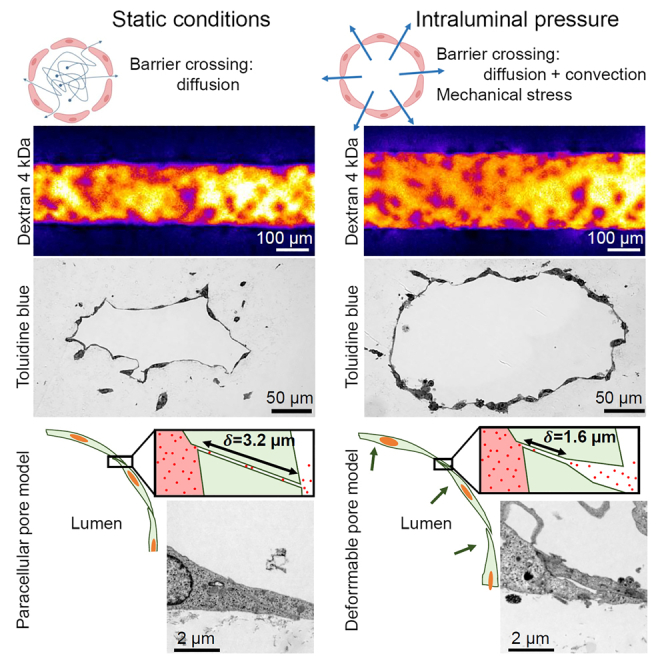
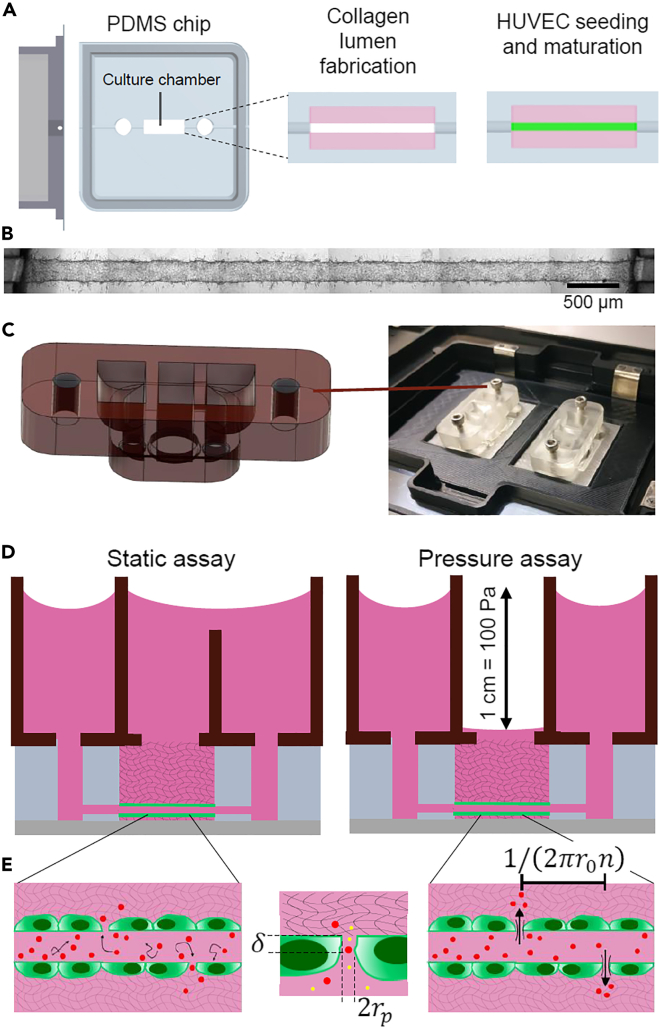
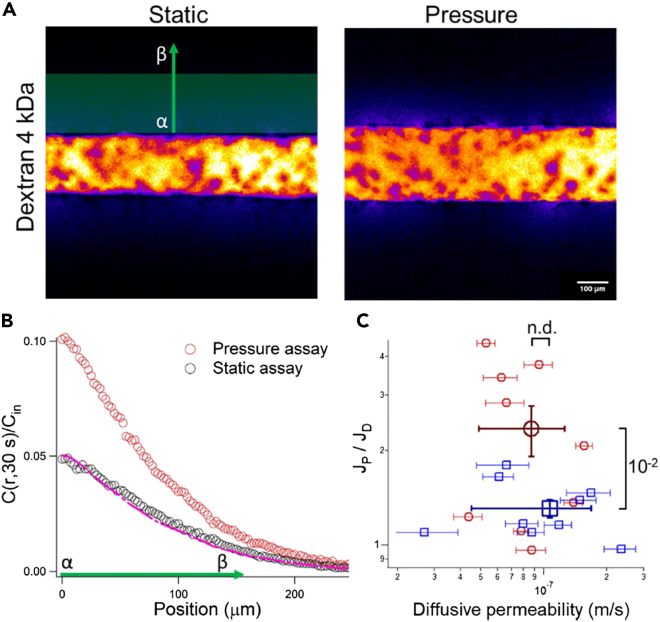
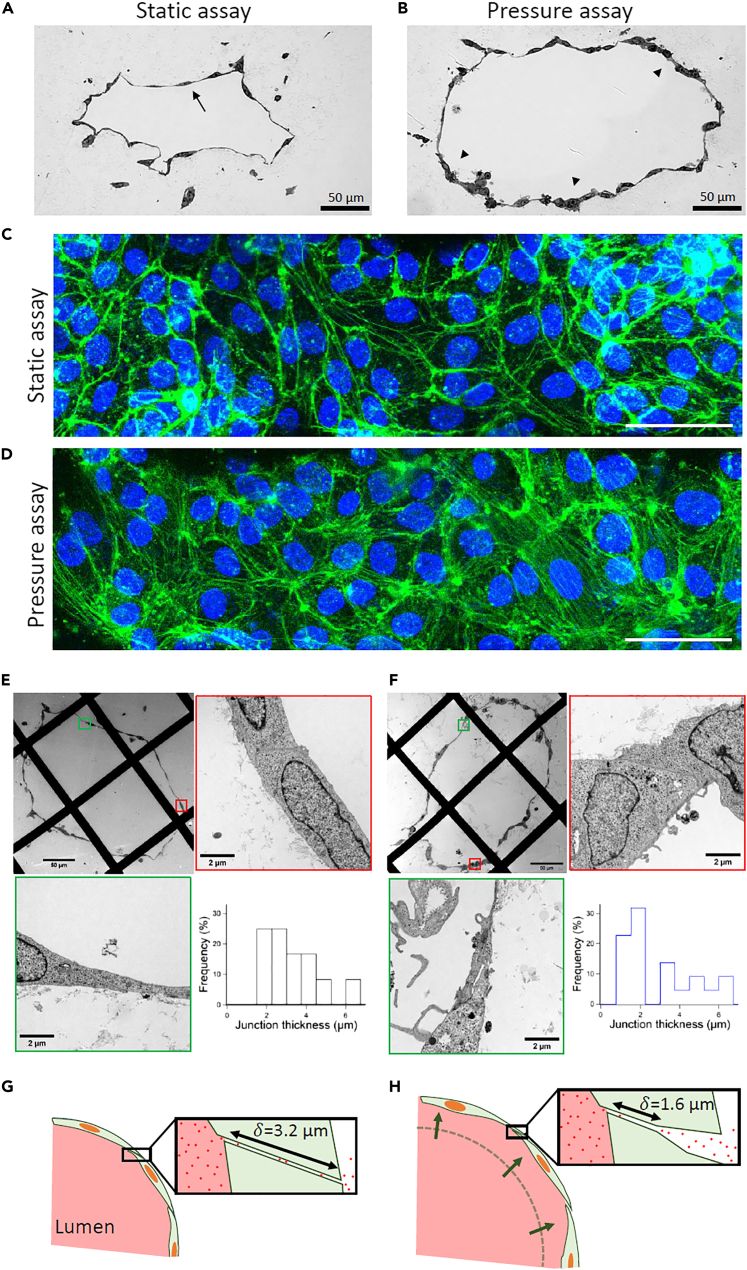
The endothelial layers of the microvasculature regulate the transport of solutes to the surrounding tissues. It remains unclear how this barrier function is affected by blood flow-induced intraluminal pressure. Using a 3D microvessel model, we compare the transport of macromolecules through endothelial tissues at mechanical rest or with intraluminal pressure, and correlate these data with electron microscopy of endothelial junctions. On application of an intraluminal pressure of 100 Pa, we demonstrate that the flow through the tissue increases by 2.35 times. This increase is associated with a 25% expansion of microvessel diameter, which leads to tissue remodeling and thinning of the paracellular junctions. We recapitulate these data with the deformable monopore model, in which the increase in paracellular transport is explained by the augmentation of the diffusion rate across thinned junctions under mechanical stress. We therefore suggest that the deformation of microvasculatures contributes to regulate their barrier function.

Keywords: Bioengineering; Biomechanics; Cell biology; Computer modeling; Tissue engineering.


Conflict of interest statement

The authors declare no competing interest.

Figures

None
Graphical abstract
Figure 1
Figure 1
MV fabrication and characterization by the static and pressure assays (A) Representation of the microvessel chip and the consecutive fabrication steps starting from Human Vascular Endothelial Cells (HUVEC). The chip is represented in gray, the collagen gel in pink, and the endothelial tissue in green. (B) Microscopic view of an MV after two days of culture. Note that we always detected some outgrowth of endothelial cells in the collagen gel after the maturation. The scale bar corresponds to 500 μm. (C) Layout of the 3D printed device for the static assay, and photograph of the device in operation on an inverted microscope. (D) Schematic representation of the devices to run the static and pressure assays. Intraluminal pressure is produced by 1 cm of hydrostatic pressure. (E) The left and right panels represent the transport of tracers through the barrier using diffusion or pressure as actuation scheme, respectively. The central panel shows the monopore model, as defined by the pore radius rp, density n, and thickness δ. We investigate the passage of two macromolecules with different sizes across paracellular junctions, as shown with red and yellow circles.
Figure 2
Figure 2
Validation of the static and pressure assays by finite element modeling (A) The snapshots represent the cross-section of the MV with the lumen shown in red, the cell layer in orange, and the collagen gel in blue. In the static assay, the tissue is modeled by its diffusive permeability LD, as indicated in the legend, and the simulations represent the concentration fields after a time lag of 200 s (the three heat maps are in units of mol/m3). We extract the basal and apical concentrations Cout and Cin, respectively, and the concentration profile C(r,t) along the dashed yellow arrow. The scale bar corresponds to 100 μm. (B) The plot reports the ratio of the measured to the simulated LD, as indicated in the color scale, as a function of time. (C) The plot presents the ratio of the measured V0/LD divided by this input parameter of the simulations as a function of the permeation velocity across the tissue V0. Data points are color-coded according to the value of the diffusive permeability, as indicated in the color scale.
Figure 3
Figure 3
MV characterized by the static assay (A) The two confocal time series represent fluorescence spatial redistribution for the 4 and 70 kDa dextran. The number of molecules Nout that crossed the barrier is measured at each time step in the collagen matrix (red rectangle). The intraluminal and basal concentrations Cin and Cout are inferred from the maximum and mean intensity in the green and yellow rectangles, respectively. The scale bar corresponds to 200 μm. (B) Maximum intensity projection of confocal micrographs of the junctions between the endothelial cells of MVs cultured in static conditions. Junctions are visualized by immunofluorescence detection of vascular endothelial cadherin (VE-Cad) and nuclei with Hoechst 33342. The scale bar corresponds to 50 μm. (C) The graph shows the temporal variation of Cin and Cout on the left axis for the 4 kDa dextran and Nout(t) on the right axis with the color code of panel A. (D) The plot presents the diffusive permeability for the 4 and 70 kDa dextran as a function of time. At each time point, we measure two times the diffusive permeability using each side of the MV. Dashed lines correspond to temporal averages. (E) Transmission electron micrograph of one endothelial cell junction. The blue and orange arrowheads indicate the apical and basal sides of the gap, respectively. The scale bar corresponds to 1 μm. (F) The plot shows the spatial variation of the signal along the red arrow in (E). Dashed lines are Gaussian fits to measure the size of the paracellular gap.
Figure 4
Figure 4
MV characterized by the pressure assay (A) Fluorescence confocal micrographs of the same MV recorded 30 s after the injection of dextran using the static and pressure assays. The scale bar corresponds to 100 μm. (B) The red and black datasets represent the concentration profile as obtained from the pressure and static assay, respectively. The profiles are recorded along the green axis in (A) between the marks α and β. The pink dashed line is response of the pressure assay after normalization of its maximum to that of the static assay. (C) Ratio of the flux across the MV barrier in the pressure to static assay as a function of the diffusive permeability LD for live and fixed samples (red and blue datasets, respectively). Data is expressed as average ±standard error. The averages values are marked with large symbols for both conditions, and unpaired Student’s t test is used for statistical analysis (shown with brackets).
Figure 5
Figure 5
Structure of MVs in the static and pressure assay The results of the static assay are shown in the panels (A, C, E), and those of the pressure assay in (B, D, F). (A and B) Optical micrographs of MV sections stained with toluidine blue. The arrow in (A) shows the lining of endothelial cells, and the arrowheads in (B) the clusters of endothelial cells. The scale bars correspond to 50 μm. (C and D) Maximum intensity projection of confocal micrographs obtained by staining MV with phalloidin for the detection of fibril actin in green and nuclear DNA in blue. The MV were fixed just after the static and pressure assays. The scale bars correspond to 50 μm. (E and F) Transmission electron micrographs of MVs at different levels of magnification. The red and green outlines correspond to the zooms of the squares in the low magnification image. The histograms show the distribution of paracellular junction thickness with 12 counts in (E) and 22 in (F). The scale bars correspond to 2 μm. (G and H) Representation of the deformable monopore model to account for the data from the static and pressure assays.

Similar articles

Cited by

References

    1. Mullin J.M., Agostino N., Rendonhuerta E., Thornton J.J. Keynote review: Epithelial and endothelial barriers in human disease. Drug Discov. Today. 2005;10:395–408. doi: 10.1016/S1359-6446(05)03379-9. - DOI - PubMed
    1. Bazzoni G., Dejana E. Endothelial Cell-to-Cell Junctions: Molecular Organization and Role in Vascular Homeostasis. Physiol. Rev. 2004;84:869–901. doi: 10.1152/physrev.00035.2003. - DOI - PubMed
    1. Gładysz M.Z., Stevanoska M., Włodarczyk-Biegun M.K., Nagelkerke A. Breaking through the barrier: Modelling and exploiting the physical microenvironment to enhance drug transport and efficacy. Adv. Drug Deliv. Rev. 2022;184:114183. doi: 10.1016/j.addr.2022.114183. - DOI - PubMed
    1. Komarova Y., Malik A.B. Regulation of Endothelial Permeability via Paracellular and Transcellular Transport Pathways. Annu. Rev. Physiol. 2010;72:463–493. doi: 10.1146/annurev-physiol-021909-135833. - DOI - PubMed
    1. Minshall R.D., Tiruppathi C., Vogel S.M., Malik A.B. Vesicle formation and trafficking in endothelial cells and regulation of endothelial barrier function. Histochem. Cell Biol. 2002;117:105–112. doi: 10.1007/s00418-001-0367-x. - DOI - PubMed

LinkOut - more resources