

Peripheral and central effects of NADPH oxidase inhibitor, mitoapocynin, in a rat model of diisopropylfluorophosphate (DFP) toxicity
- PMID: 37416507
- PMCID: PMC10320212
- DOI: 10.3389/fncel.2023.1195843
Peripheral and central effects of NADPH oxidase inhibitor, mitoapocynin, in a rat model of diisopropylfluorophosphate (DFP) toxicity
Abstract
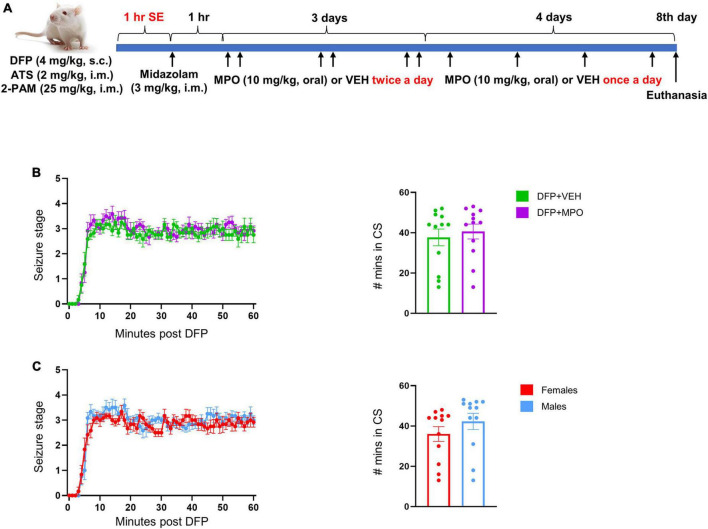
Organophosphates (OP) are highly toxic chemical nerve agents that have been used in chemical warfare. Currently, there are no effective medical countermeasures (MCMs) that mitigate the chronic effects of OP exposure. Oxidative stress is a key mechanism underlying OP-induced cell death and inflammation in the peripheral and central nervous systems and is not mitigated by the available MCMs. NADPH oxidase (NOX) is one of the leading producers of reactive oxygen species (ROS) following status epilepticus (SE). In this study, we tested the efficacy of the mitochondrial-targeted NOX inhibitor, mitoapocynin (MPO) (10 mg/kg, oral), in a rat diisopropylfluorophosphate (DFP) model of OP toxicity. In DFP-exposed animals, MPO decreased oxidative stress markers nitrite, ROS, and GSSG in the serum. Additionally, MPO significantly reduced proinflammatory cytokines IL-1β, IL-6, and TNF-α post-DFP exposure. There was a significant increase in GP91phox, a NOX2 subunit, in the brains of DFP-exposed animals 1-week post-challenge. However, MPO treatment did not affect NOX2 expression in the brain. Neurodegeneration (NeuN and FJB) and gliosis [microglia (IBA1 and CD68), and astroglia (GFAP and C3)] quantification revealed a significant increase in neurodegeneration and gliosis after DFP-exposure. A marginal reduction in microglial cells and C3 colocalization with GFAP in DFP + MPO was observed. The MPO dosing regimen used in this study at 10 mg/kg did not affect microglial CD68 expression, astroglial count, or neurodegeneration. MPO reduced DFP-induced oxidative stress and inflammation markers in the serum but only marginally mitigated the effects in the brain. Dose optimization studies are required to determine the effective dose of MPO to mitigate DFP-induced changes in the brain.
Keywords: GP91phox; diisopropylfluorophosphate (DFP); gliosis; oxidative stress; proinflammatory cytokines.
Copyright © 2023 Meyer, Rao, Vasanthi, Pereira, Gage, Putra, Holtkamp, Huss and Thippeswamy.
Conflict of interest statement
The authors declare that the research was conducted in the absence of any commercial or financial relationships that could be construed as a potential conflict of interest.
Figures


Similar articles
-
The NADPH Oxidase Inhibitor, Mitoapocynin, Mitigates DFP-Induced Reactive Astrogliosis in a Rat Model of Organophosphate Neurotoxicity.Antioxidants (Basel). 2023 Nov 30;12(12):2061. doi: 10.3390/antiox12122061. Antioxidants (Basel). 2023. PMID: 38136181 Free PMC article.
-
Diet-incorporated saracatinib, a Src tyrosine kinase inhibitor, counteracts diisopropylfluorophosphate (DFP)-induced chronic neurotoxicity in the rat model.Biomed Pharmacother. 2025 Aug;189:118234. doi: 10.1016/j.biopha.2025.118234. Epub 2025 Jun 12. Biomed Pharmacother. 2025. PMID: 40513390 Free PMC article.
-
Diapocynin, an NADPH oxidase inhibitor, counteracts diisopropylfluorophosphate-induced long-term neurotoxicity in the rat model.Ann N Y Acad Sci. 2020 Nov;1479(1):75-93. doi: 10.1111/nyas.14314. Epub 2020 Feb 10. Ann N Y Acad Sci. 2020. PMID: 32037612 Free PMC article.
-
Disease-modifying effects of a glial-targeted inducible nitric oxide synthase inhibitor (1400W) in mixed-sex cohorts of a rat soman (GD) model of epilepsy.J Neuroinflammation. 2023 Jul 12;20(1):163. doi: 10.1186/s12974-023-02847-1. J Neuroinflammation. 2023. PMID: 37438764 Free PMC article.
-
Persistent behavior deficits, neuroinflammation, and oxidative stress in a rat model of acute organophosphate intoxication.Neurobiol Dis. 2020 Jan;133:104431. doi: 10.1016/j.nbd.2019.03.019. Epub 2019 Mar 21. Neurobiol Dis. 2020. PMID: 30905768 Free PMC article. Review.
Cited by
-
Evidence Implicating Blood-Brain Barrier Impairment in the Pathogenesis of Acquired Epilepsy following Acute Organophosphate Intoxication.J Pharmacol Exp Ther. 2024 Jan 17;388(2):301-312. doi: 10.1124/jpet.123.001836. J Pharmacol Exp Ther. 2024. PMID: 37827702 Free PMC article. Review.
-
Copper supplementation alleviates hypoxia‑induced ferroptosis and oxidative stress in neuronal cells.Int J Mol Med. 2024 Dec;54(6):117. doi: 10.3892/ijmm.2024.5441. Epub 2024 Oct 18. Int J Mol Med. 2024. PMID: 39422051 Free PMC article.
-
Astragalus polysaccharides ameliorate epileptogenesis, cognitive impairment, and neuroinflammation in a pentylenetetrazole-induced kindling mouse model.Front Pharmacol. 2024 Feb 9;15:1336122. doi: 10.3389/fphar.2024.1336122. eCollection 2024. Front Pharmacol. 2024. PMID: 38405667 Free PMC article.
-
Off-target effects of the NADPH oxidase inhibitor mitoapocynin-encapsulated nanoparticles and free-drug oral treatment in a rat DFP model of neurotoxicity.J Drug Target. 2025 Jul 8:1-11. doi: 10.1080/1061186X.2025.2523995. Online ahead of print. J Drug Target. 2025. PMID: 40569814
-
The NADPH Oxidase Inhibitor, Mitoapocynin, Mitigates DFP-Induced Reactive Astrogliosis in a Rat Model of Organophosphate Neurotoxicity.Antioxidants (Basel). 2023 Nov 30;12(12):2061. doi: 10.3390/antiox12122061. Antioxidants (Basel). 2023. PMID: 38136181 Free PMC article.
References
Grants and funding
LinkOut - more resources
Full Text Sources
Research Materials
Miscellaneous