. 2023 Jun 14;19(10):3143-3158.
doi: 10.7150/ijbs.84613. eCollection 2023.

VDAC2 malonylation participates in sepsis-induced myocardial dysfunction via mitochondrial-related ferroptosis

Affiliations

VDAC2 malonylation participates in sepsis-induced myocardial dysfunction via mitochondrial-related ferroptosis

Han She et al. Int J Biol Sci. .

Abstract

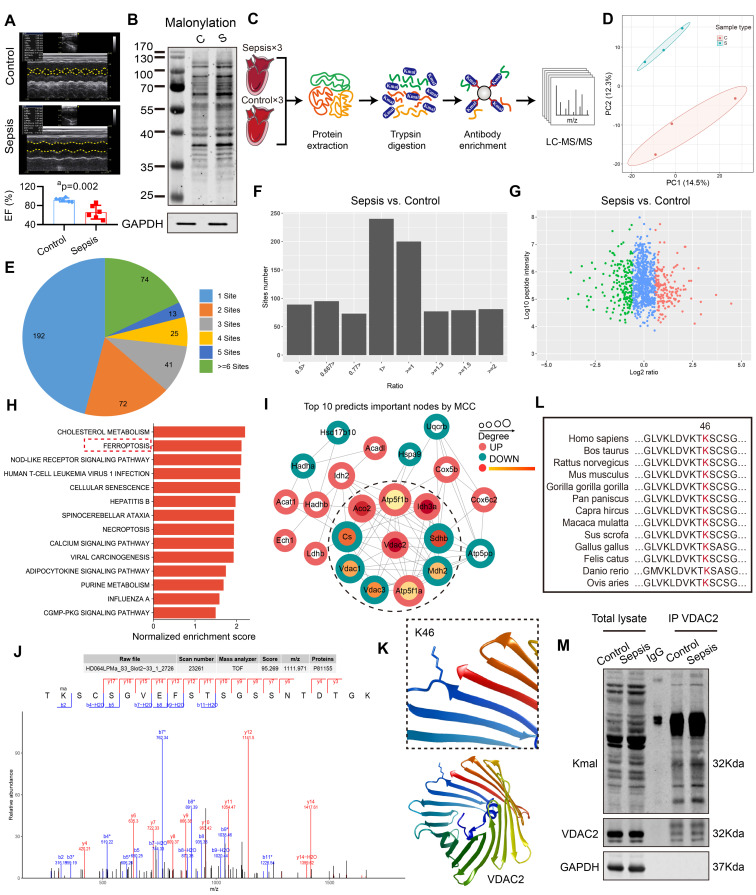
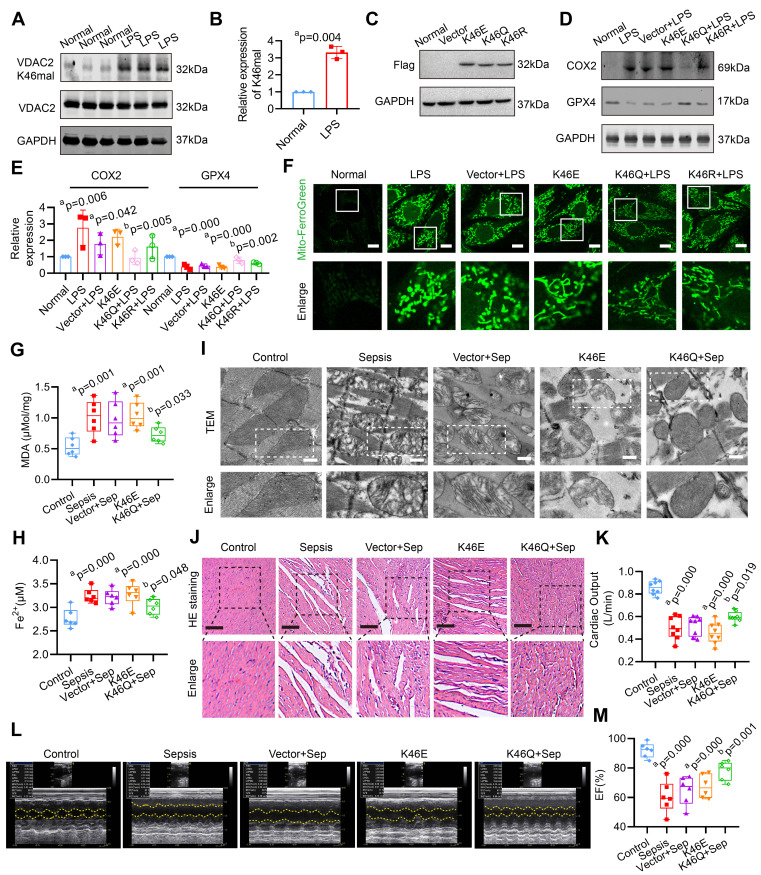
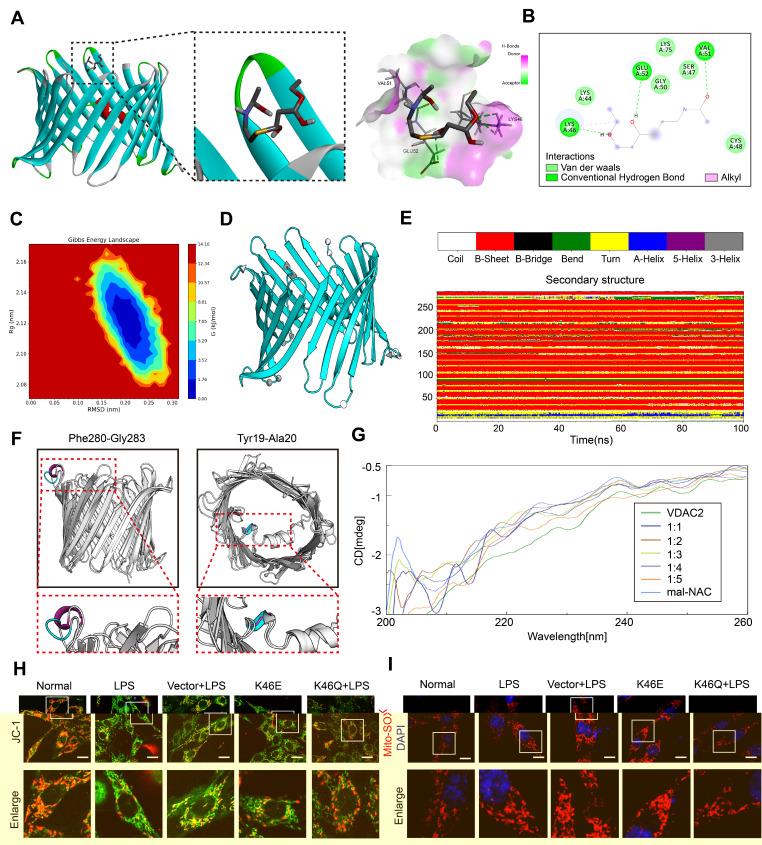
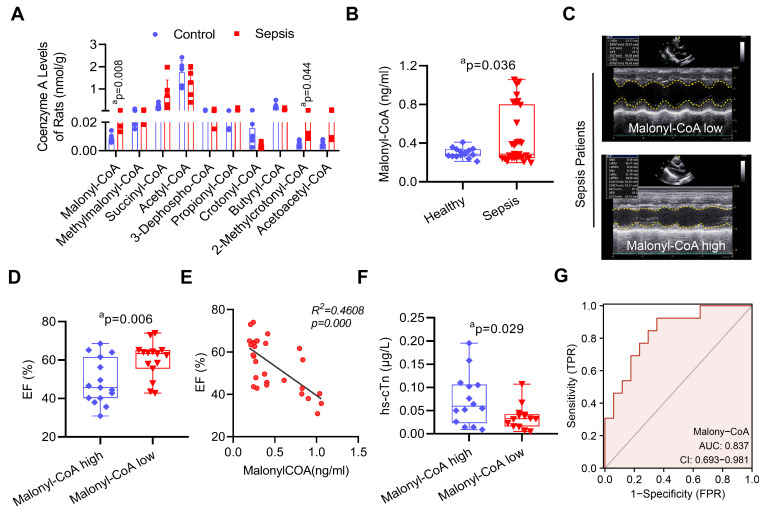
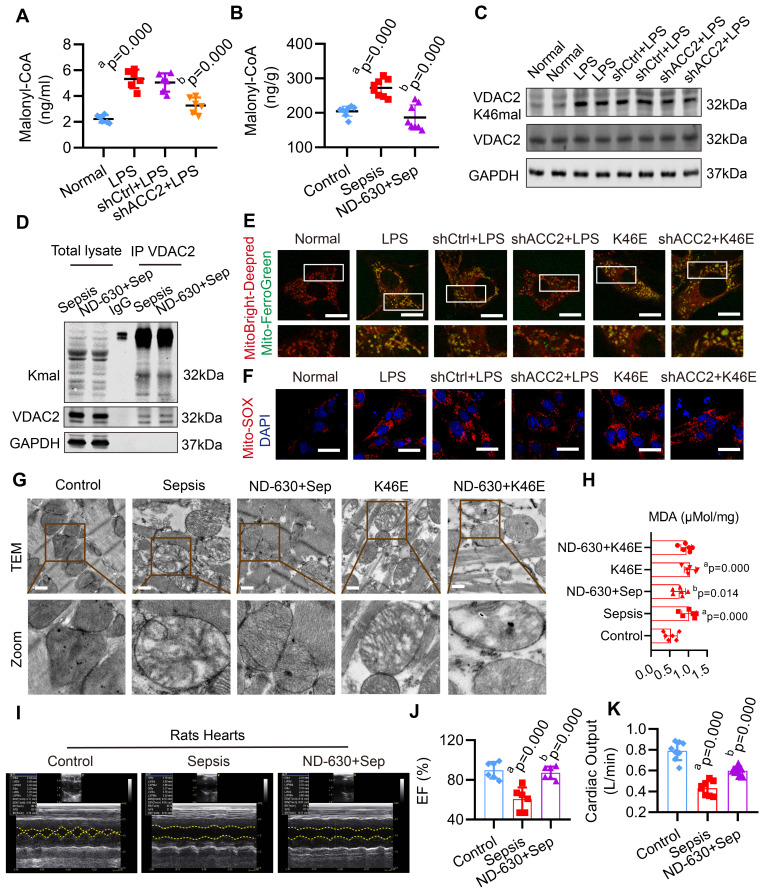
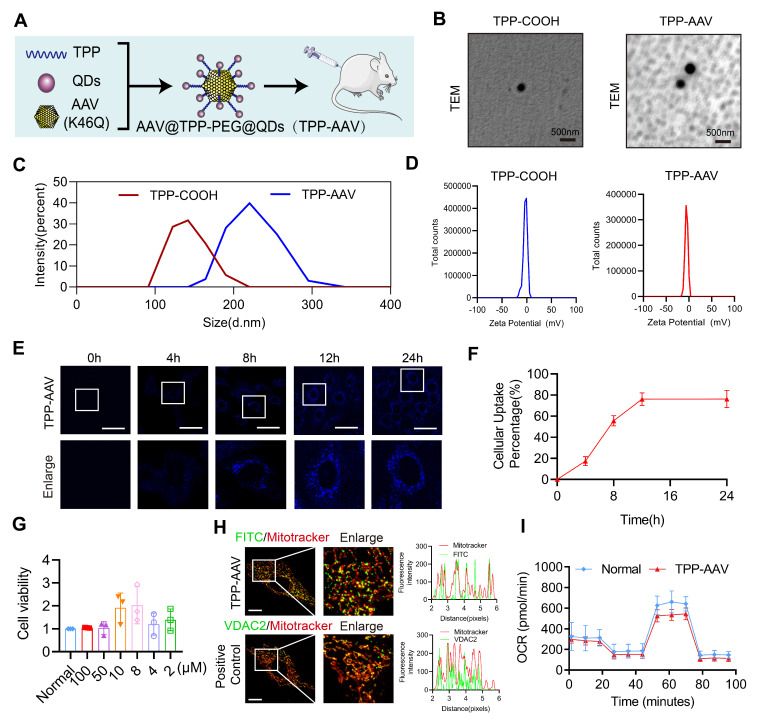
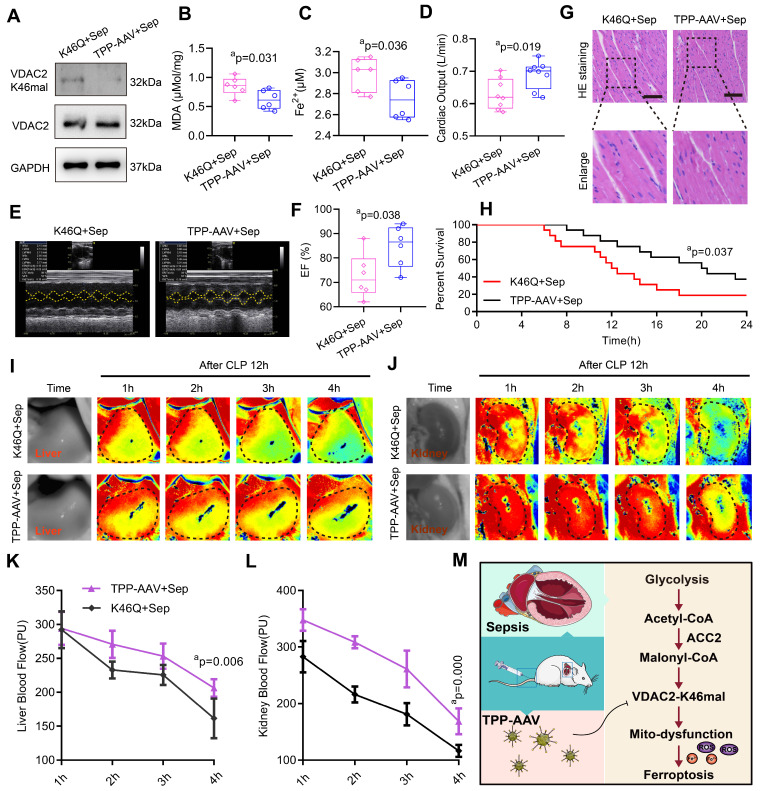
Sepsis-induced myocardial dysfunction (SIMD) is a prevalent and severe form of organ dysfunction with elusive underlying mechanisms and limited treatment options. In this study, the cecal ligation and puncture and lipopolysaccharide (LPS) were used to reproduce sepsis model in vitro and vivo. The level of voltage-dependent anion channel 2 (VDAC2) malonylation and myocardial malonyl-CoA were detected by mass spectrometry and LC-MS-based metabolomics. Role of VDAC2 malonylation on cardiomyocytes ferroptosis and treatment effect of mitochondrial targeting nano material TPP-AAV were observed. The results showed that VDAC2 lysine malonylation was significantly elevated after sepsis. In addition, the regulation of VDAC2 lysine 46 (K46) malonylation by K46E and K46Q mutation affected mitochondrial-related ferroptosis and myocardial injury. The molecular dynamic simulation and circular dichroism further demonstrated that VDAC2 malonylation altered the N-terminus structure of the VDAC2 channel, causing mitochondrial dysfunction, increasing mitochondrial ROS levels, and leading to ferroptosis. Malonyl-CoA was identified as the primary inducer of VDAC2 malonylation. Furthermore, the inhibition of malonyl-CoA using ND-630 or ACC2 knock-down significantly reduced the malonylation of VDAC2, decreased the occurrence of ferroptosis in cardiomyocytes, and alleviated SIMD. The study also found that the inhibition of VDAC2 malonylation by synthesizing mitochondria targeting nano material TPP-AAV could further alleviate ferroptosis and myocardial dysfunction following sepsis. In summary, our findings indicated that VDAC2 malonylation plays a crucial role in SIMD and that targeting VDAC2 malonylation could be a potential treatment strategy for SIMD.

Keywords: Ferroptosis; Malonyl-CoA; Malonylation; Sepsis; VDAC2.


Conflict of interest statement

Competing Interests: The authors have declared that no competing interest exists.

Figures

Figure 1
Figure 1
Enrichment and identification of heart lysine malonylome by Label-Free quantitation. (A) Cardiac EF of sepsis rats measured by echocardiography (n=6 per group). (B) Representative immunoblot of lysine malonylated (Kmal) proteins in control and sepsis groups. GAPDH was used as loading control (n=3 independent experiments). (C) Workflow of the strategy for the malonylome analysis. (D) Principal components analysis (PCA) score plot of control and sepsis groups. (E) Pie chart showing the distribution of the number of identified Kmal sites per protein. (F) Histogram showing the ratio distribution of quantifiable Kmal sites between control and sepsis groups. (G) Scatterplot showing the quantification of Kmal sites in relation to peptide intensities. (H) Pathways enriched by Kyoto Encyclopedia of Genes and Genomes (KEGG). (I) MCC analysis of malonylated proteins. The malonylated protein was represented by a concentric circle, with the outer ring color indicating the protein undergoes malonylation up or down, red indicating upregulation, and green indicating downregulation. The redder the inner ring color, the higher the importance of the protein, and the larger the shape, the more interacting proteins there are. (J) MS spectrum of the malonylated site Lys46. (K) Crystal structure of VDAC2. (L) VDAC2 K46 is evolutionarily conserved. The sequences of VDAC2 in thirteen species were aligned. Lysine 46 of VDAC2 was highlighted in red. (M) Representative western blots of immunoprecipitated (IP) endogenous malonylated proteins or VDAC2 and immunoblotted for the reciprocal proteins in control and sepsis groups. GAPDH was used as loading control (n=3 independent experiments). The results were analyzed by independent sample t-test. a: p<0.05 as compared with the control group.
Figure 2
Figure 2
Role of VDAC2 lysine 46 in the regulation of ferroptosis and myocardial injury. (A) Western blot analysis and (B) relative expression of VDAC2 K46 mal in the H9C2 cells after treatment with LPS (n=3 independent experiments). (C) Western blot analysis of Flag (K46E, K46Q and K46R) expression in the H9C2 cells (n=3 independent experiments). (D-E) Western blot analysis of GPX4 and COX2 expression in the H9C2 cells after mutating K46 of VDAC2 (n=3 independent experiments). (F) Representative images of Mito-FerroGreen (Bar=10μm) (n=3 independent experiments). (G) The levels of MDA in rat heart tissue treated with AAV(K46E) and AAV(K46Q) (n=6 each group). (H) The levels of Fe2+ in rat heart tissue treated with AAV(K46E) and AAV(K46Q) (n=6 each group). (I) Representative TEM images of mitochondria in cardiomyocytes of rat heart tissue (Bar=0.5μm) (n=6 each group). (J) HE staining of heart tissues of rats (Bar=20μm) (n=6 each group). (K) Cardiac output (CO) of rats (n=8 each group). (L) Representative echocardiograms images and (M) quantitative results of cardiac EF of rats (n=6 per group). The results were analyzed by independent sample t-test and one-way ANOVA. a: p<0.05 as compared with the normal or control group, b: p<0.05 as compared with the LPS or sepsis group.
Figure 3
Figure 3
Molecular dynamics simulation and circular dichroism spectrum of VDAC2. (A) Molecular docking of VDAC2 and malonyl-CoA. (B) Hydrogen bond forming between ligand with lys46 site. (C) Gibbs energy landscape. (D) Conformational change of VDAC2. (E-F) Changes of VDAC2 protein secondary structure over time, with blue representing the initial structure (0ns) and red representing the final structure (100ns). (G) Overlay graph of far ultraviolet. (H) Mitochondrial membrane potential detected by JC-1(Bar=20μm) (n=3 independent experiments) (I) Representative images of Mito-SOX (Bar=10μm) (n=3 independent experiments).
Figure 4
Figure 4
The role of malonyl-CoA in myocardial injury after sepsis. (A) Detection of myocardial acyl-coenzyme A level in rats using targeted metabolomics. Acyl-coenzyme A levels were compared between control and sepsis groups (n=6 each group). (B) Comparison of serum malonyl-CoA levels in healthy control and sepsis patients. (C) Representative echocardiogram images of sepsis patients. (D) LVEF of sepsis patients in the serum malonyl-CoA high and low groups. (E) Person's correlation analysis between LVEF and serum malonyl-CoA of sepsis patients. (F) hs-cTn levels in sepsis patients. (G) ROC curve for serum malonyl-CoA levels in sepsis patients. The results were analyzed by independent sample t-test. a: p<0.05 as compared with the control or malonyl-CoA high group.
Figure 5
Figure 5
Effect of malonyl-CoA on VDAC2 malonylation and ferroptosis in sepsis myocardial injury. The malonyl-CoA levels were measured in (A) H9C2 cells (n=3 independent experiments) and (B) heart tissues (n=8 each group) detected using ELISA. (C) Western blot analysis was performed to determine the expression of VDAC2 K46mal in H9C2 cells after transfection with Ad-Vector and Ad-shACC2 (n=3 independent experiments). (D) Representative western blots of immunoprecipitated (IP) endogenous malonylated proteins or VDAC2 and immunoblotted for the reciprocal proteins in sepsis and ND-630 groups (n=3 independent experiments). (E) Representative images of H9C2 cells after treatment with MitoBright-Deep Red and Mito-FerroGreen (Bar=5μm) (n=3 independent experiments). (F) Representative images of Mito-SOX in H9C2 cells (Bar=10μm) (n=3 independent experiments). (G) Representative TEM images of mitochondria in cardiomyocytes of rat heart tissue (Bar=0.5μm) (n=6 each group). (H) The level of MDA (n=6 independent experiments). (I) Echocardiograms images of rats (n=6 each group). (J) Summary of cardiac EF of rats measured by echocardiography. (K) Cardiac output (CO) of rats (n=8 each group). The results were analyzed by one-way ANOVA. a: p<0.05 as compared with the normal or control group, b: p<0.05 compared with sepsis or LPS group.
Figure 6
Figure 6
Characterization of nano material TPP-AAV. (A) Synthesis flow chat of TPP-AAV. (B) Representative TEM images of TPP-COOH and TPP-AAV (Bar=500μm). The (C) size and (D) zeta potential of TPP-COOH and TPP-AAV. (E) Representative confocal images of TPP-AAV at different times (Bar=50μm). (F) Relative cellular uptake percentage of TPP-AAV (n=3 independent experiments). (G) Effect of TPP-AAV on cell viability (n=3 independent experiments). (H) Representative image of TPP-AAV and positive control (VDAC2) mitochondrial colocalization (Bar=10μm) (n=3 independent experiments). (I) Mitochondrial respiration in H9C2 cells (n=3 independent experiments). The results were analyzed by independent sample t-test and one-way ANOVA.
Figure 7
Figure 7
Protective effects of nano material TPP-AAV on SIMD. (A) The expression of VDAC2 (K46) malonylation in cardiac tissues of sepsis rats after treatment with AAV(K46) or TPP-AAV (n=3 independent experiments). The level of cardiac (B) MDA and (C) Fe2+ after injection of TPP-AAV in sepsis rats (n=6 each group). (D) Cardiac output (CO) (n=8 each group). (E) Representative echocardiograms images and (F) quantitative results of cardiac EF of sepsis rats after being treated with AAV (K46Q) and TPP-AAV (n=6 each group). (G) HE staining of heart tissues after injection of TPP-AAV (Bar=25μm) (n=6 each group). (H) Survival rate of sepsis rats after treatment with TPP-AAV (n=16 each group). (I-L) Laser speckle technique was used to monitor time-lapse liver and kidney blood flow of rats (n=6 each group). (M) Schematic diagram of ferroptosis of cardiomyocytes in sepsis caused by VDAC2 malonylation and targeted treatment by TPP-AAV. The results were analyzed by independent sample t-test. Rat survival was assessed by Kaplan-Meier analysis. a: p<0.05 as compared with the K46Q group.

Similar articles

Cited by

References

    1. Singer M, Deutschman CS, Seymour CW, Shankar-Hari M, Annane D, Bauer M. et al. The Third International Consensus Definitions for Sepsis and Septic Shock (Sepsis-3) JAMA. 2016;315:801–10. - PMC - PubMed
    1. Rudd KE, Johnson SC, Agesa KM, Shackelford KA, Tsoi D, Kievlan DR. et al. Global, regional, and national sepsis incidence and mortality, 1990-2017: analysis for the Global Burden of Disease Study. Lancet. 2020;395:200–211. - PMC - PubMed
    1. Deng F, Hu JJ, Lin ZB, Sun QS, Min Y, Zhao BC. et al. Gut microbe-derived milnacipran enhances tolerance to gut ischemia/reperfusion injury. Cell Rep Med. 2023;4:100979. - PMC - PubMed
    1. Hollenberg SM, Singer M. Pathophysiology of sepsis- induced cardiomyopathy. Nat Rev Cardiol. 2021;18:424–434. - PubMed
    1. Deng F, Chen Y, Sun QS, Lin ZB, Min Y, Zhao BC. et al. Gut microbiota dysbiosis is associated with sepsis-induced cardiomyopathy in patients: A case-control study. J Med Virol. 2023;95:e28267. - PubMed