Metabolomics reveals the effects of hydroxysafflor yellow A on neurogenesis and axon regeneration after experimental traumatic brain injury
- PMID: 37416997
- PMCID: PMC10332220
- DOI: 10.1080/13880209.2023.2229379
Metabolomics reveals the effects of hydroxysafflor yellow A on neurogenesis and axon regeneration after experimental traumatic brain injury
Abstract
Context: Hydroxysafflor yellow A (HSYA) is the main bioactive ingredient of safflower (Carthamus tinctorius L., [Asteraceae]) for traumatic brain injury (TBI) treatment.
Objective: To explore the therapeutic effects and underlying mechanisms of HSYA on post-TBI neurogenesis and axon regeneration.
Materials and methods: Male Sprague-Dawley rats were randomly assigned into Sham, controlled cortex impact (CCI), and HSYA groups. Firstly, the modified Neurologic Severity Score (mNSS), foot fault test, hematoxylin-eosin staining, Nissl's staining, and immunofluorescence of Tau1 and doublecortin (DCX) were used to evaluate the effects of HSYA on TBI at the 14th day. Next, the effectors of HSYA on post-TBI neurogenesis and axon regeneration were screened out by pathology-specialized network pharmacology and untargeted metabolomics. Then, the core effectors were validated by immunofluorescence.
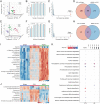
Results: HSYA alleviated mNSS, foot fault rate, inflammatory cell infiltration, and Nissl's body loss. Moreover, HSYA increased not only hippocampal DCX but also cortical Tau1 and DCX following TBI. Metabolomics demonstrated that HSYA significantly regulated hippocampal and cortical metabolites enriched in 'arginine metabolism' and 'phenylalanine, tyrosine and tryptophan metabolism' including l-phenylalanine, ornithine, l-(+)-citrulline and argininosuccinic acid. Network pharmacology suggested that neurotrophic factor (BDNF) and signal transducer and activator of transcription 3 (STAT3) were the core nodes in the HSYA-TBI-neurogenesis and axon regeneration network. In addition, BDNF and growth-associated protein 43 (GAP43) were significantly elevated following HSYA treatment in the cortex and hippocampus.
Discussion and conclusions: HSYA may promote TBI recovery by facilitating neurogenesis and axon regeneration through regulating cortical and hippocampal metabolism, BDNF and STAT3/GAP43 axis.
Keywords: Network pharmacology; brain-derived neurotrophic factor; cortex; growth-associated protein 43; hippocampus; signal transducer and activator of transcription 3; traditional Chinese medicine.
Conflict of interest statement
No potential conflict of interest was reported by the author(s).
Figures


Similar articles
-
Hydroxysafflor yellow A promotes the proliferation and differentiation of endogenous neural stem cells with neural regenerative effects in ischemic stroke.Phytomedicine. 2025 Aug;144:156905. doi: 10.1016/j.phymed.2025.156905. Epub 2025 May 30. Phytomedicine. 2025. PMID: 40494015
-
Integrated metabolomics and network pharmacology to reveal the mechanisms of hydroxysafflor yellow A against acute traumatic brain injury.Comput Struct Biotechnol J. 2021 Jan 26;19:1002-1013. doi: 10.1016/j.csbj.2021.01.033. eCollection 2021. Comput Struct Biotechnol J. 2021. PMID: 33613866 Free PMC article.
-
Hydroxysafflor yellow A exerts antioxidant effects in a rat model of traumatic brain injury.Mol Med Rep. 2016 Oct;14(4):3690-6. doi: 10.3892/mmr.2016.5720. Epub 2016 Sep 6. Mol Med Rep. 2016. PMID: 27599591 Free PMC article.
-
Pharmacological Actions, Molecular Mechanisms, Pharmacokinetic Progressions, and Clinical Applications of Hydroxysafflor Yellow A in Antidiabetic Research.J Immunol Res. 2021 Dec 13;2021:4560012. doi: 10.1155/2021/4560012. eCollection 2021. J Immunol Res. 2021. PMID: 34938814 Free PMC article. Review.
-
Hydroxysafflor yellow A, a natural compound from Carthamus tinctorius L with good effect of alleviating atherosclerosis.Phytomedicine. 2021 Oct;91:153694. doi: 10.1016/j.phymed.2021.153694. Epub 2021 Aug 4. Phytomedicine. 2021. PMID: 34403879 Review.
Cited by
-
Neuroprotective Effects of Peanut Skin Extract Against Oxidative Injury in HT-22 Neuronal Cells.Pharmaceuticals (Basel). 2025 Apr 8;18(4):544. doi: 10.3390/ph18040544. Pharmaceuticals (Basel). 2025. PMID: 40283979 Free PMC article.
-
Mechanism and Application of Chinese Herb Medicine in Treatment of Peripheral Nerve Injury.Chin J Integr Med. 2025 Mar;31(3):270-280. doi: 10.1007/s11655-024-4004-1. Epub 2024 Dec 2. Chin J Integr Med. 2025. PMID: 39617868 Review.
-
A Novel Network Pharmacology Strategy Based on the Universal Effectiveness-Common Mechanism of Medical Herbs Uncovers Therapeutic Targets in Traumatic Brain Injury.Drug Des Devel Ther. 2024 Apr 16;18:1175-1188. doi: 10.2147/DDDT.S450895. eCollection 2024. Drug Des Devel Ther. 2024. PMID: 38645986 Free PMC article.
-
Functional, Nutraceutical and Health Endorsing Perspectives of Saffron.Food Sci Nutr. 2025 Aug 6;13(8):e70721. doi: 10.1002/fsn3.70721. eCollection 2025 Aug. Food Sci Nutr. 2025. PMID: 40772023 Free PMC article. Review.
-
Non-coding RNAs as key players in neurodegeneration and brain tumors: Insights into therapeutic strategies.Iran J Basic Med Sci. 2025;28(8):962-985. doi: 10.22038/ijbms.2025.85350.18446. Iran J Basic Med Sci. 2025. PMID: 40584439 Free PMC article. Review.
References
MeSH terms
Substances
LinkOut - more resources
Full Text Sources
Other Literature Sources
Medical
Miscellaneous
