

Functional and microstructural plasticity following social and interoceptive mental training
- PMID: 37417306
- PMCID: PMC10414971
- DOI: 10.7554/eLife.85188
Functional and microstructural plasticity following social and interoceptive mental training
Abstract
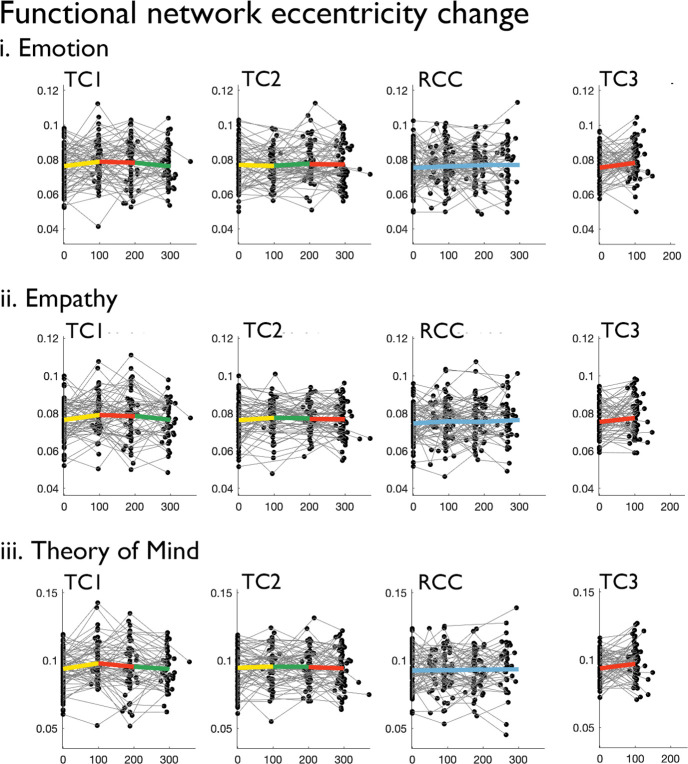
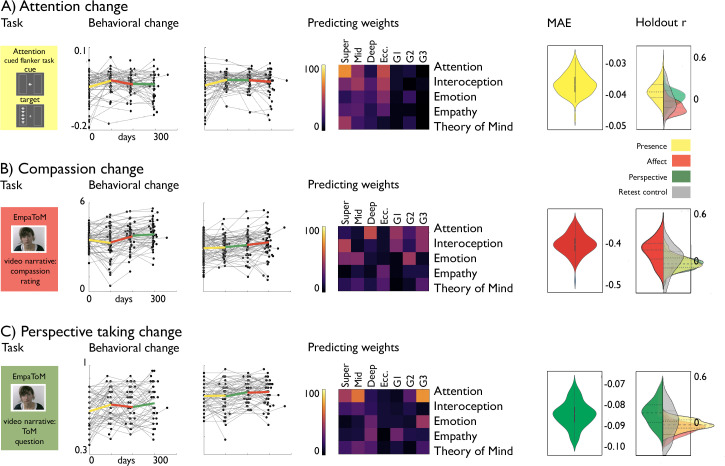
The human brain supports social cognitive functions, including Theory of Mind, empathy, and compassion, through its intrinsic hierarchical organization. However, it remains unclear how the learning and refinement of social skills shapes brain function and structure. We studied if different types of social mental training induce changes in cortical function and microstructure, investigating 332 healthy adults (197 women, 20-55 years) with repeated multimodal neuroimaging and behavioral testing. Our neuroimaging approach examined longitudinal changes in cortical functional gradients and myelin-sensitive T1 relaxometry, two complementary measures of cortical hierarchical organization. We observed marked changes in intrinsic cortical function and microstructure, which varied as a function of social training content. In particular, cortical function and microstructure changed as a result of attention-mindfulness and socio-cognitive training in regions functionally associated with attention and interoception, including insular and parietal cortices. Conversely, socio-affective and socio-cognitive training resulted in differential microstructural changes in regions classically implicated in interoceptive and emotional processing, including insular and orbitofrontal areas, but did not result in functional reorganization. Notably, longitudinal changes in cortical function and microstructure predicted behavioral change in attention, compassion and perspective-taking. Our work demonstrates functional and microstructural plasticity after the training of social-interoceptive functions, and illustrates the bidirectional relationship between brain organisation and human social skills.
Keywords: brain organization; human; intrinsic function; microstructure; neuroscience; plasticity; social cognition.
Plain language summary
Navigating daily life requires a number of social skills, such as empathy and understanding other people’s thoughts and feelings. Research has found that specific parts of the brain support these abilities in humans. For instance, the brain areas that support compassion are different from the regions involved in understanding other people’s perspective and thoughts. It is unclear how learning and refining social skills alters the brain. Previous studies have shown that learning new motor skills restructures the areas of the brain that regulate movement. Could acquiring and improving social skills have a similar effect? To investigate, Valk et al. trained more than 300 healthy adults in different social skills over the course of three months as part of the ReSource project. The program was designed to enhance abilities in compassion and perspective through mental exercises and working in pairs. Participants were also trained using different approaches to see whether changes to the brain are influenced by how a skill is learnt. The brains of the participants were repeatedly pictured using magnetic resonance imaging (MRI). This revealed that different types of training caused unique changes in specific parts of the brain. For example, teaching mindfulness made parts of the brain less functionally connected, whereas training to understand other people’s thought increased functional connections between various regions. These functional alterations were paralleled by changes in brain structure. They could also predict improvements in social skills which were measured throughout the study using behavioural tests. These findings suggest that training can help to improve social skills even in adults, which may benefit their quality of life through stronger social connections. Better knowledge of how to develop social skills and their biological basis will help to identify people who need support with these interactions and develop new therapies to nurture their abilities.
© 2023, Valk et al.
Conflict of interest statement
SV, PK, BP, SH, AB, FT, BB, TS No competing interests declared
Figures


Update of
- doi: 10.1101/2020.11.11.377895
Similar articles
-
Differential increase of hippocampal subfield volume after socio-affective mental training relates to reductions in diurnal cortisol.Elife. 2024 Aug 28;12:RP87634. doi: 10.7554/eLife.87634. Elife. 2024. PMID: 39196261 Free PMC article.
-
Structural plasticity of the social brain: Differential change after socio-affective and cognitive mental training.Sci Adv. 2017 Oct 4;3(10):e1700489. doi: 10.1126/sciadv.1700489. eCollection 2017 Oct. Sci Adv. 2017. PMID: 28983507 Free PMC article.
-
Enrichment Effects on Adult Cognitive Development: Can the Functional Capacity of Older Adults Be Preserved and Enhanced?Psychol Sci Public Interest. 2008 Oct;9(1):1-65. doi: 10.1111/j.1539-6053.2009.01034.x. Epub 2008 Oct 1. Psychol Sci Public Interest. 2008. PMID: 26162004
-
The developmental origins of naïve psychology in infancy.Adv Child Dev Behav. 2009;37:55-104. doi: 10.1016/s0065-2407(09)03702-1. Adv Child Dev Behav. 2009. PMID: 19673160 Review.
-
It matters what you practice: differential training effects on subjective experience, behavior, brain and body in the ReSource Project.Curr Opin Psychol. 2019 Aug;28:151-158. doi: 10.1016/j.copsyc.2018.12.005. Epub 2018 Dec 12. Curr Opin Psychol. 2019. PMID: 30684917 Review.
Cited by
-
Reshaped functional connectivity gradients in acute ischemic stroke.Neuroimage Clin. 2025;45:103755. doi: 10.1016/j.nicl.2025.103755. Epub 2025 Feb 23. Neuroimage Clin. 2025. PMID: 40043442 Free PMC article.
-
ENIGMA-Meditation: Worldwide Consortium for Neuroscientific Investigations of Meditation Practices.Biol Psychiatry Cogn Neurosci Neuroimaging. 2025 Apr;10(4):425-436. doi: 10.1016/j.bpsc.2024.10.015. Epub 2024 Nov 6. Biol Psychiatry Cogn Neurosci Neuroimaging. 2025. PMID: 39515581 Free PMC article. Review.
-
Longitudinal variation in resilient psychosocial functioning is associated with ongoing cortical myelination and functional reorganization during adolescence.Nat Commun. 2024 Jul 29;15(1):6283. doi: 10.1038/s41467-024-50292-2. Nat Commun. 2024. PMID: 39075054 Free PMC article.
-
Interoception as a key node in the multidimensional psychological structural model of depression: a structural equation model analysis of integrating environmental, cognitive and behavioral-emotional factors.BMC Psychiatry. 2025 Mar 6;25(1):205. doi: 10.1186/s12888-025-06648-z. BMC Psychiatry. 2025. PMID: 40050850 Free PMC article.
-
Multivariate Neural Markers of Individual Differences in Thought Control Difficulties.Res Sq [Preprint]. 2025 Mar 31:rs.3.rs-5945138. doi: 10.21203/rs.3.rs-5945138/v1. Res Sq. 2025. Update in: Neuroimage Clin. 2025 Jun 13;47:103826. doi: 10.1016/j.nicl.2025.103826. PMID: 40235512 Free PMC article. Updated. Preprint.
References
Publication types
MeSH terms
Grants and funding
LinkOut - more resources
Full Text Sources
