. 2023 Oct;71(10):2437-2455.
doi: 10.1002/glia.24434. Epub 2023 Jul 7.

Yin Yang 1 controls cerebellar astrocyte maturation

Affiliations

Yin Yang 1 controls cerebellar astrocyte maturation

Karli Mockenhaupt et al. Glia. 2023 Oct.

Abstract

Diverse subpopulations of astrocytes tile different brain regions to accommodate local requirements of neurons and associated neuronal circuits. Nevertheless, molecular mechanisms governing astrocyte diversity remain mostly unknown. We explored the role of a zinc finger transcription factor Yin Yang 1 (YY1) that is expressed in astrocytes. We found that specific deletion of YY1 from astrocytes causes severe motor deficits in mice, induces Bergmann gliosis, and results in simultaneous loss of GFAP expression in velate and fibrous cerebellar astrocytes. Single cell RNA-seq analysis showed that YY1 exerts specific effects on gene expression in subpopulations of cerebellar astrocytes. We found that although YY1 is dispensable for the initial stages of astrocyte development, it regulates subtype-specific gene expression during astrocyte maturation. Moreover, YY1 is continuously needed to maintain mature astrocytes in the adult cerebellum. Our findings suggest that YY1 plays critical roles regulating cerebellar astrocyte maturation during development and maintaining a mature phenotype of astrocytes in the adult cerebellum.

Keywords: YY1; astrocytes; cerebellum; heterogeneity; maturation.


Conflict of interest statement

Competing interests

The authors declare that they have no competing interests.

Figures

Fig. 1.
Fig. 1.. Deletion of YY1 in astrocytes drastically affects motor function.
(A-D) Expression of YY1 protein in (A) total brain lysates, (B) cultured astrocytes, (C) P10 mouse cerebellum, and (D) cultured cerebellar neurons. (E) Mean weight of Yy1loxP/loxP and Yy1ΔAST mice (n=15, 9; two-tailed t-test; * p <0.0001). (F) Survival of Yy1loxP/loxP and Yy1ΔAST mice (n=13, 14; Log Rank, Mantel-Cox Test; p=0.005). (G) Mean velocity (n=5, 5; two-tailed t-test; p=0.002), and (H) mean number of paw slips as mice crossed a balance beam (n=5, 5; two-tailed t-test; * p=0.008). (I) Tracks of Yy1loxP/loxP and Yy1ΔAST mice crossing narrow path.
Fig. 2.
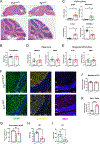
Fig. 2.. Effect of YY1 deletion on subpopulations of astrocytes in adult cerebellum.
(A) Hematoxylin and Eosin staining of Yy1loxP/loxP and Yy1ΔAST 8–12 week-old brains. (B) Weights of Yy1loxP/loxP and Yy1ΔAST cerebella (n=10, 9; two-tailed t-test; p=0.78). (C-E) Expression of mRNAs (normalized to GAPDH) in cerebella of Yy1loxP/loxP and Yy1ΔAST mice (n=9, 11; two-tailed t-test; * p<0.01). (F) Immunofluorescence of Yy1loxP/loxP and Yy1ΔAST cerebellum with GFAP, Calbindin, Iba1, and Hoechst. Confocal images at 40X, scale bar 20 μm. ML, molecular layer; GCL, granular cell layer; WM, white matter. (G) Quantification of GFAP+ processes in the ML (n=4, 3 mice; n=50, 40 locations; two-tailed t-test; * p=0.02). (H) Quantification of VA in the ML (n=3, 3 mice; n=15, 15 locations; two-tailed t-test; ** p=0.004). (I) Quantification of FA in the WM (n=3, 3 mice; n=15, 15 locations; two-tailed t-test; * p=0.034). (J) Quantification of PC bodies (n=3, 3 mice; n=29, 29 locations; two-tailed t-test; p=0.600). (K) Quantification of IBA1+ cells (n=4, 3 mice; n=35, 18 locations; two-tailed t-test; *** p=0.0004).
Fig. 3.
Fig. 3.. Deletion of YY1 in astrocytes of adult mice.
5–6-week-old mice were administered (IP) 75 mg/kg tamoxifen or corn oil over 5 days. (A) Model of experimental design. (B) Survival (n=5, 10, 8, 13 mice; Log Rank, Mantel-Cox test; * p<0.0001). (C) Mean velocity (n=5, 5, 5, 7; Two-way Anova; * p<0.003). (D) Mean number of paw slips on a balance beam (n=5, 5, 5, 7; Two-way Anova; * p<0.003). (E) Immunofluorescence of cerebellum (day 18 post induction) stained with GFAP, Calbindin, IBA1, and Hoechst; 20X. ML, molecular layer; GCL, granular cell layer; WM, white matter. (F) Quantification of GFAP+ processes (n=3, 4 mice; n=42, 54 locations; two-tailed t-test; * p<0.0001). (G) Quantification of IBA1+ cells (n=3, 3 mice; n=51, 40 locations; two-tailed t-test; p=0.22). (H) Sholl analysis of IBA1+ cells (n=3, 3 mice; n=51, 40 locations; multiple unpaired two-tailed t-test; * p<=0.03). (I) Expression of mRNAs (normalized to GAPDH) (n=16, 8; two-tailed t-test; * p<0.05, **p<0.01, ****p<0.0001).
Fig. 4.
Fig. 4.. Normal architecture of Yy1Aldh1L1-CreERT2 and Yy1ΔAST cerebella at P10.
4-day-old mice were administered (IP) 75 mg/kg tamoxifen over 5 days. (A) Model of experimental design (left). Immunofluorescence of cerebella (GCL/WM border) stained with YY1 and GFAP. White arrows point to astrocytes with/without YY1. (B) Immunofluorescence of TAM-treated cerebella stained with GFAP, Calbindin, Iba1, and Hoechst at 40X, scale bar 20 μm. ML, molecular layer; GCL, granular cell layer; WM, white matter. (C) Quantification of GFAP+ processes of BG (n=3, 3 mice; n=21, 18; locations; two-tailed t-test; p=0.21). (D) Quantification of IBA1+ cells (n=3, 3 mice; n=5, 8 locations; two-tailed t-test; p=0.34). (E) Immunofluorescence of Yy1loxP/loxP and Yy1ΔAST cerebellum at P10 stained with GFAP, Calbindin, Iba1, and Hoechst. Confocal images at 40X, scale bar 20 μm. ML, molecular layer; GCL, granular cell layer; WM, white matter. (F) Quantification of GFAP+ processes of BG (n=3, 3 mice; n=26, 26; locations; two-tailed t-test; p=0.29). (G) Quantification of PC bodies (n=3, 3 mice; n=10, 9 locations, two-tailed t-test; p=0.43). (H) Quantification of IBA1+ cells (n=3, 3 mice; n=40, 38 locations; two-tailed t-test; p=0.69). (I) Representative responses of a P10 Yy1loxP/loxP and Yy1ΔAST PC to 350 pA depolarizing and −400 pA hyperpolarizing step current injections (600 ms duration). (J) Overlay of the first action potentials in the train of E.
Fig. 5.
Fig. 5.. scRNA-seq analysis of Yy1loxP/loxP and Yy1ΔAST cerebella at P10.
(A) Two-dimensional UMAP clustering. 11,226 cerebellar cells (n= 2, 2; mice). (B) Box plot of UMI and gene number per cell in each cell cluster. (C) Expression of astrocyte markers in each cluster. (D) Overlap of top 618 cluster 6 genes with published mouse astrocyte gene sets (Batiuk et al., 2020; Borggrewe et al., 2021; Zhang et al., 2016). (E) UMAP and (F) violin plot visualization of YY1 expression in Yy1loxP/loxP and Yy1ΔAST cerebella. (G) Two-dimensional UMAP clustering visualizing subclusters of astrocytes. (H-J) UMAP graphs presenting the expression of subpopulation markers and their expression in situ (Allen Brain Atlas, P14) in BG (H), VA (I), and FA (J). (K) Heatmap of top 10 biomarkers for each subpopulation. Unsupervised analysis of gene expression profiles of BG, VA, and FA in Yy1LoxP/LoxP and Yy1ΔAST cerebella.
Fig. 6.
Fig. 6.. Differential effect of YY1 deletion on subpopulations of cerebellar astrocytes at P20.
(A) Immunofluorescence of Yy1loxP/loxP and Yy1ΔAST cerebella at P20 stained with GFAP, Calbindin, IBA1, and Hoechst. Confocal images at 40X, scale bar 20 μm. ML, molecular layer; GCL, granular cell layer; WM, white matter. (B) Quantification of GFAP+ processes of BG (n=3, 4 mice; n=16, 28 locations; two-tailed t-test; * p=0.01). (C) Quantification of PC bodies (n=3, 4 mice; n=8, 14 locations, two-tailed t-test; p=0.53). (D) Quantification of IBA1+ cells (n=4, 3 mice; n=19, 25 locations; two-tailed t-test; * p<0.0001).
Fig. 7.
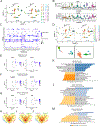
Fig. 7.. Unique astrocyte clusters are present in Yy1ΔAST cerebellum at P17.
(A) Two-dimensional UMAP clustering. 7,321 cerebellar cells were sequenced and analyzed. (n= 2, 2; mice). (B) Box plot of UMI and gene number per cell in each cluster. (C) Expression of astrocyte markers in each cell cluster. (D) Two-dimensional UMAP clustering visualizing subclusters of astrocytes. (E-G) UMAP graphs presenting the expression of subpopulation in BG (E), VA (F), and FA (G). (H-J) Overlap of top 728 BG (H), 387 VA (I), and 208 FA (J) genes with published mouse astrocyte gene sets (Batiuk et al., 2020; Borggrewe et al., 2021; Zhang et al., 2016). (K-M) Pathway analysis of biological processes regulated by differentially expressed genes in the Yy1loxP/loxP and Yy1ΔAST BG (K), VA (L), and FA (M). Top 10 enriched categories are shown.

References

    1. Araujo APB, Carpi-Santos R, & Gomes FCA (2019). The Role of Astrocytes in the Development of the Cerebellum. Cerebellum, 18(6), 1017–1035. doi:10.1007/s12311-019-01046-0 - DOI - PubMed
    1. Atchison ML (2014). Function of YY1 in Long-Distance DNA Interactions. Front Immunol, 5, 45. doi:10.3389/fimmu.2014.00045 - DOI - PMC - PubMed
    1. Batiuk MY, Martirosyan A, Wahis J, de Vin F, Marneffe C, Kusserow C, . . . Holt MG (2020). Identification of region-specific astrocyte subtypes at single cell resolution. Nat Commun, 11(1), 1220. doi:10.1038/s41467-019-14198-8 - DOI - PMC - PubMed
    1. Beagan JA, Duong MT, Titus KR, Zhou L, Cao Z, Ma J, . . . Phillips-Cremins JE (2017). YY1 and CTCF orchestrate a 3D chromatin looping switch during early neural lineage commitment. Genome Res, 27(7), 1139–1152. doi:10.1101/gr.215160.116 - DOI - PMC - PubMed
    1. Becht E, McInnes L, Healy J, Dutertre CA, Kwok IWH, Ng LG, . . . Newell EW (2018). Dimensionality reduction for visualizing single-cell data using UMAP. Nat Biotechnol. doi:10.1038/nbt.4314 - DOI - PubMed

Publication types

LinkOut - more resources