. 2023 Sep 1;325(3):H492-H509.
doi: 10.1152/ajpheart.00735.2022. Epub 2023 Jul 7.

Multiaxial pressure-strain analysis of regional myocardial work in the setting of graded coronary stenoses and dobutamine stress

Affiliations

Multiaxial pressure-strain analysis of regional myocardial work in the setting of graded coronary stenoses and dobutamine stress

John C Stendahl et al. Am J Physiol Heart Circ Physiol. .

Abstract

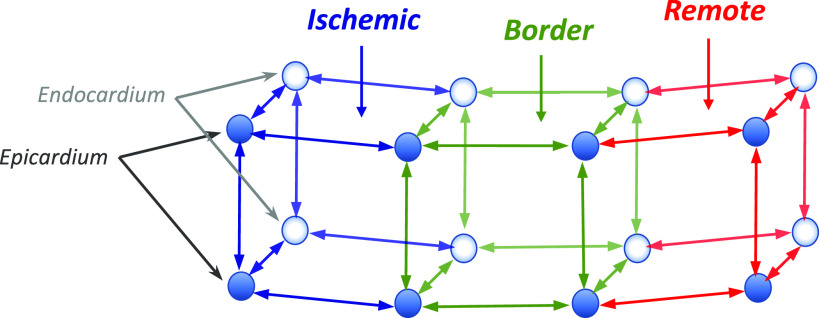
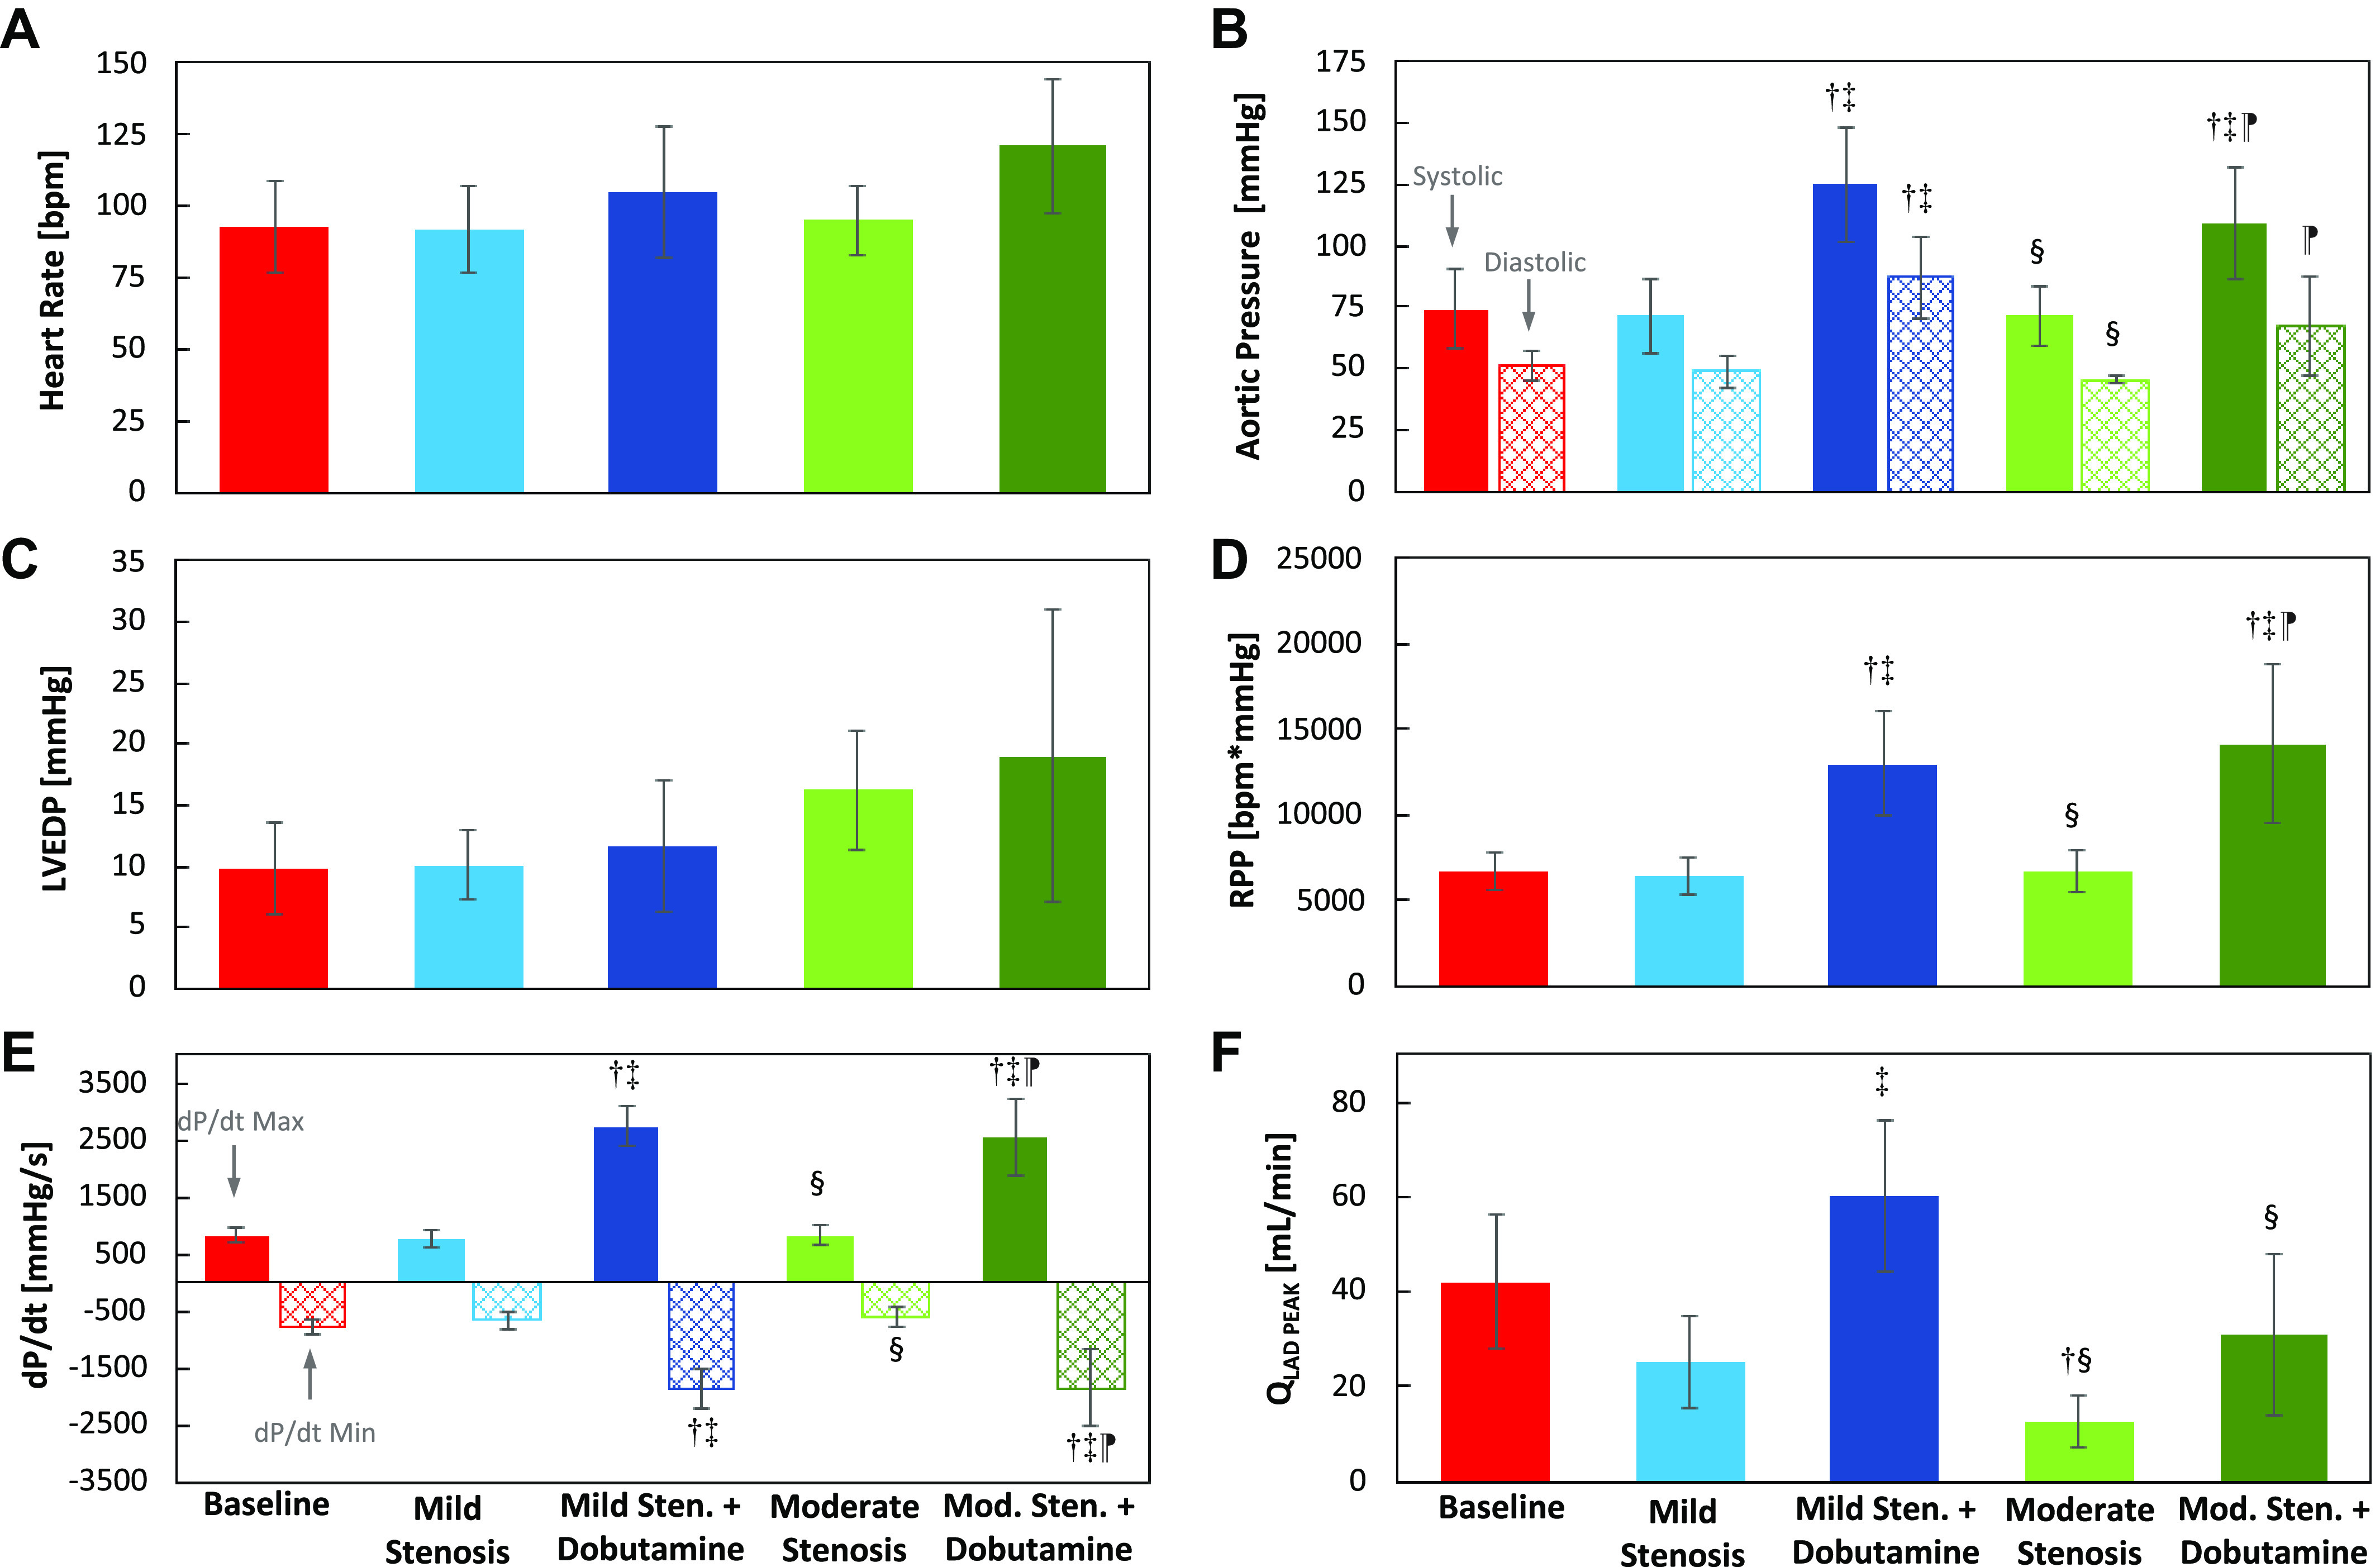
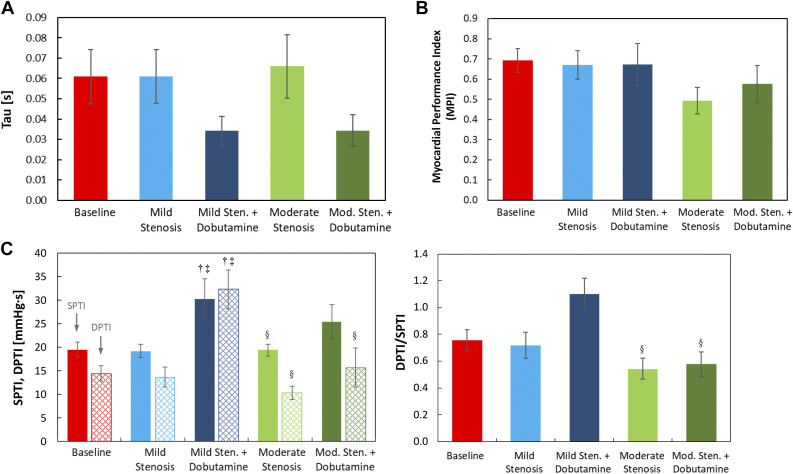
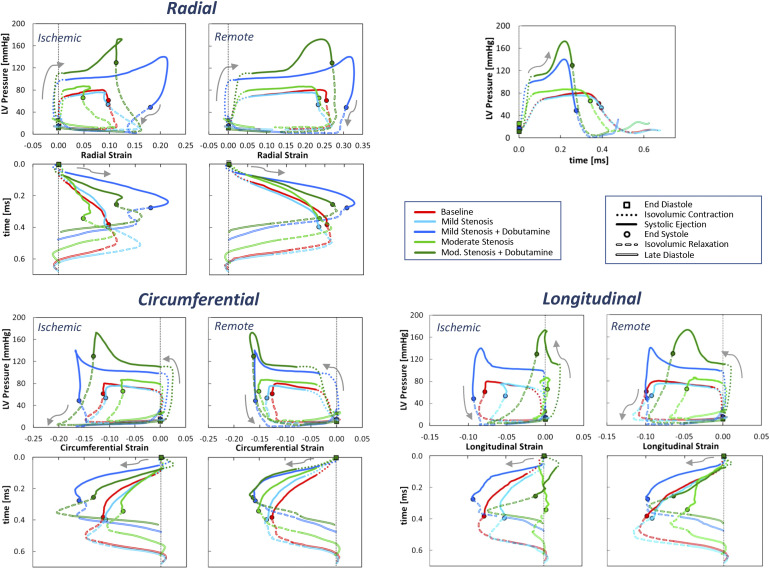
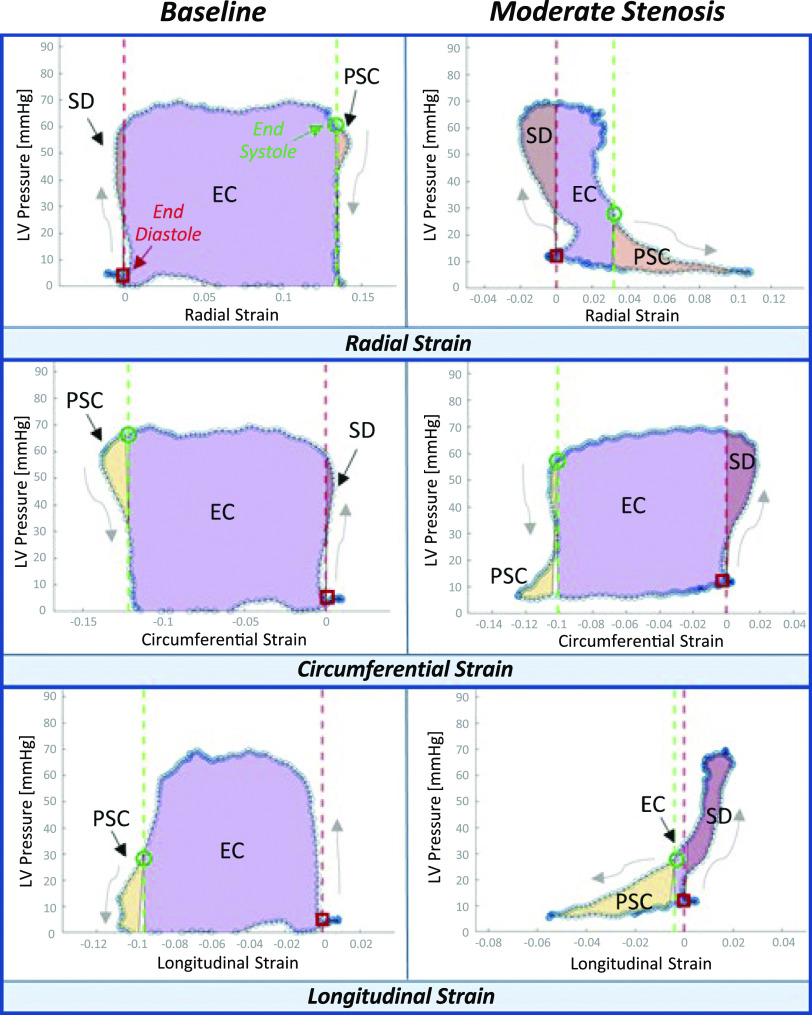
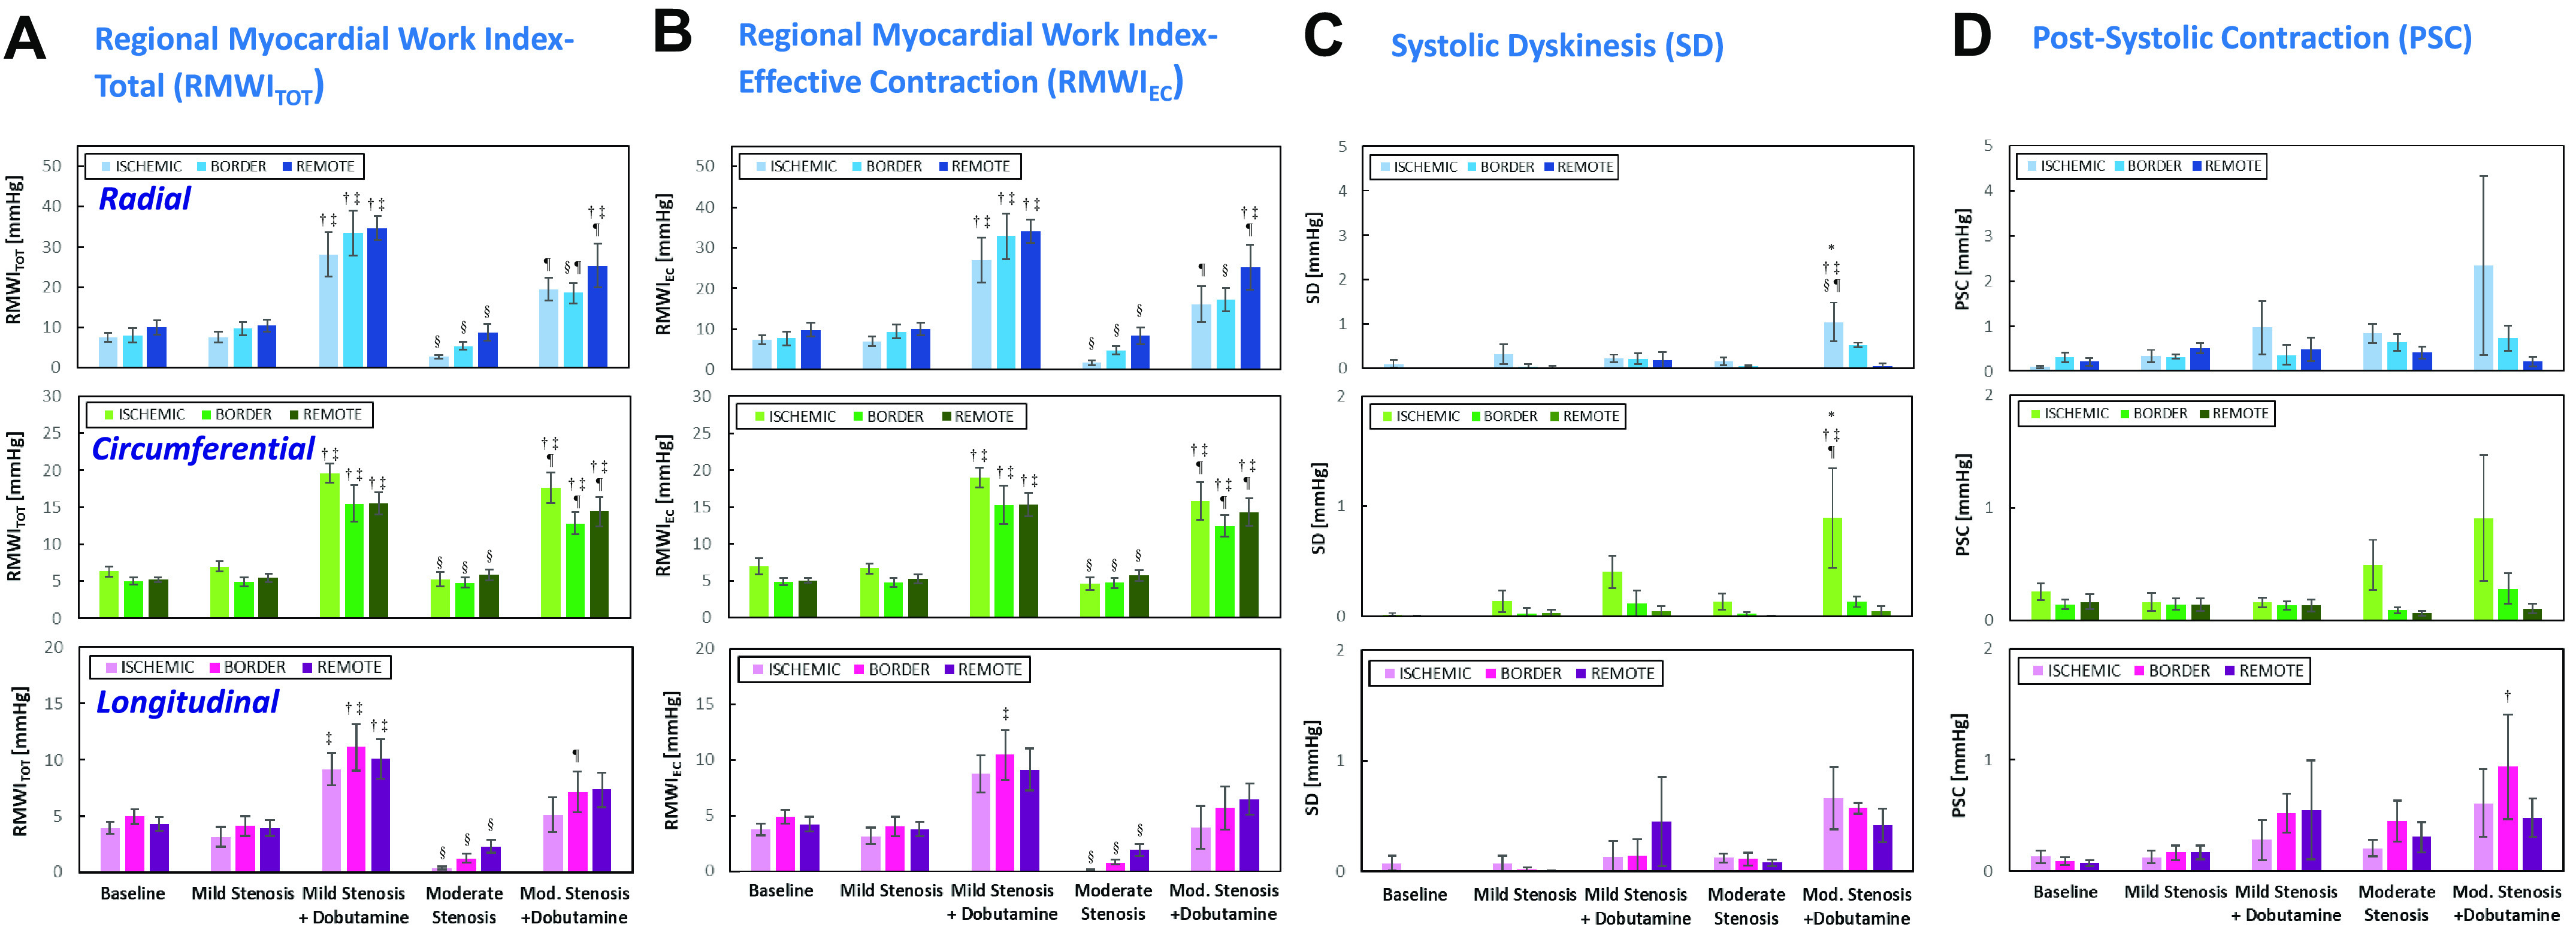
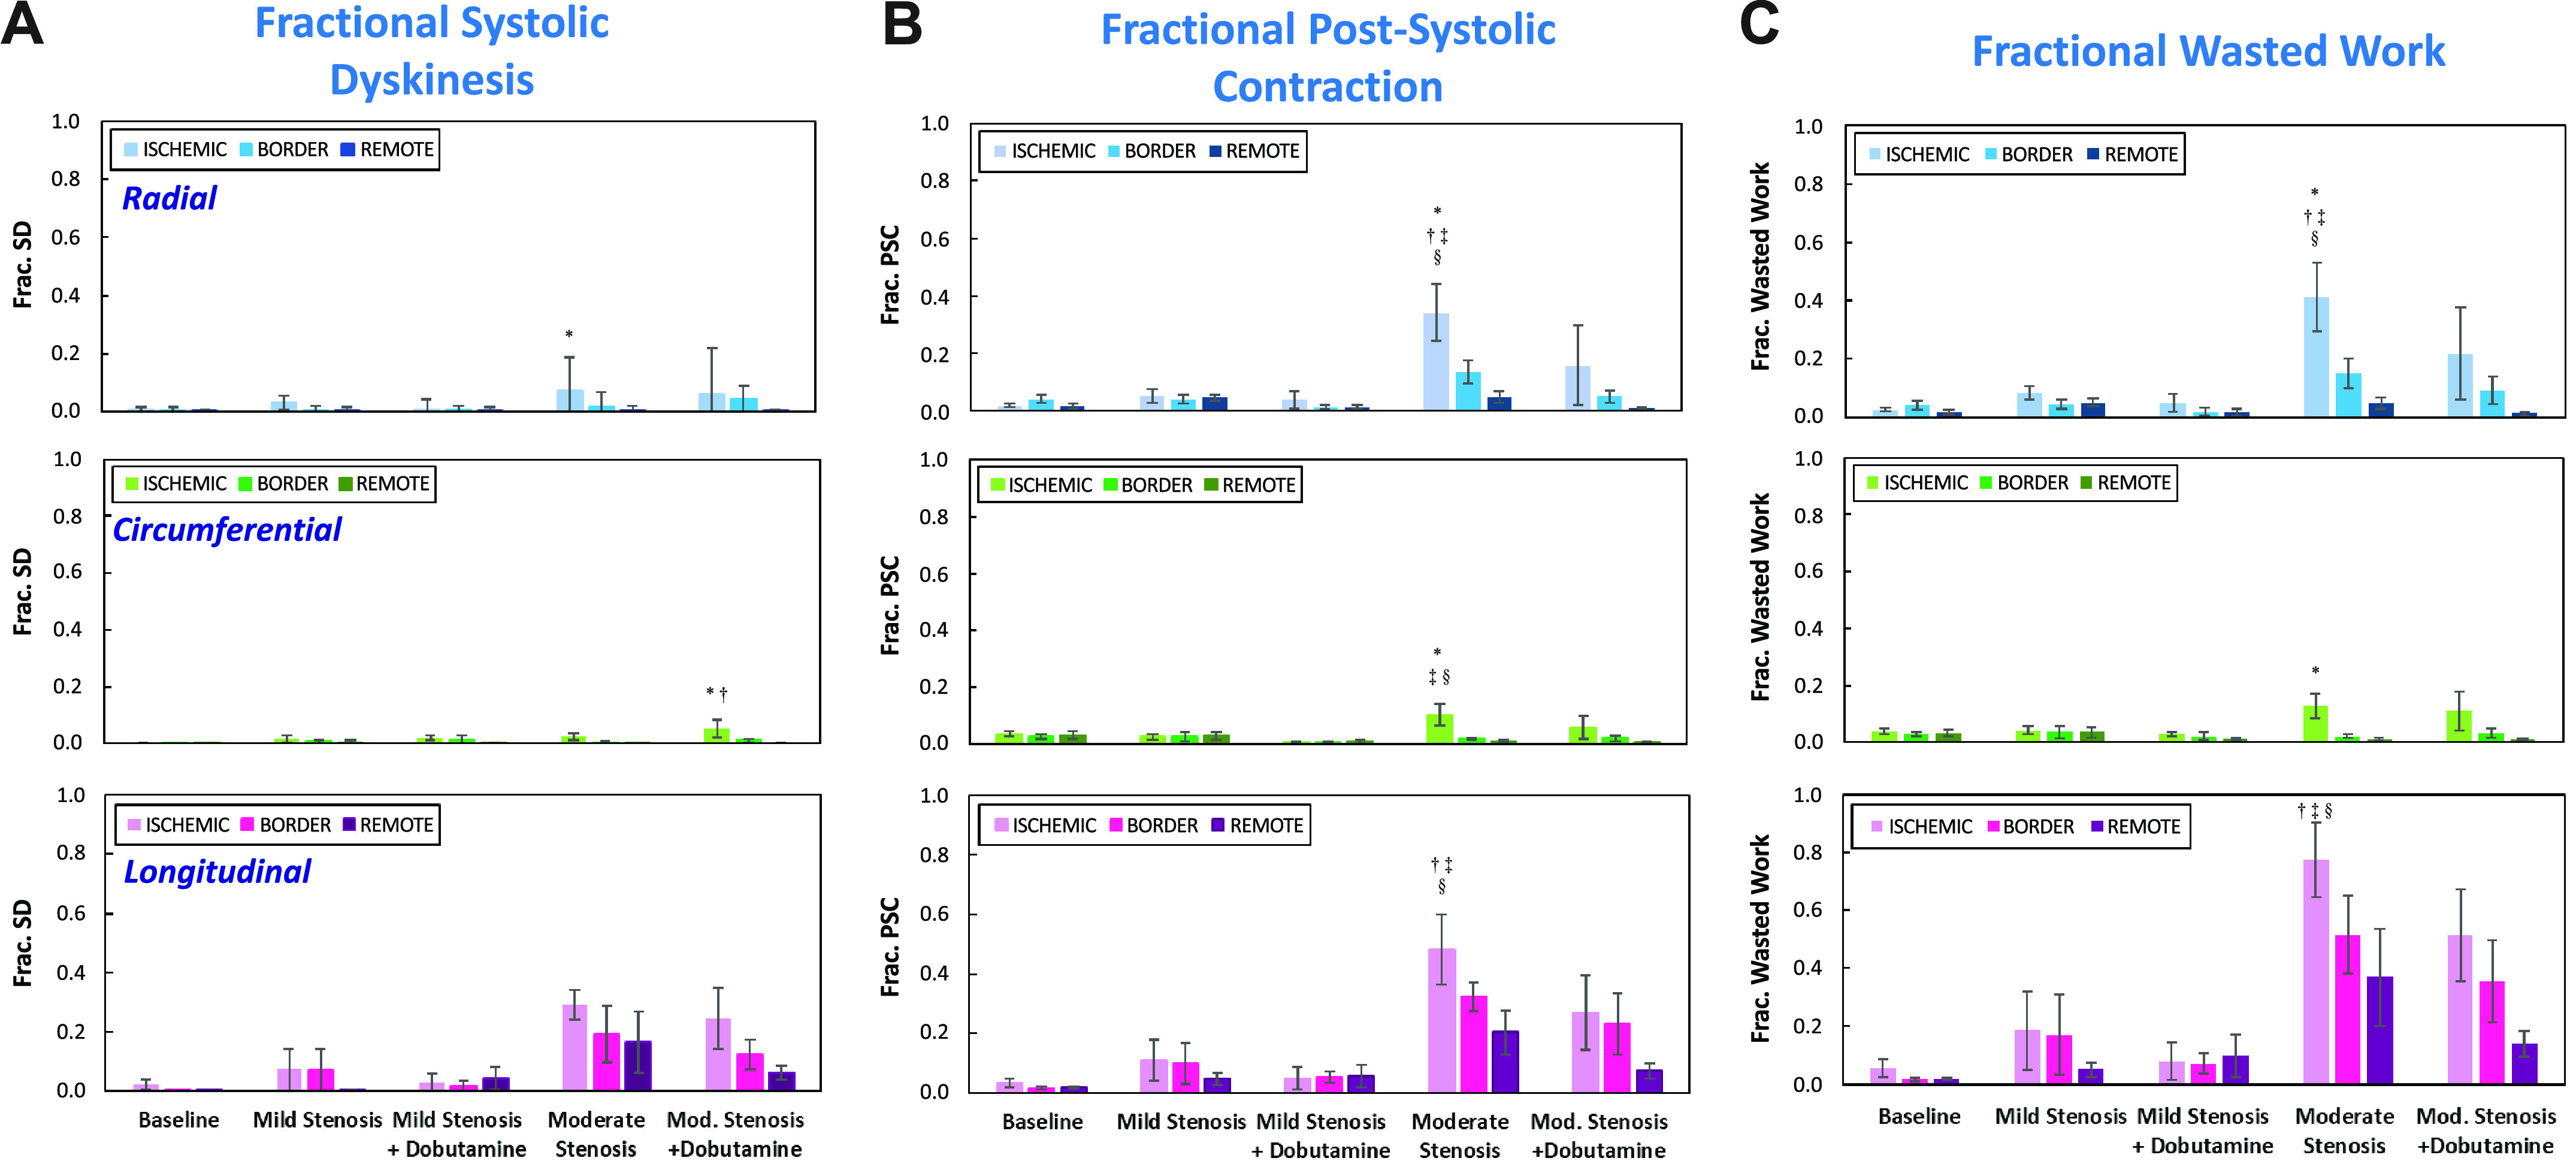
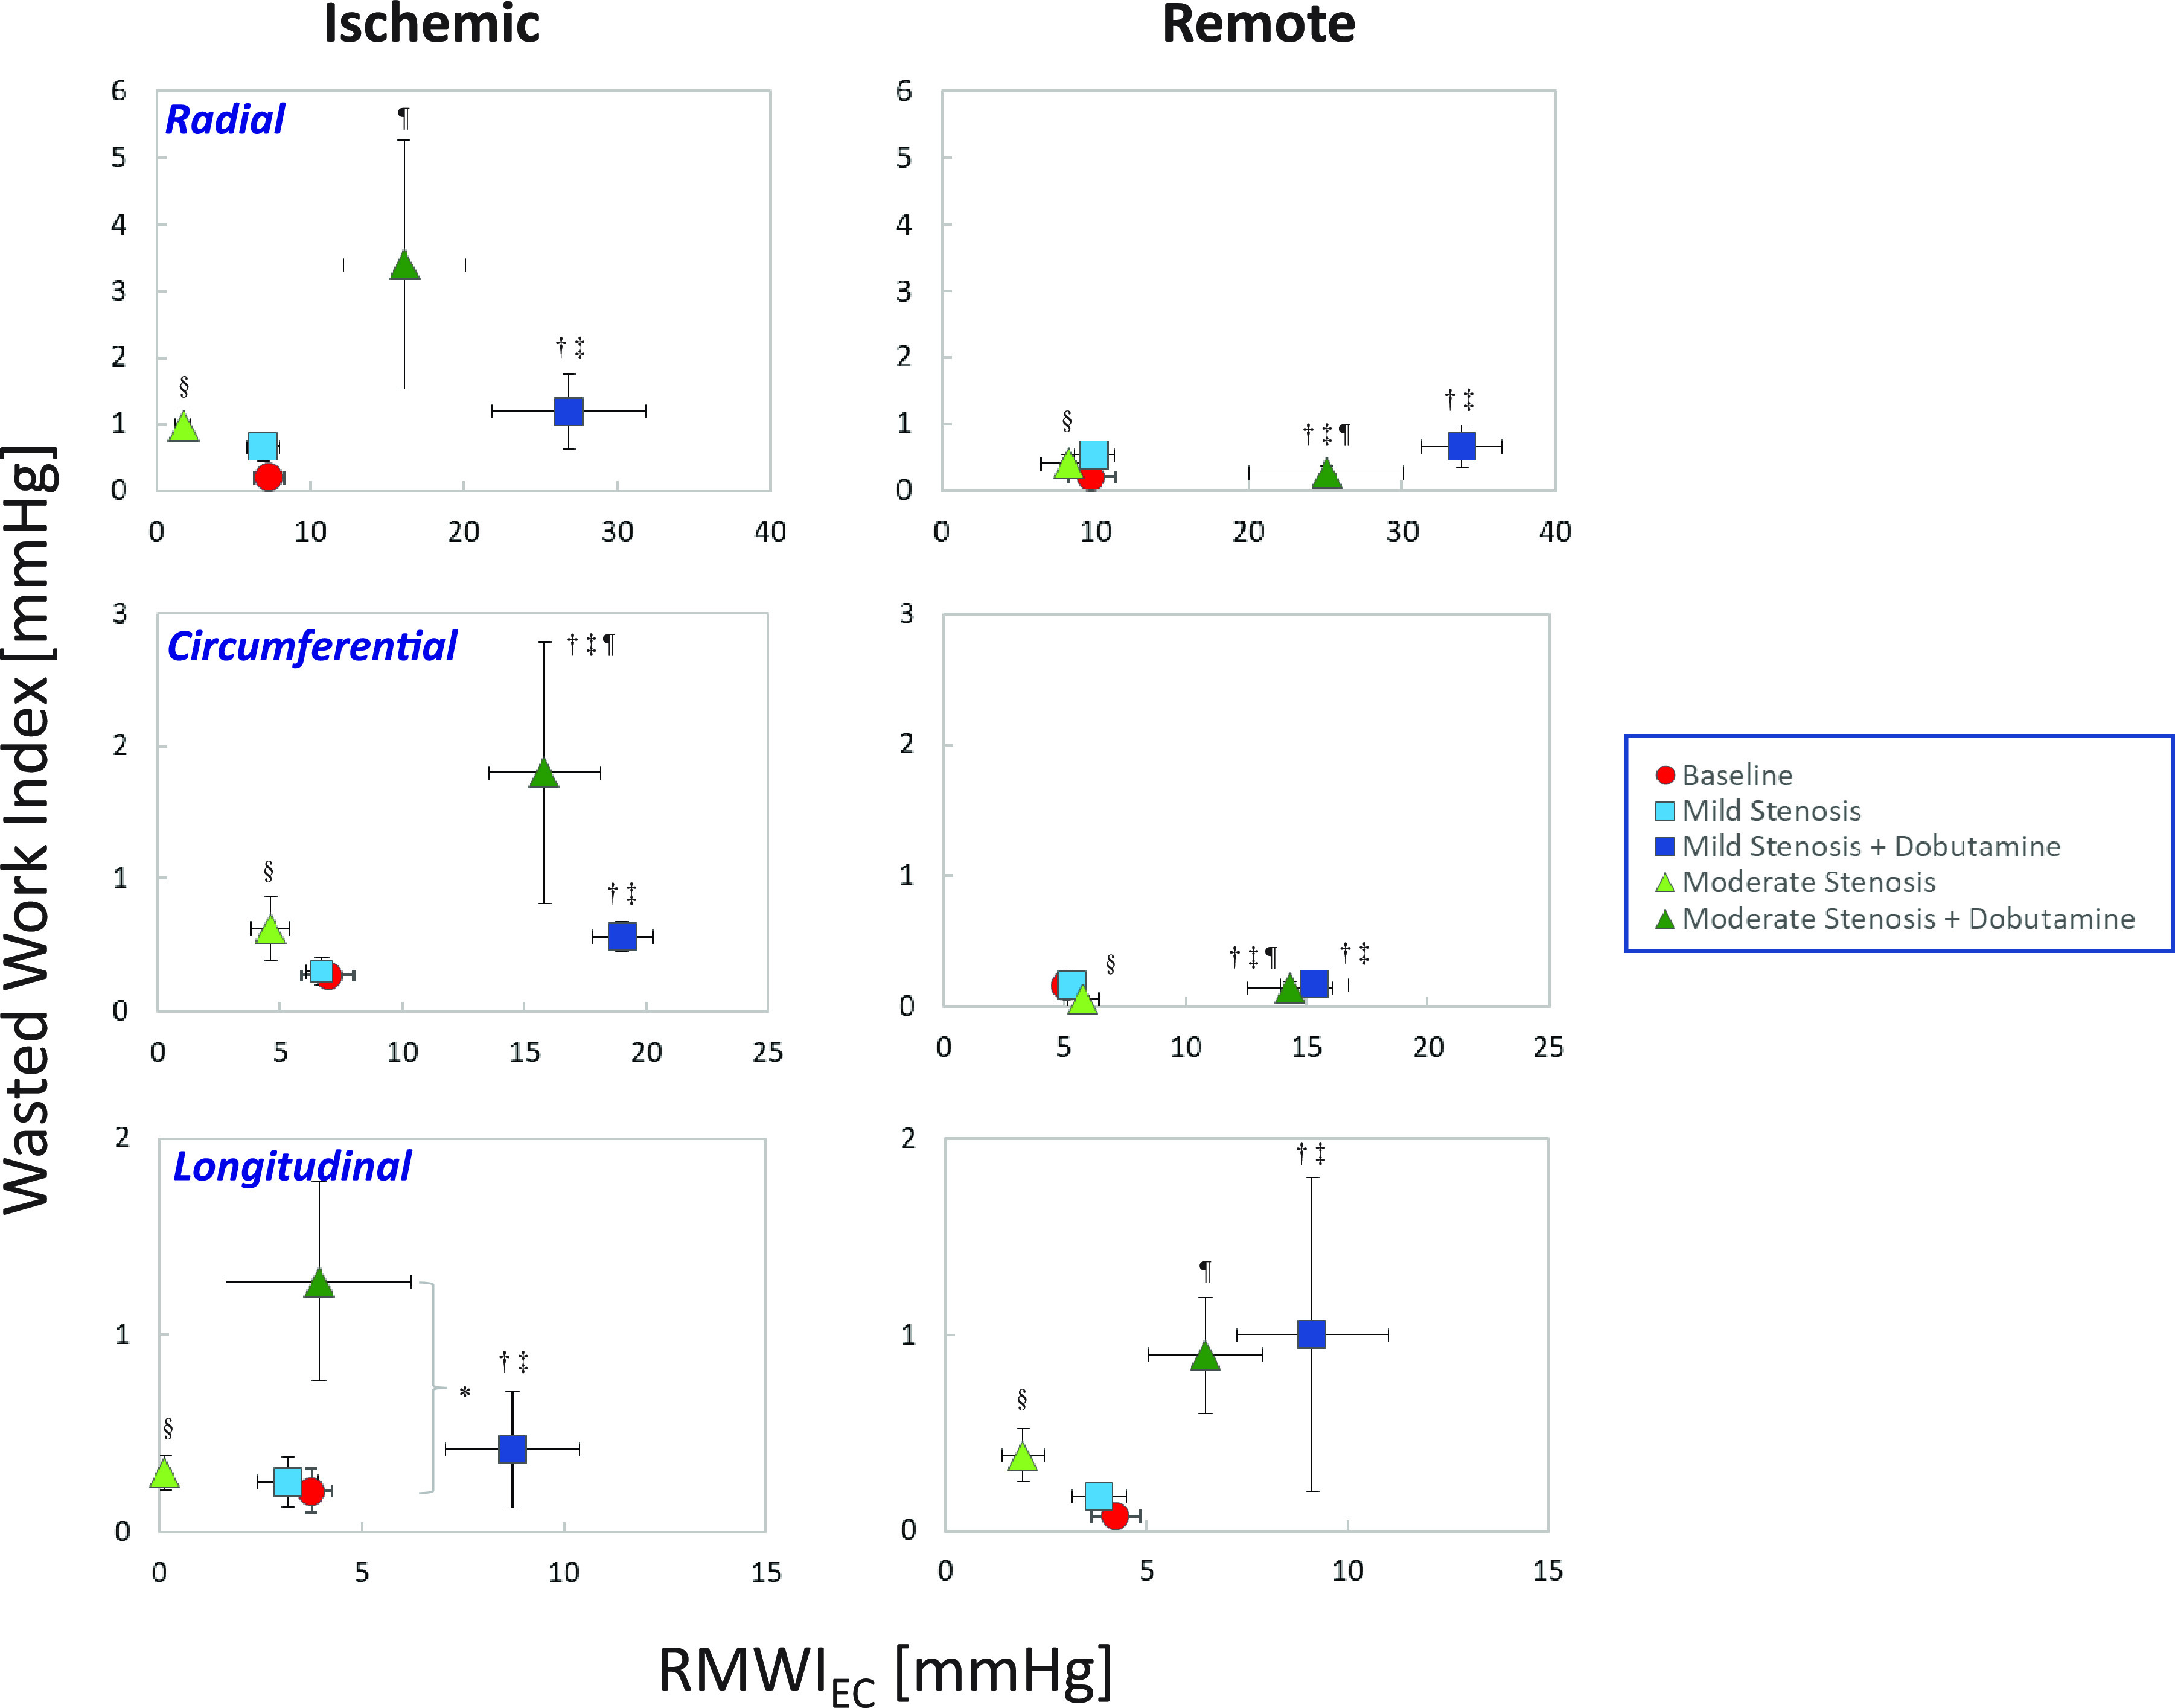
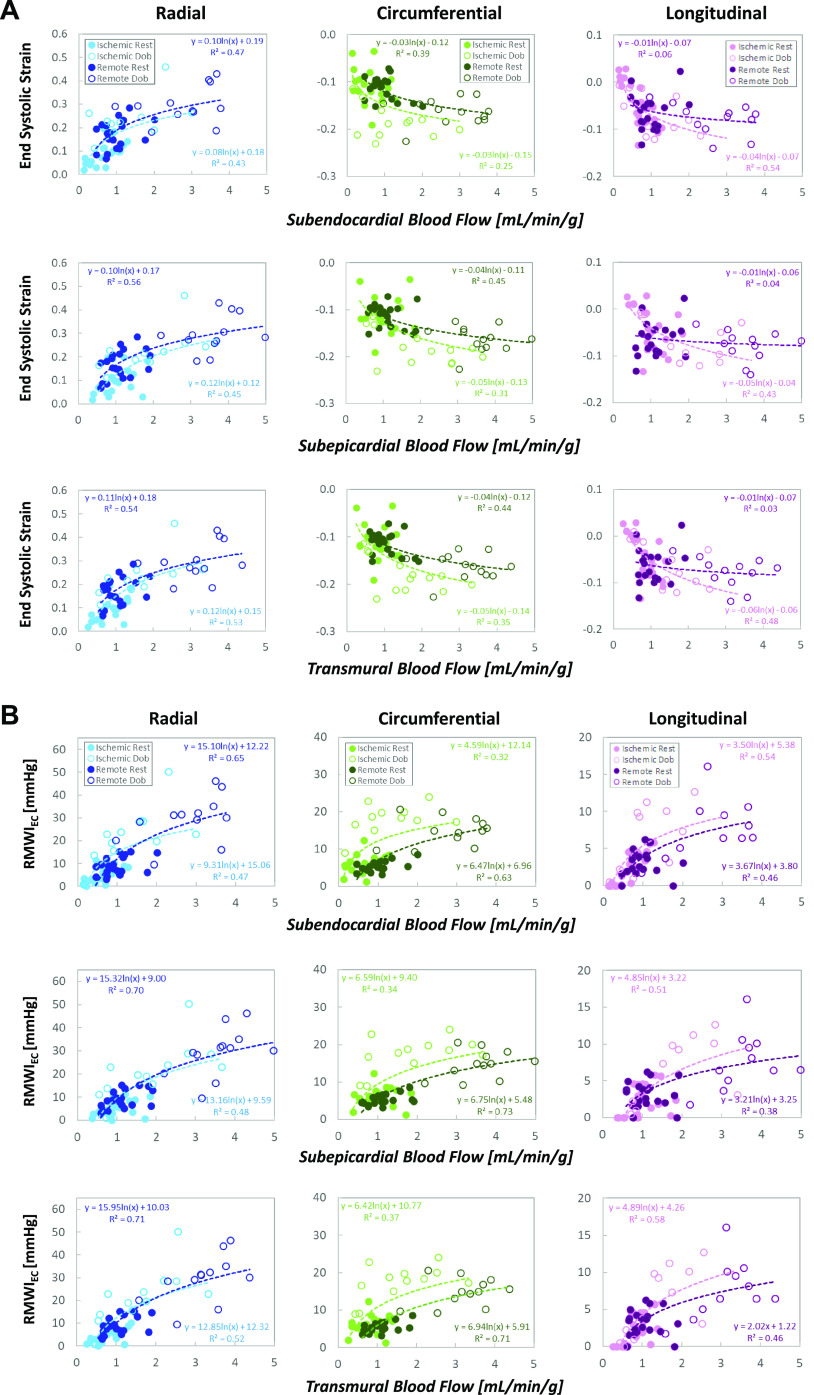
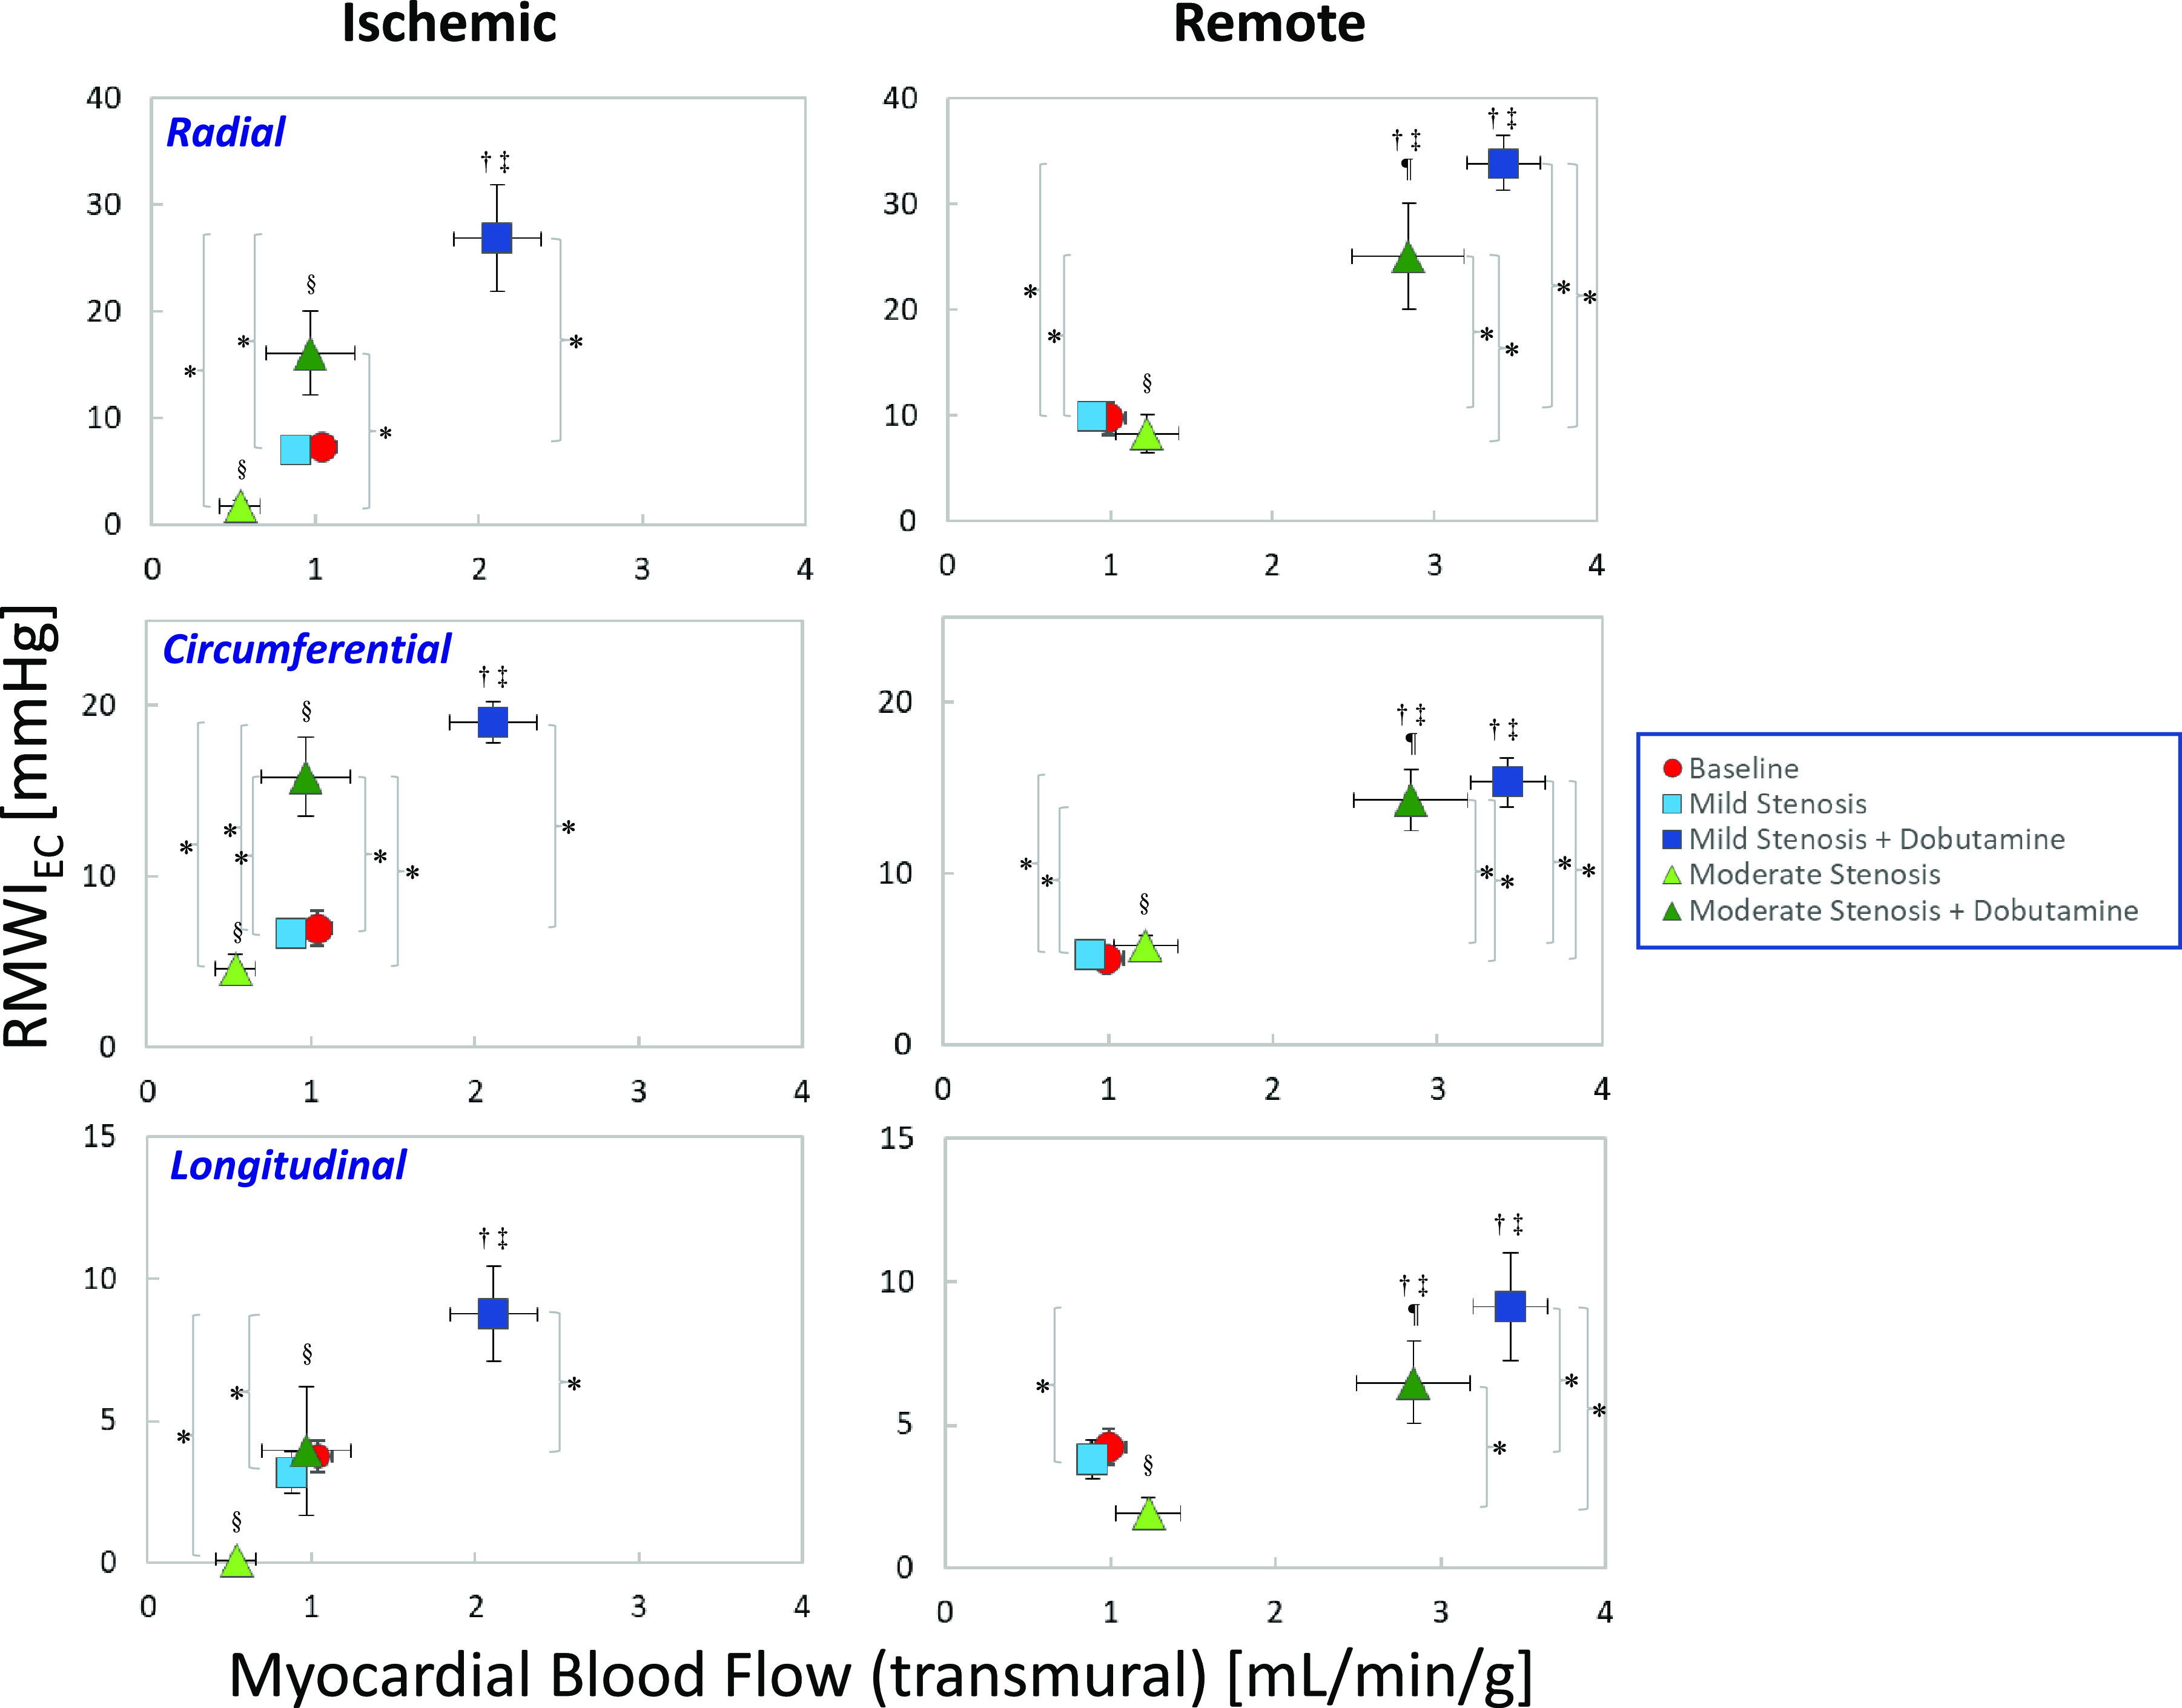
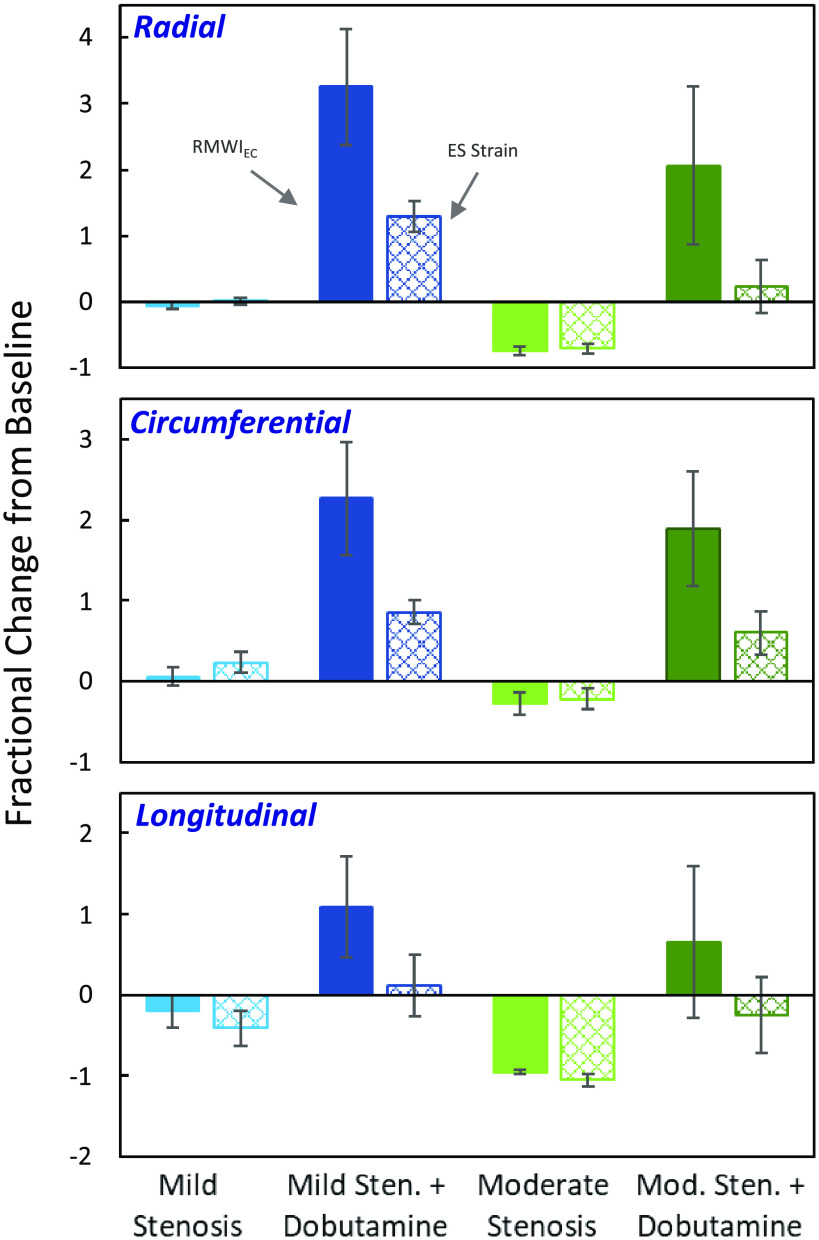
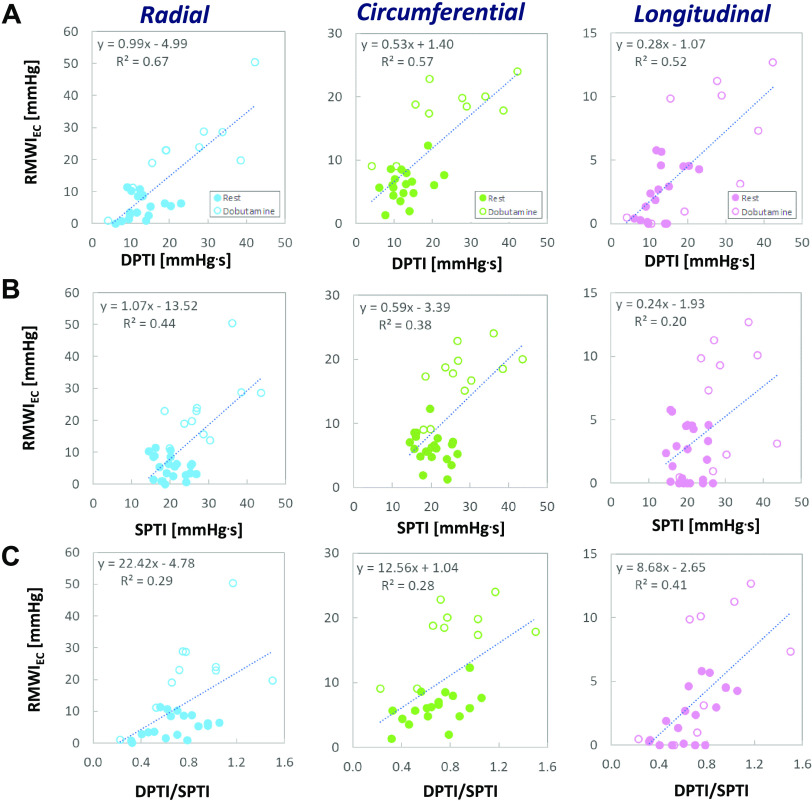
We present a detailed analysis of regional myocardial blood flow and work to better understand the effects of coronary stenoses and low-dose dobutamine stress. Our analysis is based on a unique open-chest model in anesthetized canines that features invasive hemodynamic monitoring, microsphere-based blood flow analysis, and an extensive three-dimensional (3-D) sonomicrometer array that provides multiaxial deformational assessments in the ischemic, border, and remote vascular territories. We use this model to construct regional pressure-strain loops for each territory and quantify the loop subcomponent areas that reflect myocardial work contributing to the ejection of blood and wasted work that does not. We demonstrate that reductions in coronary blood flow markedly alter the shapes and temporal relationships of pressure-strain loops, as well as the magnitudes of their total and subcomponent areas. Specifically, we show that moderate stenoses in the mid-left anterior descending coronary artery decrease regional midventricle myocardial work indices and substantially increase indices of wasted work. In the midventricle, these effects are most pronounced along the radial and longitudinal axes, with more modest effects along the circumferential axis. We further demonstrate that low-dose dobutamine can help to restore or even improve function, but often at the cost of increased wasted work. This detailed, multiaxial analysis provides unique insight into the physiology and mechanics of the heart in the presence of ischemia and low-dose dobutamine, with potential implications in many areas, including the detection and characterization of ischemic heart disease and the use of inotropic support for low cardiac output.NEW & NOTEWORTHY Our unique experimental model assesses cardiac pressure-strain relationships along multiple axes in multiple regions. We demonstrate that moderate coronary stenoses decrease regional myocardial work and increase wasted work and that low-dose dobutamine can help to restore myocardial function, but often with further increases in wasted work. Our findings highlight the significant directional variation of cardiac mechanics and demonstrate potential advantages of pressure-strain analyses over traditional, purely deformational measures, especially in characterizing physiological changes related to dobutamine.

Keywords: coronary stenosis; dobutamine; myocardial strain; myocardial work; pressure-strain.


Conflict of interest statement

No conflicts of interest, financial or otherwise, are declared by the authors.

Figures

Figure 1.
Figure 1.
Illustration of the sonomicrometer crystal matrix that was implanted into the midanterior wall of the left ventricle, just distal to a hydraulic occluder on the left anterior descending coronary artery. The cubes formed by the crystals delineate the ischemic, border, and remote regions of the left anterior descending territory. Each crystal of the matrix sends and receives ultrasound signals to other crystals to provide continuous, high-temporal resolution measurements of regional myocardial deformation.
Figure 2.
Figure 2.
Mean hemodynamic data (n = 7 dogs) at each experimental condition: baseline (red), mild stenosis (light blue), mild stenosis + dobutamine (dark blue), moderate stenosis (light green), and moderate stenosis + dobutamine (dark green). Plots are as follows: heart rate (A), aortic pressure (systolic = solid color, diastolic = crosshatched; B), left ventricular end-diastolic pressure (LVEDP; C), rate-pressure product (RPP; D), first derivative of left ventricular pressure (dP/dt; maximum = solid color, minimum = crosshatched; E), and peak left anterior descending coronary artery (LAD) blood flow (QLAD peak; F). Error bars represent standard deviation and symbols denote P < 0.05 via one-way ANOVA with Tukey’s multiple comparison test (†vs. baseline, ‡vs. mild stenosis, §vs. mild stenosis + dobutamine, and ¶vs. moderate stenosis).
Figure 3.
Figure 3.
Variation of global hemodynamic indices across experimental conditions (n = 7 dogs). Plots are as follows: tau (A), myocardial performance index (MPI; B), and diastolic pressure-time index (DPTI, myocardial oxygen supply; solid color; C), systolic pressure-time index (SPTI; myocardial oxygen demand; crosshatched), and DPTI/SPTI (supply/demand). Error bars represent standard error of measurement, and symbols denote P < 0.05 via one-way ANOVA with Tukey’s multiple comparison test (†vs. baseline, ‡vs. mild stenosis, and §vs. mild stenosis + dobutamine).
Figure 4.
Figure 4.
Left ventricular pressure-strain-time relationships for a representative animal at each experimental condition: baseline (red), mild stenosis (light blue), mild stenosis + dobutamine (dark blue), moderate stenosis (light green), and moderate stenosis + dobutamine (dark green). The following components of the cardiac cycle are delineated in the plots: end diastole (squares), isovolumic contraction (dotted lines), systolic ejection (solid lines), end systole (circles), isovolumic relaxation (open dashed lines), and late diastole (open solid lines).
Figure 5.
Figure 5.
Representative left ventricular pressure-strain plots in the three cardiac strain directions with subcomponent analysis demonstrating changes between baseline and moderate stenosis. Each pressure-strain loop is divided into the following 3 subcomponents as determined by the cardiac cycle: systolic dyskinesis (SD), i.e., systolic shortening in the radial direction or systolic lengthening in the circumferential/longitudinal directions; effective contraction (EC), i.e., contraction during systole with ejection of blood through an open aortic valve; and postsystolic contraction (PSC), i.e., contraction during diastole against a closed aortic valve. Dashed red lines denote end diastole, and dashed green lines denote end systole. In the presence of moderate stenoses, pressure-strain loops demonstrated significant shape and area changes, with relative increases in SD and PSC areas.
Figure 6.
Figure 6.
Mean pressure-strain loop areas corresponding to the following regions: regional myocardial work index based on total pressure-strain loop area (RMWITot; A), regional myocardial work index based on effective contraction pressure-strain loop area (RMWIEC; B), systolic dyskinesis (SD; C), and postsystolic contraction (PSC; D; n = 7 dogs). Error bars represent standard error of measurement, and symbols denote P < 0.05 via one-way ANOVA with Tukey’s multiple comparison test [*vs. remote (per given condition), †vs. baseline, ‡vs. mild stenosis, §vs. mild stenosis + dobutamine, and ¶vs. moderate stenosis].
Figure 7.
Figure 7.
Plots of effective contraction regional myocardial work index (RMWIEC) vs. end-systolic myocardial strain in the radial, circumferential, and longitudinal directions at rest (solid circles) and with low-dose dobutamine (open circles) (n = 7 dogs, various experimental conditions).
Figure 8.
Figure 8.
Mean fractional areas of pressure-strain components in relation to total loop area (n = 7 dogs): fractional systolic dyskinesis (SD; A), fractional postsystolic contraction (PSC; B), and fractional wasted work (C). Error bars represent standard error of measurement, and symbols denote P < 0.05 via one-way ANOVA with Tukey’s multiple comparison test [*vs. remote (per given condition), †vs. baseline, ‡vs. mild stenosis, and §vs. mild stenosis + dobutamine].
Figure 9.
Figure 9.
Relationships between mean regional wasted work index and effective contraction regional myocardial work index (RMWIEC) along the radial, circumferential, and longitudinal axes in the ischemic and remote regions for each of the following experimental conditions: baseline (red circles), mild stenosis (light blue squares), mild stenosis + dobutamine (dark blue squares), moderate stenosis (light green triangles), and moderate stenosis + dobutamine (dark green triangles) (n = 7 dogs). Error bars represent standard error of measurement, and symbols denote P < 0.05 via one-way ANOVA with Tukey’s multiple comparison test (†vs. baseline, ‡vs. mild stenosis, §vs. mild stenosis + dobutamine, ¶vs. moderate stenosis; and *vs. conditions contained by brackets).
Figure 10.
Figure 10.
Plots of regional end-systolic strain (A) and effective contraction regional myocardial work index (RMWIEC; B) vs. subendocardial, subepicardial, and transmural microsphere-based myocardial blood flow in the radial, circumferential, and longitudinal directions at rest (solid circles) and with low-dose dobutamine (open circles) (n = 7 dogs, various experimental conditions). Logarithmic curve fits using least squares methods and corresponding equations and correlation coefficients are also included. Lighter shades of colors represent ischemic regions, and darker shades represent remote regions.
Figure 11.
Figure 11.
Plots demonstrating the relationship between microsphere-based myocardial blood flow (transmural) and effective contraction regional myocardial work index (RMWIEC) along the radial, circumferential, and longitudinal axes in the ischemic and remote regions for each of the following experimental conditions: baseline (red circles), mild stenosis (light blue squares), mild stenosis + dobutamine (dark blue squares), moderate stenosis (light green triangles), and moderate stenosis + dobutamine (dark green triangles) (n = 7 dogs). Error bars represent standard error of measurement, and symbols denote P < 0.05 via one-way ANOVA with Tukey’s multiple comparison test (†vs. baseline, ‡vs. mild stenosis, §vs. mild stenosis + dobutamine, ¶vs. moderate stenosis; and *vs. conditions contained by brackets).
Figure 12.
Figure 12.
Comparison of mean absolute fractional changes in effective contraction regional myocardial work index (RMWIEC) and end-systolic strain from baseline for each experimental condition in the radial, circumferential, and longitudinal directions (n = 7 dogs). RMWIEC fractional changes are shown in solid colors and end-systolic strain fractional changes are shown in crosshatched colors. Error bars represent standard error of measurement. Differences between fractional changes at each condition were not statistically significant via one-way ANOVA with Tukey’s multiple comparison test at P < 0.05.
Figure 13.
Figure 13.
Plots demonstrating the relationship of ischemic region effective contraction regional myocardial work index (RMWIEC) and global indices of supply and demand: diastolic pressure-time index (DPTI; myocardial oxygen supply; A), systolic pressure-time index (SPTI; myocardial oxygen demand; B), and DPTI/SPTI (supply/demand; C) (n = 7 dogs, various experimental conditions). Solid circles represent resting conditions (no dobutamine), and open circles represent low-dose dobutamine. Trendlines represent least squares fits.

Similar articles

References

    1. Stendahl JC, Parajuli N, Lu A, Boutagy NE, Guerrera N, Alkhalil I, Lin BA, Staib LH, O'Donnell M, Duncan JS, Sinusas AJ. Regional myocardial strain analysis via 2D speckle tracking echocardiography: validation with sonomicrometry and correlation with regional blood flow in the presence of graded coronary stenoses and dobutamine stress. Cardiovasc Ultrasound 18: 2, 2020. doi:10.1186/s12947-019-0183-x. - DOI - PMC - PubMed
    1. Safwat A, Leone BJ, Norris RM, Foëx P. Pressure-length loop area: its components analyzed during graded myocardial ischemia. J Am Coll Cardiol 17: 790–796, 1991. doi:10.1016/s0735-1097(10)80199-8. - DOI - PubMed
    1. Suga H. Total mechanical energy of a ventricle model and cardiac oxygen consumption. Am J Physiol Heart Circ Physiol 236: H498–H505, 1979. doi:10.1152/ajpheart.1979.236.3.H498. - DOI - PubMed
    1. Takaoka H, Takeuchi M, Odake M, Yokoyama M. Assessment of myocardial oxygen consumption (VO2) and systolic pressure-volume area (PVA) in human hearts. Eur Heart J 13 Suppl E: 85–90, 1992. doi:10.1093/eurheartj/13.suppl_e.85. - DOI - PubMed
    1. Delhaas T, Arts T, Prinzen FW, Reneman RS. Regional fibre stress-fibre strain area as an estimate of regional blood flow and oxygen demand in the canine heart. J Physiol 477: 481–496, 1994. doi:10.1113/jphysiol.1994.sp020209. - DOI - PMC - PubMed

Publication types

LinkOut - more resources