. 2023 Aug 1;325(2):H414-H431.
doi: 10.1152/ajpheart.00220.2023. Epub 2023 Jul 7.

Long-term changes in heart rate and electrical remodeling contribute to alternans formation in heart failure: a patient-specific in silico study

Affiliations

Long-term changes in heart rate and electrical remodeling contribute to alternans formation in heart failure: a patient-specific in silico study

Vrishti M Phadumdeo et al. Am J Physiol Heart Circ Physiol. .

Abstract

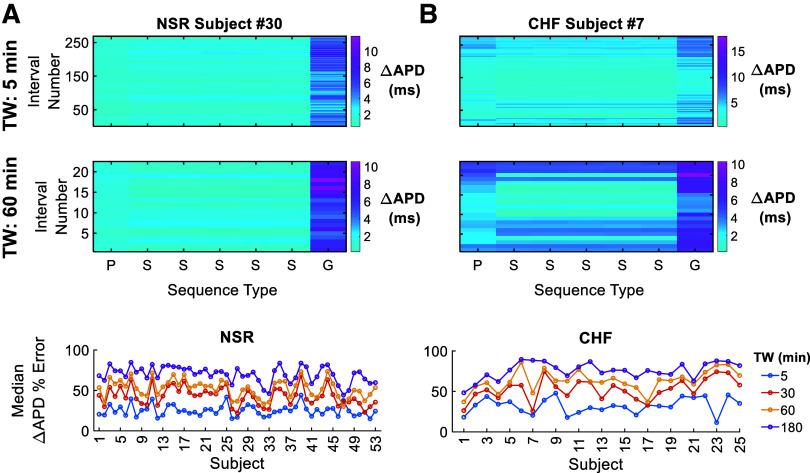
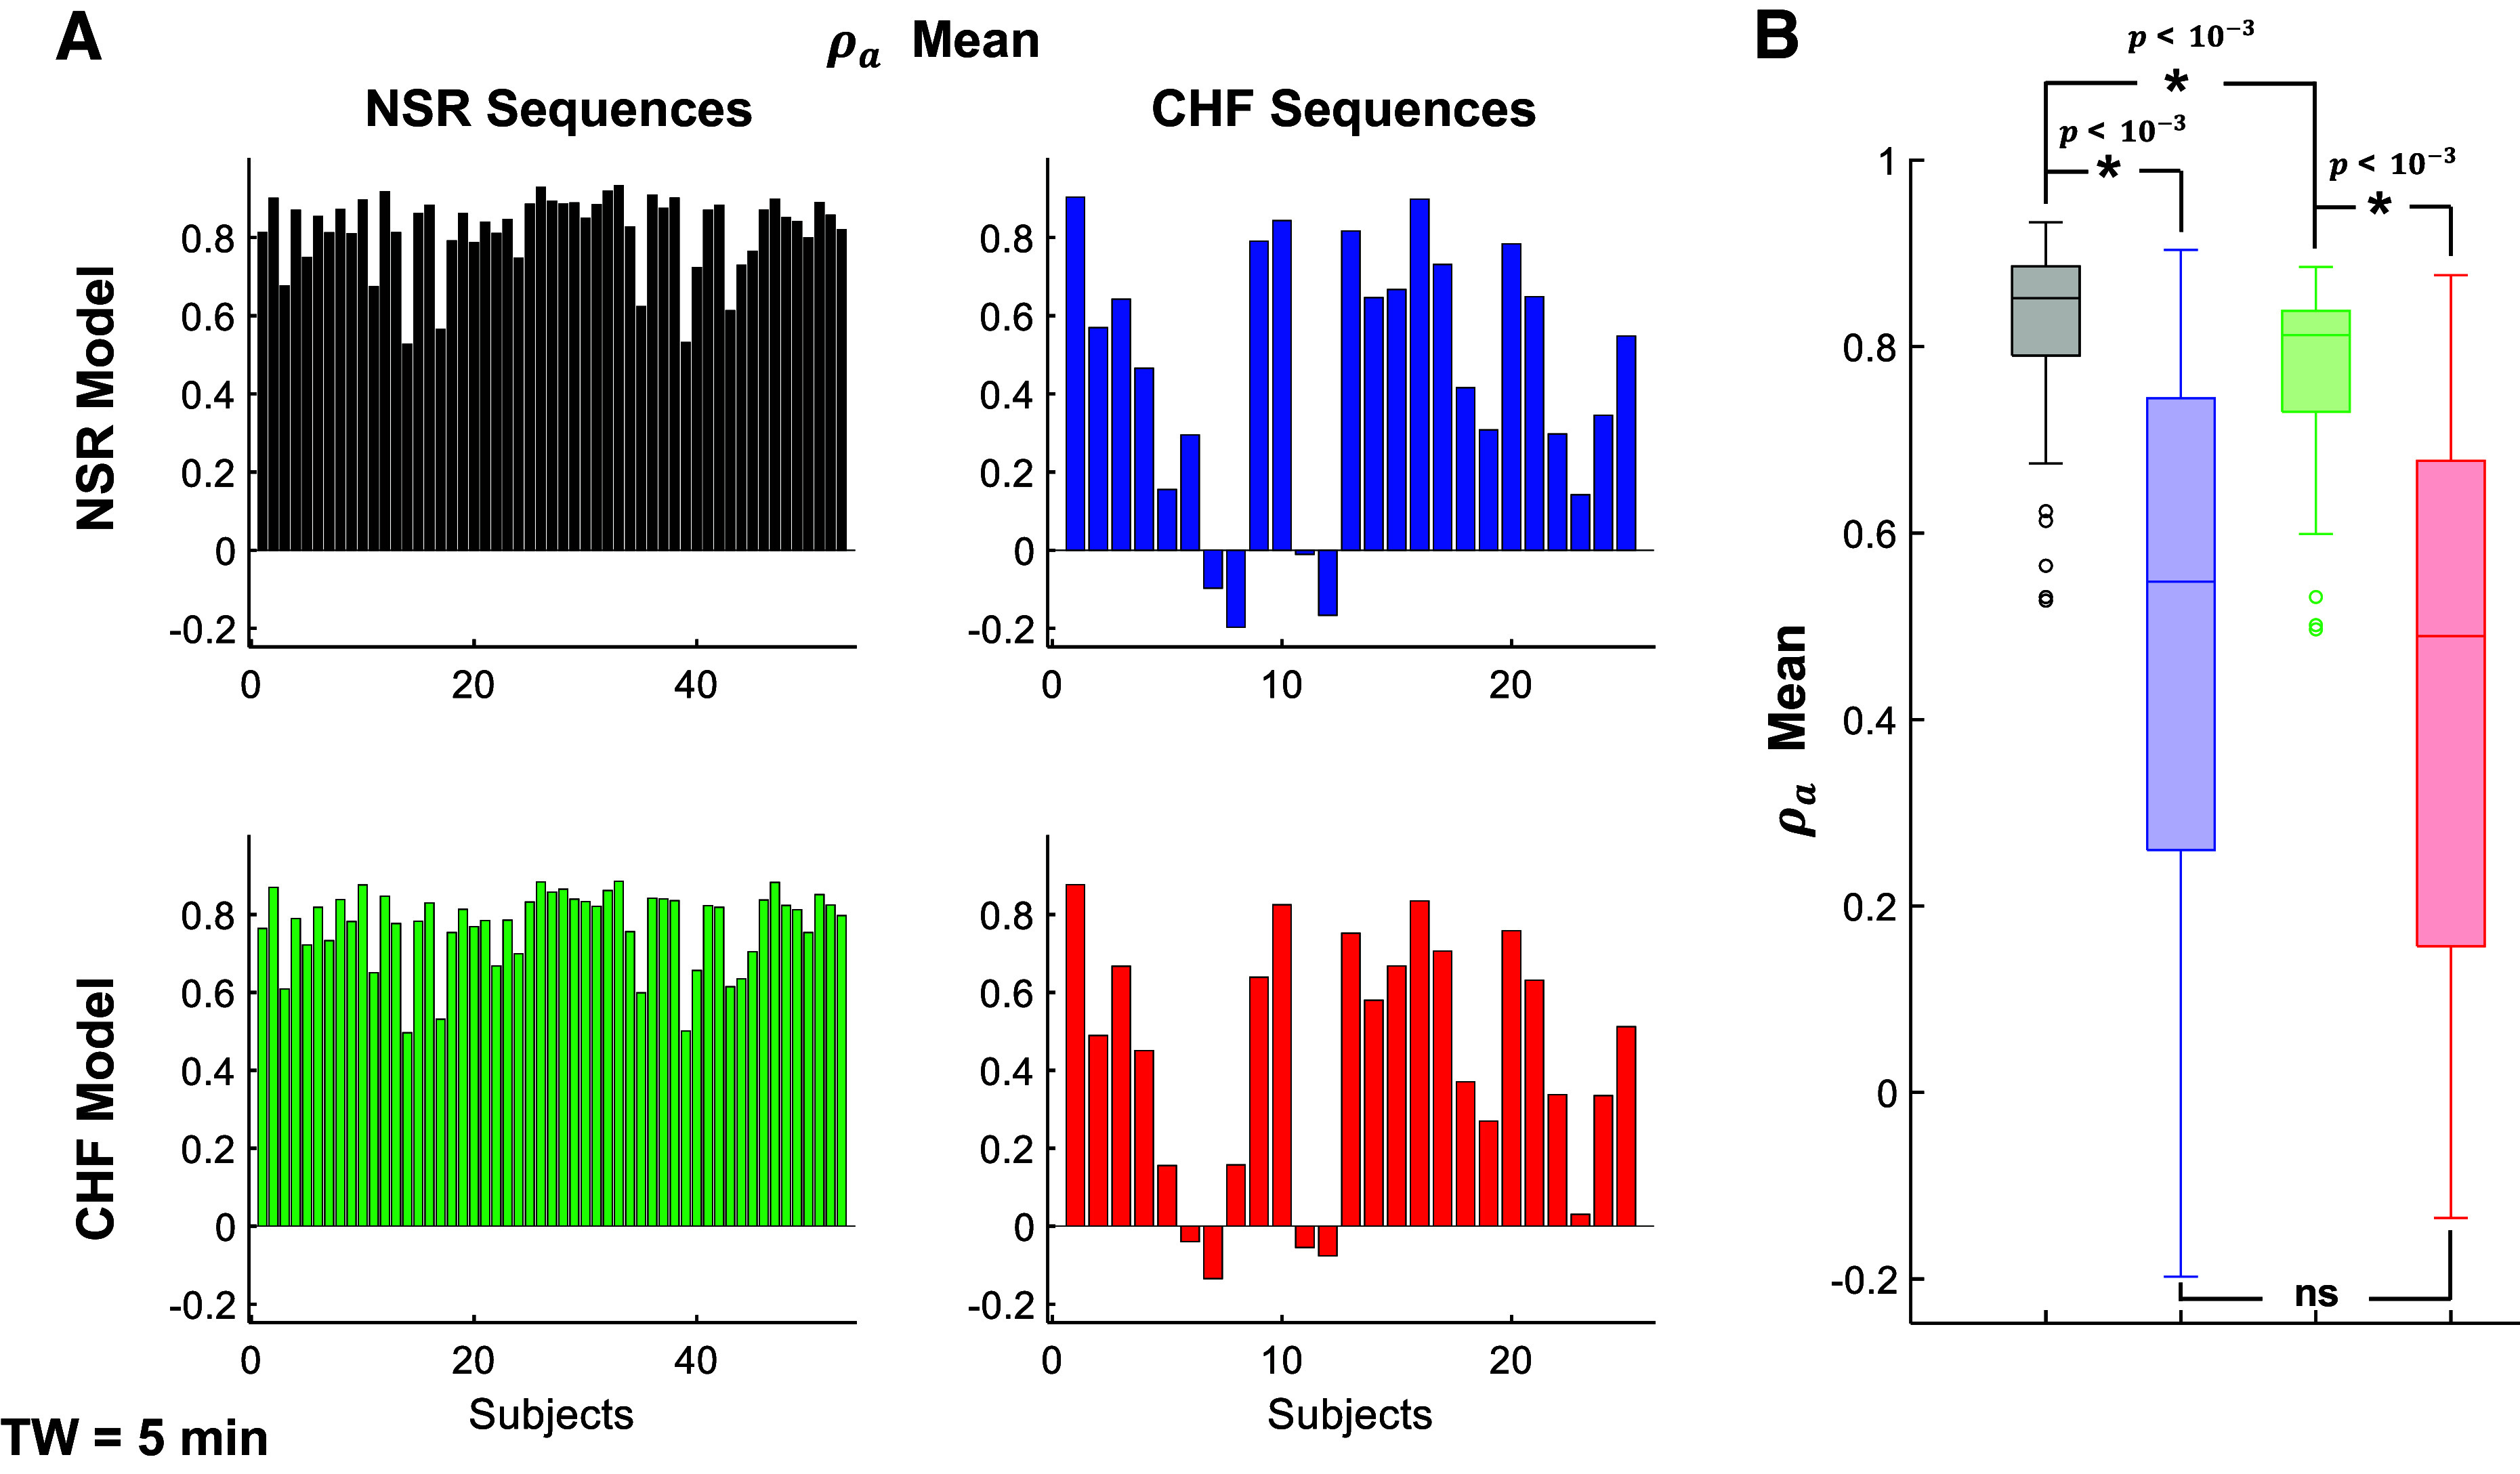
Individuals with chronic heart failure (CHF) have an increased risk of ventricular arrhythmias, which has been linked to pathological cellular remodeling and may also be mediated by changes in heart rate. Heart rate typically fluctuates on a timescale ranging from seconds to hours, termed heart rate variability (HRV). This variability is reduced in CHF, and this HRV reduction is associated with a greater risk for arrhythmias. Furthermore, variations in heart rate influence the formation of proarrhythmic alternans, a beat-to-beat alternation in the action potential duration (APD), or intracellular calcium (Ca). In this study, we investigate how long-term changes in heart rate and electrical remodeling associated with CHF influence alternans formation. We measure key statistical properties of the RR-interval sequences from ECGs of individuals with normal sinus rhythm (NSR) and CHF. Patient-specific RR-interval sequences and synthetic sequences (randomly generated to mimicking these statistical properties) are used as the pacing protocol for a discrete time-coupled map model that governs APD and intracellular Ca handling of a single cardiac myocyte, modified to account for pathological electrical remodeling in CHF. Patient-specific simulations show that beat-to-beat differences in APD vary temporally in both populations, with alternans formation more prevalent in CHF. Parameter studies using synthetic sequences demonstrate that increasing the autocorrelation time or mean RR-interval reduces APD alternations, whereas increasing the RR-interval standard deviation leads to higher alternans magnitudes. Importantly, we find that although both the CHF-associated changes in heart rate and electrical remodeling influence alternans formation, variations in heart rate may be more influential.NEW & NOTEWORTHY Using patient-specific data, we show that both the changes in heart rate and electrical remodeling associated with chronic heart failure influence the formation of proarrhythmic alternans in the heart.

Keywords: alternans; computational model; electrical remodeling; heart failure; heart rate variability.


Conflict of interest statement

No conflicts of interest, financial or otherwise, are declared by the authors.

Figures

Figure 1.
Figure 1.
Properties of an RR sequence vary temporally over 24 h and differ between an individual with normal sinus rhythm (NSR) and chronic heart failure (CHF). A: sequences of RR intervals from 24-h recordings for NSR subject 1 (black) and CHF subject 1 (red) are shown with the resulting RR-interval distributions. B: NSR and CHF subject distributions of the mean RR interval (μ), RR-interval standard deviation (σ), and autocorrelation time (τ), calculated from each 5-min time window (TW) of the 24-h sequences are displayed. The individuals’ RR interval, mean RR interval, and RR-interval standard deviation distributions are significantly different. *P < 10−3, unpaired t test.
Figure 2.
Figure 2.
RR-sequence statistical properties for the normal sinus rhythm (NSR; 53 subjects) and chronic heart failure (CHF; 25 subjects) populations. The CHF population tends to have a decreased mean of mean RR interval (i.e., faster rate), RR-interval standard deviation, and autocorrelation time, compared with the NSR population. The mean of each subject’s mean RR interval (μ, A), RR-interval standard deviation (σ, B), and autocorrelation time (τ, C) are plotted as a function of the time window (TW). Population-specific medians are denoted in red (CHF) and black (NSR). The mean of mean RR interval and RR-interval standard deviation are significantly shorter at all time windows (*P < 10−3), whereas the mean of autocorrelation time is significantly shorter at long time windows (*P < 10−2, right of the blue dashed line) in CHF, based on unpaired t tests.
Figure 3.
Figure 3.
RR intervals, action potential duration (APD), and peak Ca for normal sinus rhythm (NSR) and chronic heart failure (CHF) subjects. APD and peak Ca drift slowly in the NSR subject, whereas there are more dramatic beat-to-beat changes and transient alternans formation in the CHF subject. Traces of a 5-min RR sequence (top) and the corresponding APD (middle) and peak Ca (bottom) beat-to-beat values are depicted from NSR subject 1 (A) and CHF subject 12 (B). Time window (TW) = 5 min.
Figure 4.
Figure 4.
Chronic heart failure (CHF)-related remodeling and RR sequences alter the interplay between action potential duration (APD) and peak Ca, and the correlations between consecutive APD and peak Ca values. Scatter plots of APD vs. peak Ca (left), successive APD values (middle), and successive peak Ca values (right) are shown for the normal sinus rhythm (NSR) subject 1 (A) and CHF subject 12 (B) simulations depicted in Fig. 3. Blue dashed line is the line of equality. Time window (TW) = 5 min.
Figure 5.
Figure 5.
Action potential duration (APD) alternans formation is more prevalent in chronic heart failure (CHF). A: ΔAPD is shown for each 5-min segment of every 24-h RR sequence in both populations. B: temporal mean of ΔAPD and ρa is depicted for each subject in the normal sinus rhythm (NSR; black) and CHF (red) populations. The populations have a significantly different mean of ΔAPD and ρa (*P < 10−3, unpaired t tests). Time window (TW) = 5 min. ΔAPD, mean magnitude of the beat-to-beat difference in APD; ρa, correlation coefficient between successive beats of APD.
Figure 6.
Figure 6.
Varying the RR-sequence statistical properties leads to distinctly different synthetic sequences. RR-interval synthetic sequences are plotted as a function of beat number for different combinations of statistical properties, where two properties are the mean of the normal sinus rhythm (NSR) and chronic heart failure (CHF) population values and the third property is 50, 100, and 150% of its corresponding mean. Plots are shown for time windows (TWs) of 5 min (A) and 60 min (B).
Figure 7.
Figure 7.
Increasing μ and τ decreases action potential duration (APD) alternation, while increasing σ increases alternations in APD. ΔAPD is shown for five synthetic sequences (each bar) for different combinations of statistical properties, where τ (left), σ (middle), and μ (right) are broadly varied and the remaining two parameters are the population mean. The third normal sinus rhythm (NSR) and chronic heart failure (CHF) mean parameter value is shown in black and red, respectively. Results are shown for both the NSR (A) and CHF (B) models. Time window (TW) = 5 min.
Figure 8.
Figure 8.
The chronic heart failure (CHF) model leads to greater action potential duration (APD) alternations than the normal sinus rhythm (NSR) model for a specific synthetic sequence. A: ΔAPD value is plotted for different values of μ (x-axis), σ (y-axis), and τ (row) using the NSR (left) and CHF (middle) models. The mean NSR and CHF μ and σ are depicted in black and red circles, respectively. B: corresponding ratio of CHF to NSR ΔAPD is also shown. Time window (TW) = 5 min.
Figure 9.
Figure 9.
The synthetic sequences are more representative of the patient-specific change in action potential duration (ΔAPD) measurements than the Gaussian sequence, particularly at shorter time windows (TWs). For normal sinus rhythm (NSR) subject 30 (A, top) and chronic heart failure (CHF) subject 7 (B, top), ΔAPD is shown for each patient (P) sequence and five corresponding synthetic (S) and one Gaussian (G) sequences at a time window of 5 and 60 min. The median percent error between the patient ΔAPD and synthetic sequence ΔAPD mean is shown for each subject in both populations at different time windows (bottom).
Figure 10.
Figure 10.
The beat-to-beat changes in action potential duration (APD) and peak Ca primarily depend on the RR sequence, whereas the model phenotype influences the magnitude. A 5-min RR sequence from normal sinus rhythm (NSR) subject 1 (A and B) and chronic heart failure (CHF) subject 1 (C and D) are the pacing protocol for the NSR (A and C) and CHF (B and D) model. The RR interval and resulting APD and peak Ca are plotted as a function of beat number. Time window (TW) = 5 min.
Figure 11.
Figure 11.
Change in action potential duration (ΔAPD) primarily depends on the model phenotype, though the specific sequence leads to small differences in the alternation magnitudes. A: temporal mean of ΔAPD is shown for each subject in all four combination of population RR sequences and model phenotype: NSR sequences/normal sinus rhythm (NSR) model (black), chronic heart failure (CHF) sequences/NSR model (blue), NSR sequences/CHF model (green), and CHF sequences/CHF model (red). B: distribution of mean values for each simulated population is also shown. The model phenotype leads to significantly different mean ΔAPD values (*P < 10−3, paired t tests), whereas population RR sequences do not lead to significantly different mean ΔAPD values (ns, unpaired t tests). Time window (TW) = 5 min.
Figure 12.
Figure 12.
ρa mainly depends on the RR-interval populations, with moderate model phenotype influence. A: temporal mean of ρa is shown for each subject in all four combination of population RR sequences and model phenotype: normal sinus rhythm (NSR) sequences/NSR model (black), chronic heart failure (CHF) sequences/NSR model (blue), NSR sequences/CHF model (green), and CHF sequences/CHF model (red). B: distribution of mean values for each simulated population is also shown. The model phenotype leads to significantly different mean ρa values for the NSR sequences (*P < 10−3, paired t test), but not the CHF sequences (ns, paired t test), whereas the population RR sequence leads to statistically significant different mean ρa values for both NSR and CHF models (*P < 10−3, unpaired t tests). Time window (TW) = 5 min.

Similar articles

Cited by

References

    1. Roger VL. Epidemiology of heart failure. Circ Res 113: 646–659, 2013. doi:10.1161/CIRCRESAHA.113.300268. - DOI - PMC - PubMed
    1. Tsao CW, Aday AW, Almarzooq ZI, Alonso A, Beaton AZ, Bittencourt MS, Boehme AK, , et al. . Heart disease and stroke statistics—2022 update: a report from the American Heart Association. Circulation 145: e153–e639, 2022. [Erratum in Circulation 146: e141, 2022]. doi:10.1161/CIR.0000000000001052. - DOI - PubMed
    1. Saour B, Smith B, Yancy CW. Heart failure and sudden cardiac death. Card Electrophysiol Clin 9: 709–723, 2017. doi:10.1016/j.ccep.2017.07.010. - DOI - PubMed
    1. Kemp CD, Conte JV. The pathophysiology of heart failure. Cardiovasc Pathol 21: 365–371, 2012. doi:10.1016/j.carpath.2011.11.007. - DOI - PubMed
    1. Husti Z, Varró A, Baczkó I. Arrhythmogenic remodeling in the failing heart. Cells 10: 3203, 2021. doi:10.3390/cells10113203. - DOI - PMC - PubMed

Publication types

LinkOut - more resources