. 2023 Sep 1;325(3):H449-H467.
doi: 10.1152/ajpheart.00130.2023. Epub 2023 Jul 7.

Torsional and strain dysfunction precede overt heart failure in a mouse model of dilated cardiomyopathy pathogenesis

Affiliations

Torsional and strain dysfunction precede overt heart failure in a mouse model of dilated cardiomyopathy pathogenesis

Joshua B Holmes et al. Am J Physiol Heart Circ Physiol. .

Abstract

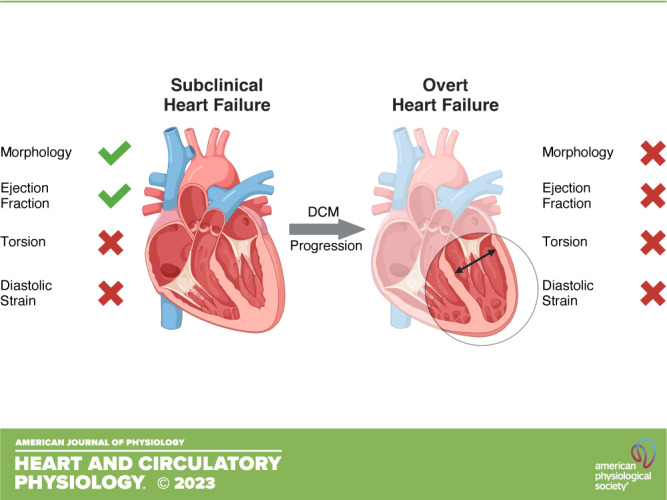
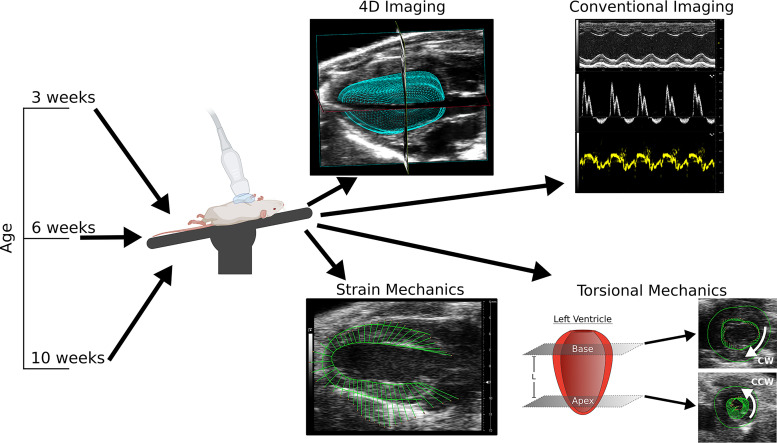
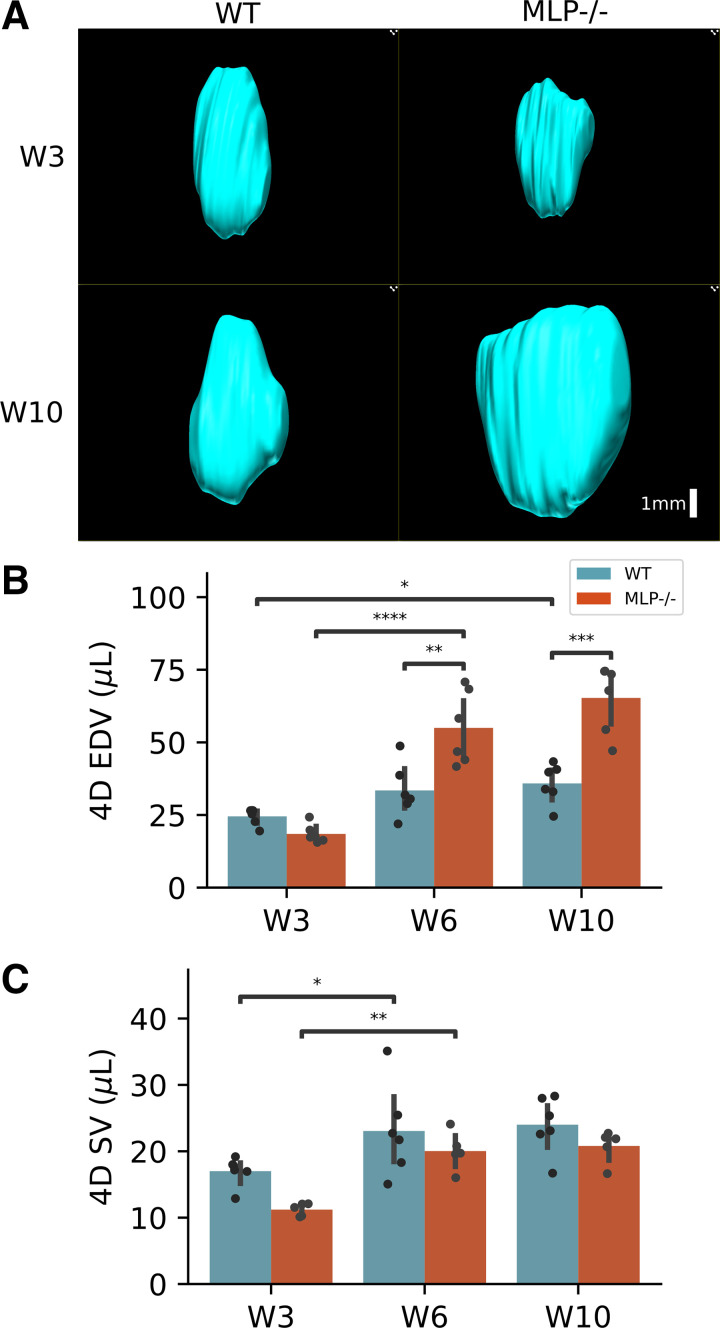
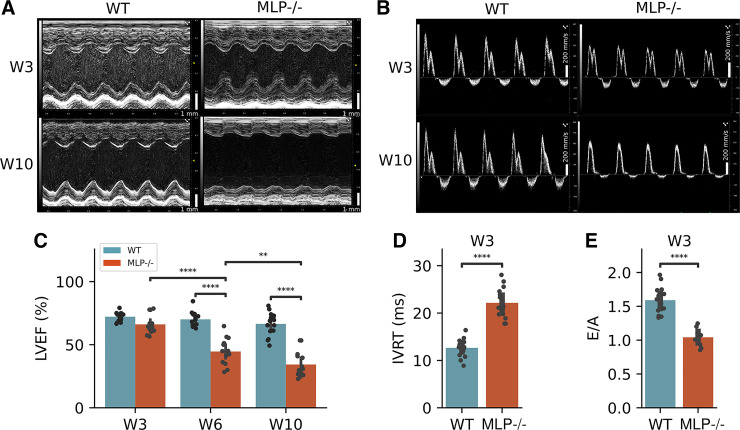
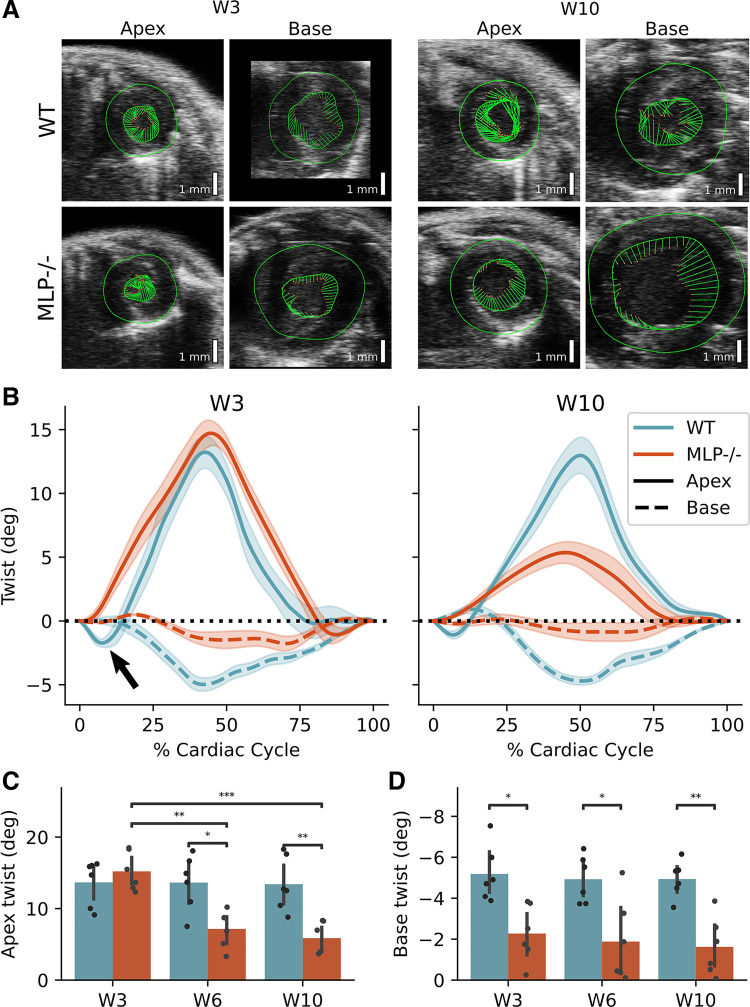
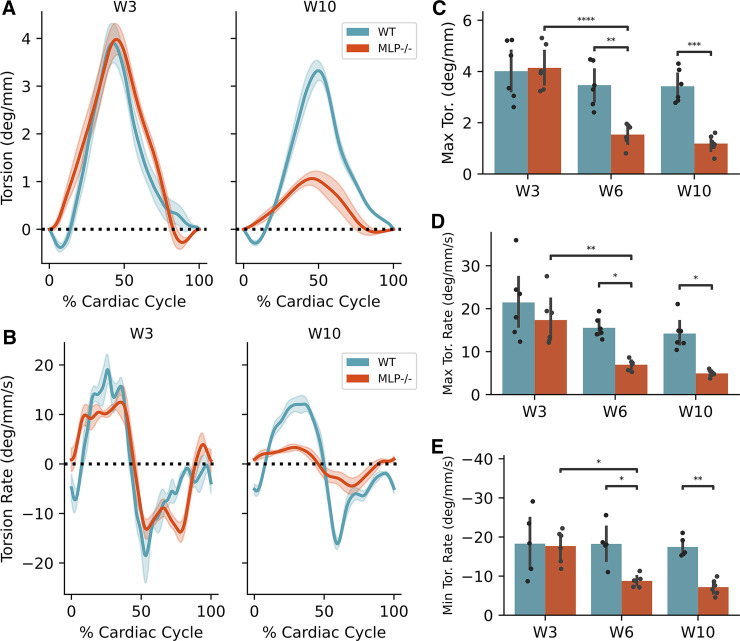
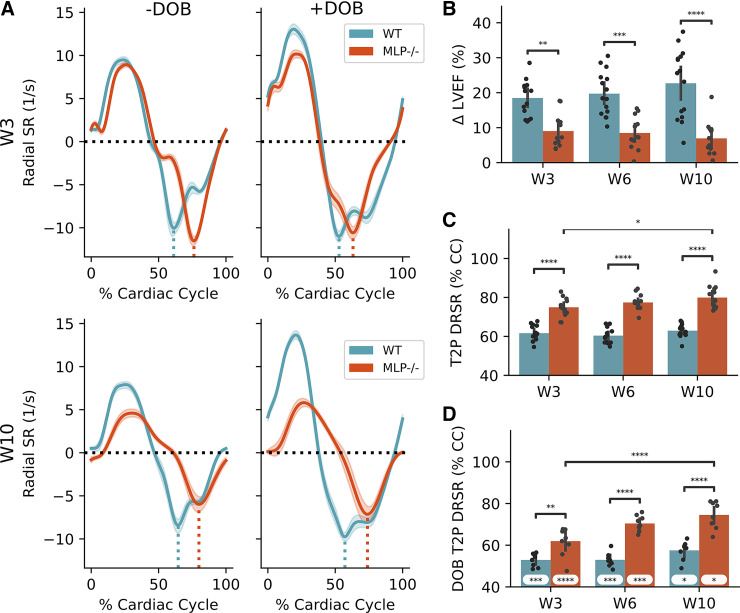
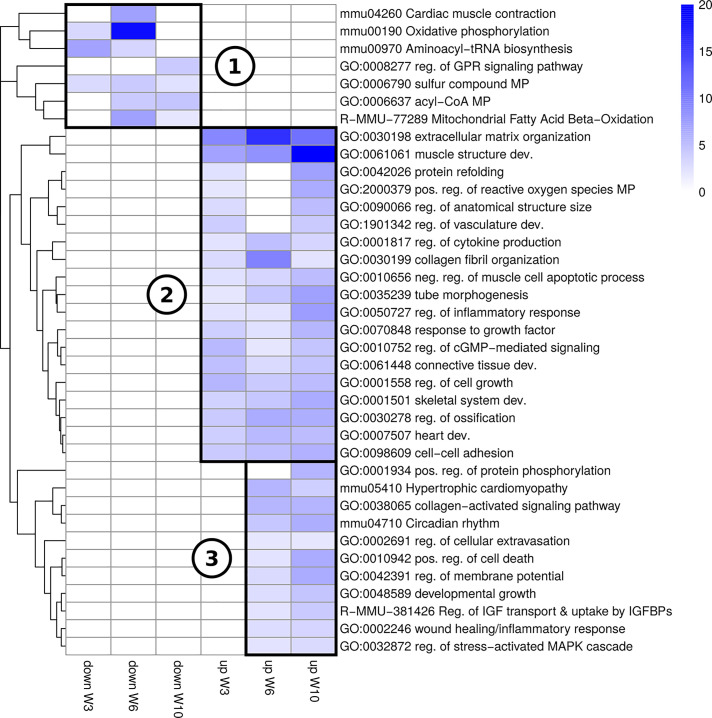
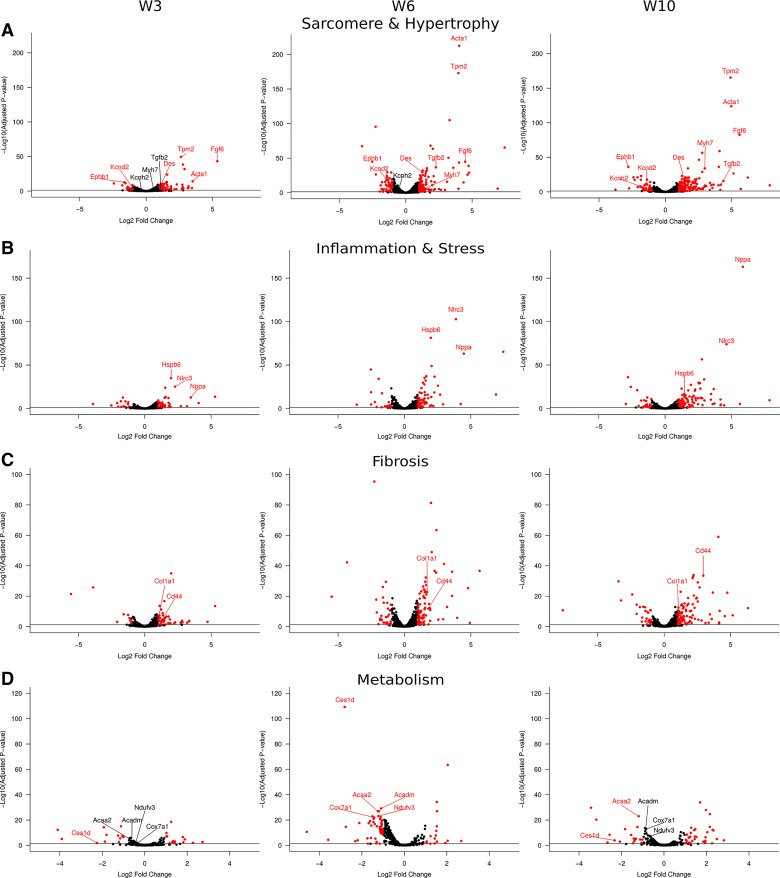
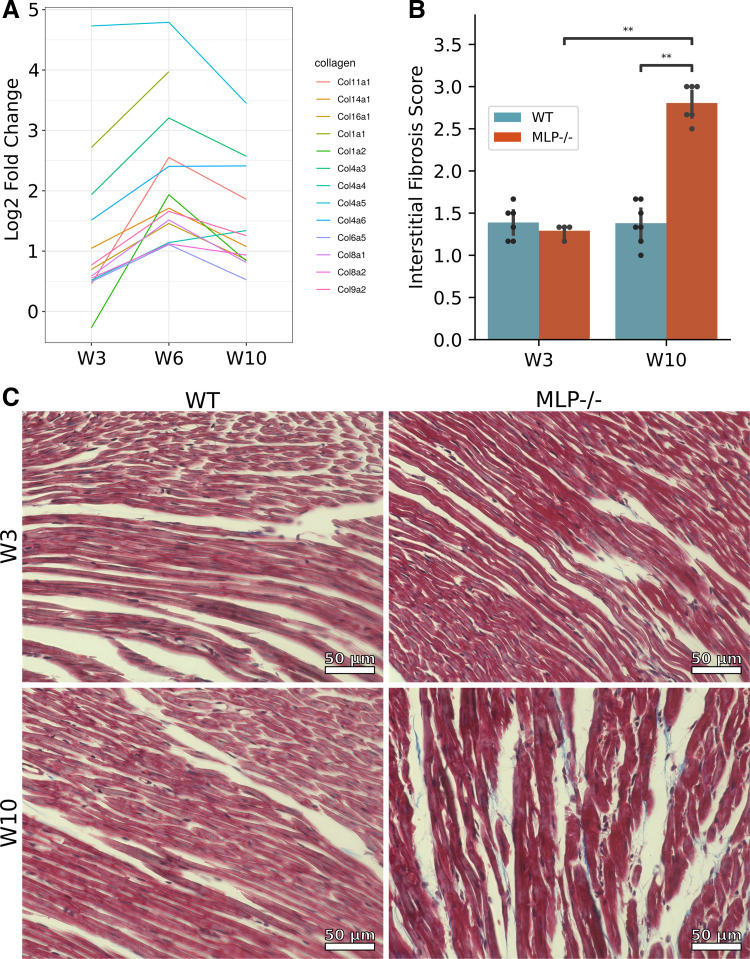
Detailed assessments of whole heart mechanics are crucial for understanding the consequences of sarcomere perturbations that lead to cardiomyopathy in mice. Echocardiography offers an accessible and cost-effective method of obtaining metrics of cardiac function, but the most routine imaging and analysis protocols might not identify subtle mechanical deficiencies. This study aims to use advanced echocardiography imaging and analysis techniques to identify previously unappreciated mechanical deficiencies in a mouse model of dilated cardiomyopathy (DCM) before the onset of overt systolic heart failure (HF). Mice lacking muscle LIM protein expression (MLP-/-) were used to model DCM-linked HF pathogenesis. Left ventricular (LV) function of MLP-/- and wild-type (WT) controls were studied at 3, 6, and 10 wk of age using conventional and four-dimensional (4-D) echocardiography, followed by speckle-tracking analysis to assess torsional and strain mechanics. Mice were also studied with RNA-seq. Although 3-wk-old MLP-/- mice showed normal LV ejection fraction (LVEF), these mice displayed abnormal torsional and strain mechanics alongside reduced β-adrenergic reserve. Transcriptome analysis showed that these defects preceded most molecular markers of HF. However, these markers became upregulated as MLP-/- mice aged and developed overt systolic dysfunction. These findings indicate that subtle deficiencies in LV mechanics, undetected by LVEF and conventional molecular markers, may act as pathogenic stimuli in DCM-linked HF. Using these analyses in future studies will further help connect in vitro measurements of the sarcomere function to whole heart function.NEW & NOTEWORTHY A detailed study of how perturbations to sarcomere proteins impact whole heart mechanics in mouse models is a major yet challenging step in furthering our understanding of cardiovascular pathophysiology. This study uses advanced echocardiographic imaging and analysis techniques to reveal previously unappreciated subclinical whole heart mechanical defects in a mouse model of cardiomyopathy. In doing so, it offers an accessible set of measurements for future studies to use when connecting sarcomere and whole heart function.

Keywords: cardiac mechanics; dilated cardiomyopathy; heart failure; muscle LIM protein; speckle-tracking echocardiography.


Conflict of interest statement

No conflicts of interest, financial or otherwise, are declared by the authors.

Figures

None
Graphical abstract
Figure 1.
Figure 1.
Cardiac ultrasound imaging techniques. Schematic representation of ultrasound techniques used for serial assessment of cardiac function in 3-, 6-, and 10-wk-old wild-type (WT) and muscle LIM protein expression-lacking (MLP−/−) mice. These included four-dimensional (4-D) imaging of the left ventricle (LV), conventional LV echocardiographic M-mode image of the LV short-axis (SAX) and flow/tissue-Doppler images at the mitral valve, speckle-tracking echocardiographic (STE) analysis of LV parasternal long-axis images to obtain strain mechanics, and STE analysis of SAX views of the LV base and apex, displaying clockwise (CW) and counterclockwise (CCW) rotation, respectively, to determine torsional mechanics.
Figure 2.
Figure 2.
Four-dimensional (4-D) left ventricular (LV) echocardiographic morphological analysis. A: representative images of LV reconstruction at peak diastole following 4-D image analysis of 3 (W3)- and 10 (W10)-wk-old wild-type (WT) and LIM protein expression-lacking (MLP−/−) mice. Scale bar is 1 mm. B and C: end-diastolic LV volumes (4-D Ved; B) and stroke volumes (4-D SV; C) as determined by 4-D image analysis for 3-, 6- (W6), and 10-wk-old WT and MLP−/− mice (n = 5 or 6). Statistical comparisons were made with a generalized linear model. Multiple comparison corrections were made with Tukey's method. *P < 0.05, **P < 0.01, ***P < 0.001, and ****P < 0.0001. EDV, end-diastolic volume.
Figure 3.
Figure 3.
Conventional left ventricular (LV) echocardiographic analysis. A and B: representative LV-LV short-axis (SAX) M-mode (scale bars = 1 mm; A) and mitral valve flow Doppler (scale bars = 200 mm/s; B) images for 3 (W3)- and 10 (W10)-wk-old wild-type (WT) and LIM protein expression-lacking (MLP−/−) mice. C: quantification of LV ejection fraction (LVEF) for 3-, 6 (W6)-, and 10-wk-old WT and MLP−/− mice (n = 14 or 15). Statistical comparisons were made with a generalized linear model. Multiple comparison corrections were made with Tukey’s method. D and E: isovolumic relaxation time (IVRT, n = 15; D) and the ratio of peak early and late diastolic filling velocities (E/A, n = 9–15; E) for 3-wk-old WT and MLP−/− mice. Statistical comparisons were made with Mann–Whitney U tests. **P < 0.01, and ****P < 0.0001.
Figure 4.
Figure 4.
Left ventricular (LV) twist mechanics. A: representative short-axis images of the apex and base during systole for wild-type (WT) and LIM protein expression-lacking (MLP−/−) hearts at 3 (W3) and 10 (W10) wk of age. Green vectors represent velocity of the endocardial wall showing the counterclockwise and clockwise twist of the apex and base, respectively. Scale bars = 1 mm. B: average apical (solid) and basal (dashed) twist curves for 3 (W3)- and 10 (W10)-wk-old WT and MLP−/− mice (n = 6). Curves are represented as group averages ± SE as a function of percent cardiac cycle beginning at end diastole. Black arrow indicates preejection apical clockwise twist. C and D: quantification of maximum apical (C) and basal (D) twist deflections for 3-, 6 (W6)-, and 10-wk-old WT and MLP−/− mice (n = 6). Positive twist values indicate counterclockwise deflections. Statistical comparisons were made with a generalized linear model. Multiple comparison corrections were made with Tukey’s method. *P < 0.05, **P < 0.01, and ***P < 0.001.
Figure 5.
Figure 5.
Left ventricular (LV) torsion mechanics. A and B: average torsion (A) and torsion rate (B) curves for 3 (W3)- and 10 (W10)-wk-old wild-type (WT) and LIM protein expression-lacking (MLP−/−) mice (n = 6). Curves are represented as group averages ± SE as a function of percent cardiac cycle beginning at end diastole. C–E: quantification of maximum torsion (C), maximum torsion rate (D), and minimum torsion rate (E) (n = 5 or 6). Positive torsion values indicate counterclockwise deflections. Statistical comparisons were made with a generalized linear model. Multiple comparison corrections were made with Tukey’s method. *P < 0.05, **P < 0.01, ***P < 0.001, and ****P < 0.0001.
Figure 6.
Figure 6.
Left ventricular (LV) strain mechanics and β-adrenergic reserve. A: average radial strain rate (SR) curves before and after dobutamine injection (−Dob and +Dob, respectively) for 3 (W3)- and 10 (W10)-wk-old wild-type (WT) and LIM protein expression-lacking (MLP−/−) mice (n = 14). Curves are represented as group averages ± SE as a function of percent cardiac cycle (CC) beginning at end diastole. Vertical dotted lines indicate time to peak diastolic radial strain rate (T2P DRSR). B–D: quantification of the difference in LV ejection fraction between baseline and following dobutamine injection (ΔLVEF, n = 12–14; B), time to peak diastolic radial strain rate (T2P DRSR) before Dob injection (n = 14; C), and T2P DRSR after dobutamine injection (n = 10; D). Statistical significance markers in the white boxes of D indicate differences between the corresponding baseline group in C. Statistical comparisons between time-points and groups were made with a generalized linear model. Multiple comparison corrections were made with Tukey’s method. Statistical comparisons between pre- and post-dobutamie groups were made with Mann–Whitney U tests. *P < 0.05, **P < 0.01, ***P < 0.001, and ****P < 0.0001.
Figure 7.
Figure 7.
Gene ontology enrichment analysis. Heatmap of enriched gene ontology terms in 3 (W3)-, 6 (W6)-, and 10 (W10)-wk-old LIM protein expression-lacking (MLP−/−) vs. wild-type (WT) mice. Terms were further separated based on down- or upregulation. Color intensity indicates −log10 of adjusted P values. Terms were clustered according to the Canberra distance metric where 3 primary grouping were identified: 1) those downregulated in MLP−/− mice, 2) those upregulated in 3-wk-old MLP−/− mice, and 3) those not upregulated in 3-wk-old MLP−/− mice.
Figure 8.
Figure 8.
Differentially expressed genes according to functional grouping. A–D: volcano plots of genes related to sarcomere and hypertrophy (A), inflammation and stress (B), fibrosis (C), or metabolism (D) for 3 (W3)-, 6 (W6)-, and 10 (W10)-wk-old mice. See methods for a list of gene oncology (GO) terms contributing to each plot. Positive log2 fold change values indicate upregulation in LIM protein expression-lacking (MLP−/−) vs. wild-type (WT) mice. Red dots with red labels represent differentially expressed genes (log2 fold change >1 or <−1, and adjusted P value < 0.05), while black dots with black labels represent statistically similar genes.
Figure 9.
Figure 9.
Left ventricular (LV) collagen expression and fibrosis. A: line-plot tracking the log2 fold change of 13 collagen genes in 3 (W3)-, 6 (W6)-, and 10 (W10)-wk-old male LIM protein expression-lacking (MLP−/−) mice compared with age-matched male wild-type (WT) mice (n = 3). B: histological score (1–4) of interstitial fibrosis severity from both male and female mice from Masson’s trichrome-stained LV short-axis sections (n = 4–7). Scores for each heart are averaged from 3 doubly blinded investigators. C: representative Masson’s trichrome-stained LV short-axis sections of W3 and W10 WT and MLP−/− hearts. Collagen is stained blue, muscle cells are stained red, nuclei are stained dark brown. Scale bars = 50 μm. Statistical comparisons were made with a Kruskal-Wallis test. **P < 0.01.

Similar articles

Cited by

References

    1. Savarese G, Becher PM, Lund LH, Seferovic P, Rosano GMC, Coats AJS. Global burden of heart failure: a comprehensive and updated review of epidemiology. Cardiovasc Res 118: 3272–3287, 2023. [Erratum in Cardiovasc Res 119: 1453, 2023]. doi:10.1093/cvr/cvac013. - DOI - PubMed
    1. Ahmad T, Miller PE, McCullough M, Desai NR, Riello R, Psotka M, Böhm M, Allen LA, Teerlink JR, Rosano GMC, Lindenfeld J. Why has positive inotropy failed in chronic heart failure? Lessons from prior inotrope trials. Eur J Heart Fail 21: 1064–1078, 2019. doi:10.1002/ejhf.1557. - DOI - PMC - PubMed
    1. Gomes AC, Falcão-Pires I, Pires AL, Brás-Silva C, Leite-Moreira AF. Rodent models of heart failure: an updated review. Heart Fail Rev 18: 219–249, 2013. doi:10.1007/s10741-012-9305-3. - DOI - PubMed
    1. Arber S, Hunter JJ, Ross J, Hongo M, Sansig G, Borg J, Perriard J-C, Chien KR, Caroni P. MLP-deficient mice exhibit a disruption of cardiac cytoarchitectural organization, dilated cardiomyopathy, and heart failure. Cell 88: 393–403, 1997. doi:10.1016/s0092-8674(00)81878-4. - DOI - PubMed
    1. Arber S, Halder G, Caroni P. Muscle LIM protein, a novel essential regulator of myogenesis, promotes myogenic differentiation. Cell 79: 221–231, 1994. doi:10.1016/0092-8674(94)90192-9. - DOI - PubMed

Publication types

MeSH terms

LinkOut - more resources