. 2023 Jul 7;18(7):e0288114.
doi: 10.1371/journal.pone.0288114. eCollection 2023.

Altered growth and death in dilution-based viral predation assays

Affiliations

Altered growth and death in dilution-based viral predation assays

Ben Knowles et al. PLoS One. .

Abstract

Viral lysis of phytoplankton is one of the most common forms of death on Earth. Building on an assay used extensively to assess rates of phytoplankton loss to predation by grazers, lysis rates are increasingly quantified through dilution-based techniques. In this approach, dilution of viruses and hosts are expected to reduce infection rates and thus increase host net growth rates (i.e., accumulation rates). The difference between diluted and undiluted host growth rates is interpreted as a measurable proxy for the rate of viral lytic death. These assays are usually conducted in volumes ≥ 1 L. To increase throughput, we implemented a miniaturized, high-throughput, high-replication, flow cytometric microplate dilution assay to measure viral lysis in environmental samples sourced from a suburban pond and the North Atlantic Ocean. The most notable outcome we observed was a decline in phytoplankton densities that was exacerbated by dilution, instead of the increased growth rates expected from lowered virus-phytoplankton encounters. We sought to explain this counterintuitive outcome using theoretical, environmental, and experimental analyses. Our study shows that, while die-offs could be partly explained by a 'plate effect' due to small incubation volumes and cells adhering to walls, the declines in phytoplankton densities are not volume-dependent. Rather, they are driven by many density- and physiology-dependent effects of dilution on predation pressure, nutrient limitation, and growth, all of which violate the original assumptions of dilution assays. As these effects are volume-independent, these processes likely occur in all dilution assays that our analyses show to be remarkably sensitive to dilution-altered phytoplankton growth and insensitive to actual predation pressure. Incorporating altered growth as well as predation, we present a logical framework that categorizes locations by the relative dominance of these mechanisms, with general applicability to dilution-based assays.


Conflict of interest statement

The authors have declared that no competing interests exist.

Figures

Fig 1
Fig 1. The logical structure of the project.
We combined existing laboratory microtiter plate and field dilutions-based assays (“Background’, blue text and boxes) to make a new high-throughput viral predation assay, based on the assumptions based on established approaches (‘Assumptions’; light blue) that were either met or not (‘Observations’; pink). Violated assumptions then led us to experimentally and theoretically examine a range of possible explanations (‘Explanations examined’; red).
Fig 2
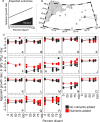
Fig 2. Expected outcomes, field site locations, and empirical data from microtiter dilution assays.
(a) Idealized expected results from dilution assays where phytoplankton apparent growth rates increase as viruses are diluted. (b) The distribution of experiments across New Jersey, the Sargasso Sea/Gulf Stream, sub-tropical North Atlantic, and temperate North Atlantic. (c) AGRs across dilution in each experiment are shown with or without nutrients (red and black data points and linear lines of best fit, respectively). n = 4 for Experiments A–E (each panel shows 32 data points), n = 3 for experiments F–O (each panel shows 24 data points), and n = 6 for experiments P and Q (each panel shows 48 data points). Apparent growth rates are the change in phytoplankton densities over 24 hours; AGR = ln (Pt/P0) / day, where Pt and P0 are the number of phytoplankton cells per mL at the end and start of the incubation period, respectively. Maps in panel (b) were made using the m_maps package in Matlab [68] with publicly-available chlorophyll data from the NASA Ocean Biology Processing Group (https://earthdata.nasa.gov/).
Fig 3
Fig 3. Apparent growth rates in undiluted samples and lysis rates in microtiter dilution assays.
(a) Apparent growth rates in undiluted samples (the 0% diluent values in Fig 2C, shown ± 95% confidence intervals of the mean; AGRs are the change in phytoplankton densities over 24 hours; AGR = ln (Pt/P0) / day, where Pt and P0 are the number of phytoplankton cells per mL at the end and start of the incubation period, respectively). (b) Calculated lysis rates (slopes; the change in AGR across dilutions shown ± 95% confidence intervals of the slope). Both (a) and (b) show outcomes of larger 1 L volume incubations that shared the same diluents and site water as the microtiter experiments (circles). Experiments are color-coded by site water mass and divided by vertical lines. Data points are colored by nutrient addition with and without nutrients added (red and black data points and confidence intervals, respectively).
Fig 4
Fig 4. Small incubation volumes alone are not responsible for highly negative apparent growth rates or decreasing phytoplankton growth with dilution.
(a) Spatially-explicit modeling of swimming and non-motile phytoplankton (open and black circle, respectively) calculated apparent growth rates after accommodating wall encounters in different-sized containers. (b) The lack of effect of dilution on the apparent growth rate of swimming and non-motile phytoplankton in 200 μL incubations (predicted lysis rate = 0). Non-motile random Brownian diffusion and random swimming were modeled with diffusion coefficients of 0.1 and 10 μm2 per second, respectively. Note the broken x-axis in (b) to compare microtiter plate and 1000 mL (i.e., 1L) incubations.
Fig 5
Fig 5. Viral reproduction can yield positive to negative slopes over time in the dilution assay.
Model predictions of (a) phytoplankton and (b) viral densities over time (incubation time; tinc) across a range of dilutions (80%, 40%, and 0% diluent treatments are shown as black, grey, and open white circles, respectively). Changing predator densities allows growth rates to change from positive to negative in any dilution (see dashed lines in panel (a) for how AGRs can change signs if measured between t0 and t1 vs. t0 and t8). Panels (c) and (d) show changes in AGR values over time for each dilution of phytoplankton and viruses, respectively, which then (e) results in changing lysis rates. This model was parameterized by the E. huxleyi-EhV system [62].
Fig 6
Fig 6. Dilution-induced lag violates a fundamental assumption of the dilution assay by modifying phytoplankton growth.
(a) Dunaliella tertiolecta dilution series in cultures without predators show negative slopes due to dilution-induced lagged growth. Emiliania huxelyi suspended in artificial media devoid of inhibitors or predators in (b) 200 μL microtiter plate and (c) 40 mL flask incubations also show negative slopes (i.e., negative ‘lysis rates). (d) E. huxelyi cultures with initial viral densities of 100 ‘extinct’ - 107 viruses per mL also show negative slopes, with viral predation lowering the AGRs in cultures only at viral and phytoplankton densities (> 106 viruses and cells per mL; c.f., viral and E. huxleyi densities of < 105 and 104 per mL in nature; [62]). Data points are colored by nutrient addition with and without nutrients added (red and black data points, respectively). Apparent growth rates are the change in phytoplankton densities over 24 hours; AGR = ln (Pt/P0) / day, where Pt and P0 are the number of phytoplankton cells per mL at the end and start of the incubation period, respectively.
Fig 7
Fig 7. Schematic of growth and death processes operating within the dilution assay that can result in positive or negative slopes.
Predation (red arrows) being reduced by dilution can lead to (a) positive slopes under the idealized dilution assay dynamics or (b) negative slopes if changing predation pressure occurs (solid and dotted arrows show predation pressure at the start and end of incubations, respectively). Factors suppressing growth (blue arrows) can lead to (c) positive slopes by dilution alleviating extreme nutrient limitation or (d) negative slopes by inducing lagged phytoplankton growth with dilution. Processes are not mutually exclusive in any given sample, and slopes observed for any sample may reflect the balance of these processes all operating.
Fig 8
Fig 8. Logically binning sites into predation-dominated, high-tempo with predator growth, nutrient-limited, and lag-sensitive.
(a) A dichotomous key to categorize sites as dominated by predation (pink circles), subject to changing predation pressure (deemed unlikely to occur in our experiments), nutrient-limited (red rings), or dilution-induced lagged phytoplankton growth (blue circles) based on whether growth rate increases or declines with dilution (positive or negative slopes, respectively) and response to nutrient addition. (b) The field study locations classified using this logic. Maps in panel (b) were made using the m_maps package in Matlab [68] with publicly-available chlorophyll data from the NASA Ocean Biology Processing Group (https://earthdata.nasa.gov/). Grey shading shows surface chlorophyll concentrations (mg per m3) in the North Atlantic during the sampling period.

Similar articles

References

    1. Thingstad TF. Elements of a theory for the mechanisms controlling abundance, diversity, and biogeochemical role of lytic bacterial viruses in aquatic systems. Limnol Oceanogr. 2000;45: 1320–1328.
    1. Rodriguez-Brito B, Li L, Wegley L, Furlan M, Angly F, Breitbart M, et al.. Viral and microbial community dynamics in four aquatic environments. ISME J. 2010;4: 739–751. doi: 10.1038/ismej.2010.1 - DOI - PubMed
    1. Record NR, Talmy D, Våge S. Quantifying Tradeoffs for Marine Viruses. Frontiers in Marine Science. 2016. p. 251.
    1. Pourhasanzade F, Iyer S, Tjendra J, Landor L, Våge S. Individual-based model highlights the importance of trade-offs for virus-host population dynamics and long-term coexistence. PLoS Comput Biol. 2022;18: e1010228. doi: 10.1371/journal.pcbi.1010228 - DOI - PMC - PubMed
    1. Tjendra J, Storesund JE, Dahle H, Sandaa RA, Våge S. Molecular evidence of parallel evolution in a cyanophage. PLoS One. 2023;18: e0281537. doi: 10.1371/journal.pone.0281537 - DOI - PMC - PubMed