. 2023 Jul 7;9(27):eadg4156.
doi: 10.1126/sciadv.adg4156. Epub 2023 Jul 7.

Prior expectation enhances sensorimotor behavior by modulating population tuning and subspace activity in sensory cortex

Affiliations

Prior expectation enhances sensorimotor behavior by modulating population tuning and subspace activity in sensory cortex

JeongJun Park et al. Sci Adv. .

Abstract

Prior knowledge facilitates our perception and goal-directed behaviors, particularly when sensory input is lacking or noisy. However, the neural mechanisms underlying the improvement in sensorimotor behavior by prior expectations remain unknown. In this study, we examine the neural activity in the middle temporal (MT) area of visual cortex while monkeys perform a smooth pursuit eye movement task with prior expectation of the visual target's motion direction. Prior expectations discriminately reduce the MT neural responses depending on their preferred directions, when the sensory evidence is weak. This response reduction effectively sharpens neural population direction tuning. Simulations with a realistic MT population demonstrate that sharpening the tuning can explain the biases and variabilities in smooth pursuit, suggesting that neural computations in the sensory area alone can underpin the integration of prior knowledge and sensory evidence. State-space analysis further supports this by revealing neural signals of prior expectations in the MT population activity that correlate with behavioral changes.


Figures

Fig. 1.
Fig. 1.. Experimental design and task performance.
(A) Trial timeline: Each trial begins with monkeys focusing on a central point on the monitor. A random-dot kinematogram then appears, either centrally or off-center, with dots moving in a target direction for 100 ms within an invisible area. The dot patch proceeds to move in the same direction for 500 to 700 ms, while monkeys maintain gaze on the moving patch. The initial fixation duration is randomized at 800, 1300, or 1800 ms. (B) Block design: Each block has different target direction distributions and proportions. Both blocks share a prior direction, with angles between that direction and others being 120° and 15° in the wide and narrow prior blocks, respectively. The number of trials for the prior direction equals that of other directions in the wide prior block but doubles in the narrow prior block. Wide and narrow prior blocks are denoted by red and green fixation points, respectively. (C) Stimulus type: Two random-dot patch types are randomly interleaved. High-contrast stimuli have 100% luminance contrast and dot coherence, while low-contrast stimuli have 12% (monkey A) or 8% (monkey B) luminance contrast and random-walk noise in dot motion. (D and E) Mean SD of pursuit directions for prior direction targets: Black and red bars represent mean SD for high-contrast targets in wide and narrow prior blocks, while gray and yellow bars indicate mean SD for low-contrast targets in the respective blocks. Error bars denote standard error of the mean (SEM). ***P < 0.0005.
Fig. 2.
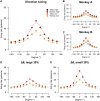
Fig. 2.. Effect of prior expectation on the firing rate of MT neurons.
(A to C) Each colored PSTH shows the firing rate of the MT neurons for the prior direction as a function of time relative to the local motion onset in each condition (black: wide prior, high contrast; red: narrow prior, high contrast; gray: wide prior, low contrast; yellow: narrow prior, low contrast). The bar graphs show the mean firing rates during the initial 100-ms time window from the spike latency. *P < 0.05. (D to F) Correlation between the difference in the prior and preferred directions (Δθ) and the firing rate ratios (FR ratios) in the narrow prior block to that in the wide prior block. The lines show the correlation coefficient over time relative to the local motion onset with a ±30-ms window and 5-ms timestep; the red, blue, and black lines are from monkey A, monkey B, and the combined dataset of monkeys A and B, respectively. (G to I) Correlation between Δθ and FR ratio in the time window of 55 to 115 ms from the local motion onset in the combined dataset. Each point in the plot represents one MT neuron. The black solid lines show the linear regression between Δθ and the log FR ratio. (C, F, and I) The MT neuronal responses for low-contrast stimuli on the days where the SD in the pursuit directions in the narrow prior block are significantly smaller than those in wide prior block and the responses on the other days with no significant difference in the SD between the two prior blocks.
Fig. 3.
Fig. 3.. In silico simulations to decode population direction information.
(A) Schematic of population tuning curve change in area MT by prior expectation: Black and red curves display the population direction tuning of model MT neurons in wide and narrow prior blocks when the target and prior directions are both 0°. When sensory evidence is weak, prior expectations proportionally reduce MT neuronal responses according to the difference between the prior direction and each neuron’s preferred direction, sharpening the population tuning curve. (B and C) Examples of simulated MT population responses: Thin lines represent the firing rate of each model neuron in a single trial under high/low-contrast and wide/narrow prior conditions. Thick curves depict mean population responses across trials. (D) Support vector machine (SVM) performance: SVM’s ability to discriminate between two directions as a function of direction difference (Δθ) is shown by colored circles fitted to a cumulative Gaussian function (dot-dashed line). (E and F) Estimation of direction SD ratio: The ratio between narrow and wide prior blocks in experimental and simulated data is represented by gray circles for individual sessions’ smooth pursuit directions in the two monkeys, and black circles for the mean SD ratios. Black lines show the SD of black circles. Light red crosses indicate the SD ratio estimated from population responses in each simulation using a population vector decoder (PVD) (F, left) or maximum likelihood estimation method (F, right), with thick red crosses representing the mean SD ratio.
Fig. 4.
Fig. 4.. Direction tuning responses of MT neurons in passive fixation task.
(A) Mean direction tuning across all MT neurons in the combined data from the two monkeys. The direction tuning responses of individual neurons are realigned relative to each neuron’s preferred directions (filled circles) and fitted to a Gaussian function (dash-dotted lines). (B and C) Mean direction tuning of MT neurons in each monkey. (D and E) Mean direction tuning of top and bottom 30% neurons based on the size of the difference between each neuron’s preferred direction and prior direction in the combined data.
Fig. 5.
Fig. 5.. Latent dynamics of MT population responses during pursuit and fixation task.
(A and D) PSTHs relative to the local motion onset and mean spontaneous activities of the recorded MT neurons (inset), in each prior block during the pursuit task (A) and fixation task (D). (B and E) Autocorrelation matrix of regression coefficients for prior blocks during the pursuit task (B) and fixation task (E). (C and F) Temporal trajectories of average population responses in the task-related subspace consisting of prior and contrast axes during the pursuit task (C) and fixation task (F). Trajectories of sponteneous activity (−400 to 0 ms in the pursuit task and −100 to 0 ms in the fixation task) are shown in the inset plots, and dash-dotted lines highlighted these duration. (G) SDs of pursuit directions with high-contrast (left) and low-contrast (right) stimuli as a function of time relative to the local motion onset. The red and yellow thick lines indicate that the SD differences between the two blocks are significant [cluster-based permutation test (37), 10,000 permutations, P < 0.05]. (H) Differences in the population responses projected on the prior axis of the subspace between the wide and narrow prior blocks as a function of time (solid lines), and the differences of the pursuit direction SDs between the two priors as a function of time (dashed lines). The blue and magenta lines indicate the high- and low-contrast conditions, respectively. Temporal coherences between the subspace differences and SD differences with different latencies of the SD differences from the subspace differences are shown in the inset plots. The thick top line in the inset indicates that the FDR-corrected P-values are less than 0.05. (I) Differences in the prior axis–projected population responses between the two prior blocks during the fixation task (averaged across 12 motion direction conditions).

Similar articles

Cited by

References

    1. A. A. Stocker, E. P. Simoncelli, Noise characteristics and prior expectations in human visual speed perception. Nat. Neurosci. 9, 578–585 (2006). - PubMed
    1. W. J. Ma, Organizing probabilistic models of perception. Trends Cogn. Sci. 16, 511–518 (2012). - PubMed
    1. L.-Q. Zhang, A. Stocker, Psychophysically estimated low-speed prior expectations match the encoding characteristics of neurons in area MT. J. Vis. 21, 2012 (2021).
    1. L. Q. Zhang, A. A. Stocker, Prior expectations in visual speed perception predict encoding characteristics of neurons in area MT. J. Neurosci. 42, 2951–2962 (2022). - PMC - PubMed
    1. D. E. Angelaki, Y. Gu, G. C. DeAngelis, Multisensory integration: Psychophysics, neurophysiology, and computation. Curr. Opin. Neurobiol. 19, 452–458 (2009). - PMC - PubMed