. 2023 Jul 7;9(27):eadg2252.
doi: 10.1126/sciadv.adg2252. Epub 2023 Jul 7.

Peripheral nerves directly mediate the transneuronal translocation of silver nanomaterials from the gut to central nervous system

Affiliations

Peripheral nerves directly mediate the transneuronal translocation of silver nanomaterials from the gut to central nervous system

Xiaoyu Wang et al. Sci Adv. .

Abstract

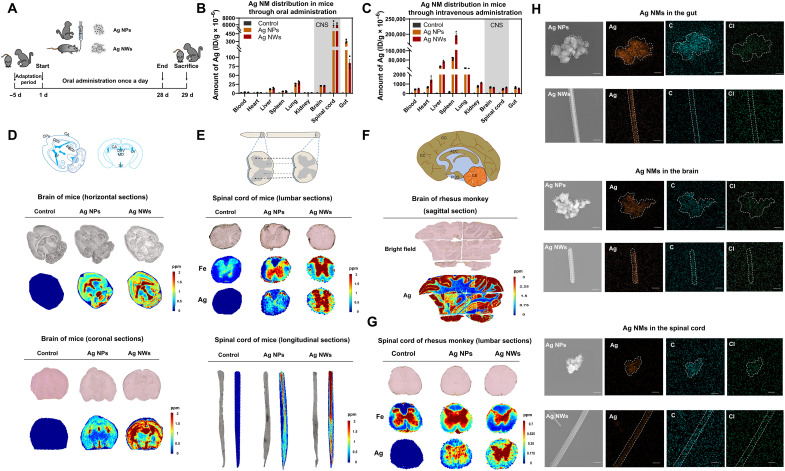
The blood circulation is considered the only way for the orally administered nanoparticles to enter the central nervous systems (CNS), whereas non-blood route-mediated nanoparticle translocation between organs is poorly understood. Here, we show that peripheral nerve fibers act as direct conduits for silver nanomaterials (Ag NMs) translocation from the gut to the CNS in both mice and rhesus monkeys. After oral gavage, Ag NMs are significantly enriched in the brain and spinal cord of mice with particle state however do not efficiently enter the blood. Using truncal vagotomy and selective posterior rhizotomy, we unravel that the vagus and spinal nerves mediate the transneuronal translocation of Ag NMs from the gut to the brain and spinal cord, respectively. Single-cell mass cytometry analysis revealed that enterocytes and enteric nerve cells take up significant levels of Ag NMs for subsequent transfer to the connected peripheral nerves. Our findings demonstrate nanoparticle transfer along a previously undocumented gut-CNS axis mediated by peripheral nerves.


Figures

Fig. 1.
Fig. 1.. Biodistribution of Ag NMs in the CNS after oral gavage in mice and rhesus monkeys.
(A and B) Experimental design and the distribution of Ag NMs in mice and rhesus monkeys treated with Ag NPs (10 mg kg−1) or Ag NWs (10 mg kg−1) by oral gavage for 28 days. ID/g, ratio of Ag in the total dose per gram of the indicated tissue. The data are expressed as the mean ± SEM. (C) Amount of Ag in various organs of mice treated with Ag NPs or Ag NWs by intravenous administration for 14 days (n = 3). (D) Representative LA-ICP-MS images of Ag NPs and Ag NWs distribution in the horizontal (top) and coronal (bottom) brain sections of mice. CPu, caudate putamen (striatum); CA, hippocampus; LV, lateral ventricle; D3V, dorsal third ventricle; 3V, third ventricle; 4V, fourth ventricle; 3Cb, third cerebellar lobule; MD, mediodorsal thalamic nucleus. (E) Representative images of Ag NP and Ag NW distribution in the lumbar (top) and longitudinal (bottom) sections of spinal cord in mice. (F) Representative images of Ag NPs in the sagittal section of brain in rhesus monkeys. CC, cerebral cortex; ACC, agenesis of the corpus callosum; CE, cerebellum; PGO, ponto geniculo occipital. (G) Representative images of Ag NMs in the lumbar section of spinal cord in rhesus monkeys. The color bar unit of (D) to (G) is parts per million (ppm). (H) Representative SEM and EDX images of Ag NMs isolated from the gut, brain, and spinal cord of mice. Scale bars, 100 nm.
Fig. 2.
Fig. 2.. Ag NMs transport from the gut to the brain through the vagus nerves.
(A) Classical EB staining showing the integrity of the BBB of mice treated with Ag NM by oral gavage for 28 (n = 3). Ag content in the blood (B) and brain (C) of mice treated with Ag NPs or Ag NWs by oral gavage (10 mg kg−1) with single/multiple administrations. Single dose: The mice were treated with Ag NPs or Ag NWs once. Daily dose: The mice were treated daily with Ag NPs and Ag NWs (n = 3). (D) Schematic illustration of the truncal vagotomy in mice. (E) Relative concentration of Ag NPs in the brain of mice treated with truncal vagotomy (n = 4). (F) Representative light sheet microscope images showing the Ag NP transmission inside the vagus nerve (green, Ag NPs). (G) Representative confocal microscopy images showing TRPV1 (green) in the vagus nerve of mice after subcutaneous injection of RTX for 3 days (1-day, 30 μg kg−1; 2-day, 70 μg kg−1; 3-day, 100 μg kg−1). DAPI, 4′,6-diamidino-2-phenylindole. (H) Brain Ag NP content of the sham and RTX groups (n = 4). (I) Ag NP and Ag NW content in the vagus nerves of rhesus monkeys. (J) Representative transmission electron microscopy (TEM) images of Ag NPs and Ag NWs in the vagus nerves of rhesus monkeys. The data are expressed as the mean ± SEM. Statistical significance was tested using a two-tailed t test and one-way analysis of variance (ANOVA) analysis. ns, no statistical significance; ***P < 0.001; ****P < 0.0001.
Fig. 3.
Fig. 3.. Ag NMs transport from the gut to the spinal cord via spinal nerves.
(A) Content of Ag in the spinal cord of mice treated with Ag NPs or Ag NWs by oral gavage (10 mg kg−1) with a single dose or multiple doses. Single dose: The mice were treated with Ag NPs or Ag NWs once. Daily dose: The mice were treated daily with Ag NPs and Ag NWs (n = 3). (B) The efficiency of Ag NP entry into the spinal cord of mice through oral gavage and intravenous administration (n = 3). (C) Content of Ag in the spinal nerves and DRG after oral gavage for 28 days (n = 5). (D) Schematic illustration of the removal of spinal nerves by selective posterior rhizotomy (SPR) and the transfer of Ag NPs from the gut to the spinal cord via the spinal nerve. (E) Relative concentration of Ag NPs in the spinal cord of mice treated with SPR (n = 3). (F) Representative Raman image of Ag NPs (exposure dose, 5 μg ml−1) showing the NP transmission inside dorsal root ganglion cells at different time points. Scale bars, 4 μm. (G) Ag NM content in the cervical, thoracic, and lumbar spinal nerve of rhesus monkeys. (H) Ratio of silver in the spinal nerves and viscera of rhesus monkeys. The data are expressed as the mean ± SEM. Statistical significance was tested using a two-tailed t test and one-way ANOVA analysis. ***P < 0.001; ****P < 0.0001.
Fig. 4.
Fig. 4.. Ag NPs are transferred from the gut wall to neurons.
(A) Silver content in Caco-2 cells after exposure to Ag NPs or Ag NP–corona complexes at 5 μg ml−1 at the indicated time points (four replicates per condition). The Ag NPs in cells were detected by ICP-MS. (B) The 20 most abundant proteins on the surface of Ag NPs, as identified by LC-MS/MS. GDP, guanosine diphosphate; NADP, nicotinamide adenine dinucleotide phosphate; PKM, pyruvate kinase M. (C) Silver content in Caco-2 cells after exposure to Ag NPs or complexes of Ag NPs and Hsc70 for 2 and 6 hours, as determined by ICP-MS (four replicates). (D) Representative confocal microscopy images of the transfer of Ag NPs from gut epithelial cells (Caco-2) to neurons (DRG). Scale bars, 4 μm. Single-cell mass cytometry showing (E) the proportion of total gut cells taking up Ag NPs and (F to H) the uptake of Ag NPs by different gut cell subsets. tSNE, t-distributed stochastic neighborhood embedding. (I) Schematic illustration of the cellular uptake and transfer process of Ag NPs from gut epithelial cells to peripheral neurons. The data are expressed as the mean ± SEM. Statistical significance was tested using a two-tailed t test and one-way ANOVA analysis. *P < 0.1; **P < 0.01; ***P < 0.001.
Fig. 5.
Fig. 5.. Working model of the transneuronal transport of NPs from the gut to the CNS.
When Ag NPs enter the gastrointestinal tract by oral gavage, they adsorb proteins to form a nano-corona that facilitates the uptake of NPs by various cell subsets of the gut, especially enterocytes and enteric nerve cells in submucosal/myenteric plexus. Thereafter, the vagus nerves act as direct conduits to mediate the transneuronal transport of Ag NPs along the gut-brain axis. Meanwhile, the spinal nerves mediate the transneuronal transport of Ag NPs along the gut–spinal cord axis.

Similar articles

Cited by

References

    1. Nowack B., Krug H. F., Height M., 120 years of nanosilver history: Implications for policy makers. Environ. Sci. Technol. 45, 1177–1183 (2011). - PubMed
    1. Malysheva A., Ivask A., Doolette C. L., Voelcker N. H., Lombi E., Cellular binding, uptake and biotransformation of silver nanoparticles in human T lymphocytes. Nat. Nanotechnol. 16, 926–932 (2021). - PubMed
    1. Fröehlich E. E., Fröehlich E., Cytotoxicity of nanoparticles contained in food on intestinal cells and the gut microbiota. Int. J. Mol. Sci. 17, 509 (2016). - PMC - PubMed
    1. Seltenrich N., Nanosilver weighing the risks and benefits. Environ. Health Perspect. 121, A220–A225 (2013). - PMC - PubMed
    1. Kahru A., Ivask A., Mapping the dawn of nanoecotoxicological research. Acc. Chem. Res. 46, 823–833 (2013). - PubMed