. 2023 Jul 7;9(27):eadd9984.
doi: 10.1126/sciadv.add9984. Epub 2023 Jul 7.

Single-cell and spatial transcriptomics identify a macrophage population associated with skeletal muscle fibrosis

Affiliations

Single-cell and spatial transcriptomics identify a macrophage population associated with skeletal muscle fibrosis

Gerald Coulis et al. Sci Adv. .

Abstract

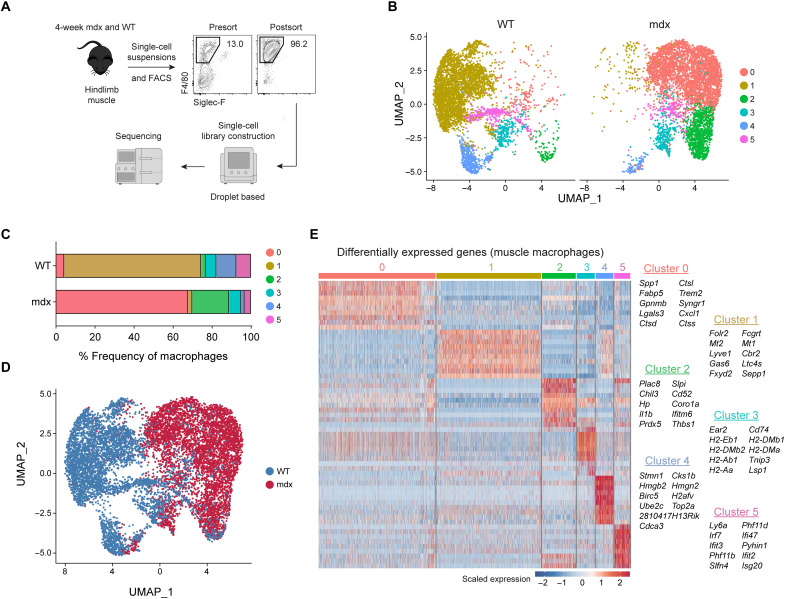
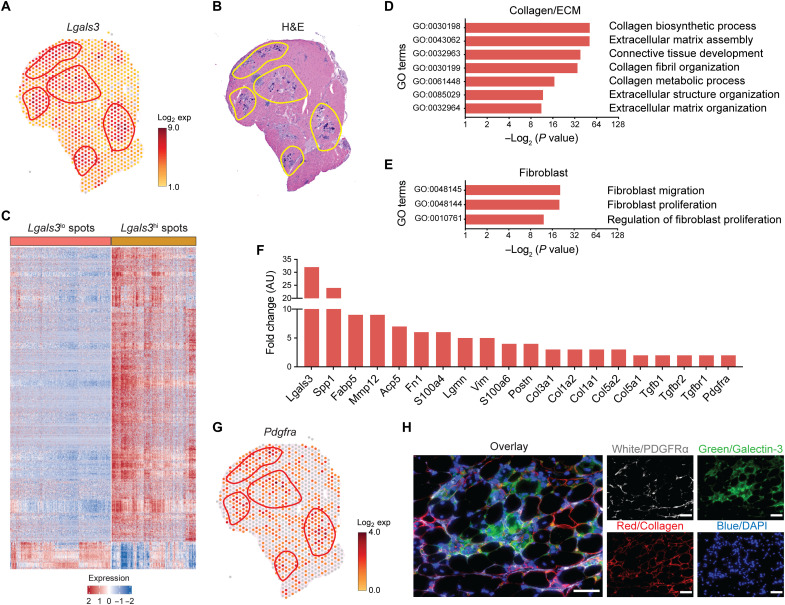
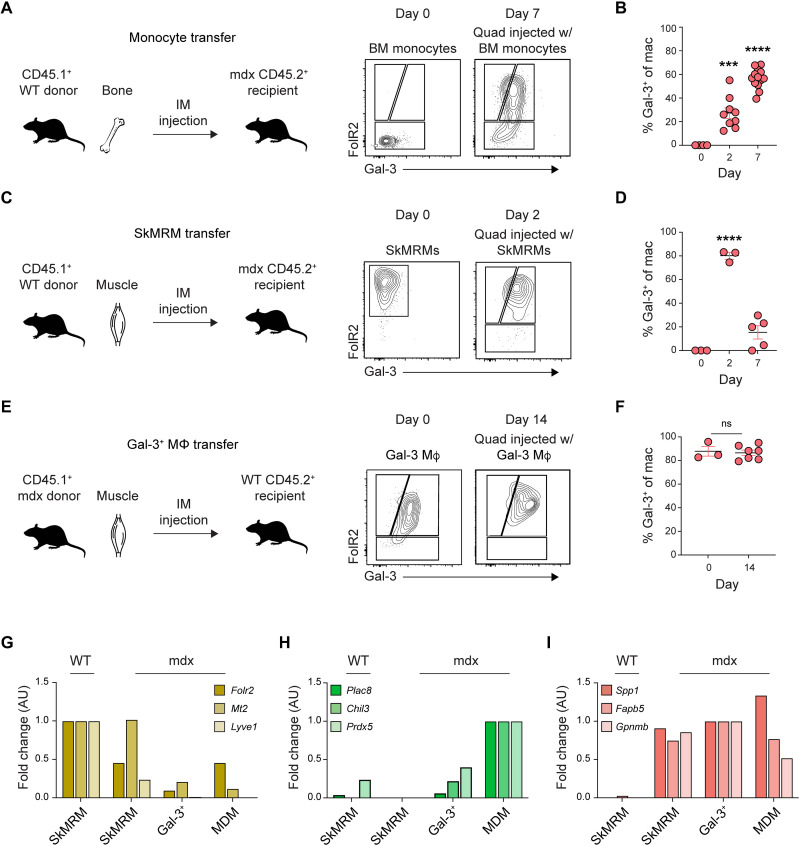
Macrophages are essential for skeletal muscle homeostasis, but how their dysregulation contributes to the development of fibrosis in muscle disease remains unclear. Here, we used single-cell transcriptomics to determine the molecular attributes of dystrophic and healthy muscle macrophages. We identified six clusters and unexpectedly found that none corresponded to traditional definitions of M1 or M2 macrophages. Rather, the predominant macrophage signature in dystrophic muscle was characterized by high expression of fibrotic factors, galectin-3 (gal-3) and osteopontin (Spp1). Spatial transcriptomics, computational inferences of intercellular communication, and in vitro assays indicated that macrophage-derived Spp1 regulates stromal progenitor differentiation. Gal-3+ macrophages were chronically activated in dystrophic muscle, and adoptive transfer assays showed that the gal-3+ phenotype was the dominant molecular program induced within the dystrophic milieu. Gal-3+ macrophages were also elevated in multiple human myopathies. These studies advance our understanding of macrophages in muscular dystrophy by defining their transcriptional programs and reveal Spp1 as a major regulator of macrophage and stromal progenitor interactions.


Figures

Fig. 1.
Fig. 1.. Identification of transcriptomic diversity in skeletal muscle macrophages by scRNAseq.
(A) Muscle macrophages were isolated from 4-week-old WT (healthy) and B10.mdx (dystrophic) mice and analyzed by scRNAseq. n = 1 (B) Dimensionality reduction via UMAP of healthy or dystrophic muscle macrophages. (C) Proportion of WT or mdx muscle macrophage clusters. (D) Identities classified by genotype. (E) Differential gene expression analysis showing the top 10 most differentially expressed genes (DEGs) for each cluster.
Fig. 2.
Fig. 2.. Muscle macrophages express transcriptomes distinct from M1 and M2 macrophages.
(A to C) Heatmap showing the expression of the top 100 scRNAseq DEGs from the scRNAseq analysis (scDEGs) in FACS-sorted SkMRM (A), gal-3+ Mϕ (B), and MDM (C). n = 3 per population. (D) PCA applied to the FACS-sorted macrophage populations in (A) to (C). (E) Pathway analysis of top gene sets enriched in FACS-sorted gal-3+ Mϕ compared to SkMRM. (F) Pairwise comparison of gene expression between FACS-sorted gal-3+ Mϕ and SkMRM. Colored points indicate DEGs from ECM-related gene sets. Lgals3 and Spp1 are highlighted by arrows. (G) Venn diagrams of up-regulated and down-regulated DEGs in FACS-sorted gal-3+ Mϕ compared to SkMRM (Gal-3+/SkMRM) and MDMs compared to SkMRMs (MDMs/SkMRMs). (H) Correlation analysis of DEGs from Gal-3+/SkMRM or MDM/SkMRM comparisons with M1 or M2 polarized Mϕ. (I) Expression of M1 and M2 macrophage markers in gal-3+ Mϕ (0), SkMRMs (1), and MDMs (2) from scRNAseq data. (J) Violin plots of M2 markers in gal-3+ Mϕ, SkMRMs, and MDMs from the scRNAseq data. AU, arbitrary units.
Fig. 3.
Fig. 3.. Spatial transcriptomics reveals that gal-3+ macrophages are associated with stromal cells and ECM.
(A and B) Spatially resolved gene expression of Lgals3 (gal-3) (A) and hematoxylin and eosin (H&E) staining of D2-mdx quadriceps. (B) Shown is one of five representative D2-mdx quadriceps. (C) Heatmap showing DEGs between Lgals3hi and Lgals3lo spots. Shown are genes with a fold change ≥ 1.5 and false discovery rate < 0.01. All spots in a section, including those with and without pathology, were unbiasedly analyzed. (D and E) Gene ontology (GO)/pathway analysis showing the enrichment of GO terms in gal-3hi spots associated with collagen/ECM (D) and fibroblasts (E). (F) Expression of DEGs associated with fibrosis. (G) Spatially resolved gene expression of Pdgfra in mdx quadriceps. (H) Immunofluorescence staining of 4-week-old mdx quadriceps with anti-PDGFRα (white), anticollagen (red), and anti–gal-3 (green) antibodies. Scale bars, 50 μm. DAPI, 4′,6-diamidino-2-phenylindole.
Fig. 4.
Fig. 4.. Spp1 mediates FAP and macrophage interactions in dystrophic muscle.
(A) Reference-based integration of skeletal muscle mononucleated cell datasets prepared from 3-month-old WT and mdx mice. (B to D) Visualization and analysis of cell-cell communication using CellChat. Circle plots placing macrophage subsets as the central nodes of analysis in the mdx dataset (B) to (D). An interaction between a pair of cell types is depicted by a line connecting two cell types. The thickness of the line depicts the strength of that interaction. (E) Pathways enriched in the stromal cell and macrophage network of WT and mdx mice. (F) Relative contribution of Spp1 ligand (L)–receptor (R) pairs. (G) Expression of Spp1 receptors was measured in WT and mdx PDGFRα+Sca1+ FAPs by flow cytometry. Plots shown were gated on live CD45CD31 cells. (H to J) Representative histograms and quantification of the mean fluorescence intensity (MFI) of Spp1 receptors. Four-week-old mice were analyzed. n = 3 to 4. *P < 0.05 and ***P < 0.001 using an unpaired Welch’s t test. (K to M) RNAscope multiplexed with immunofluorescence staining of adjacent section showing F4/80+ macrophages (K, green), Spp1 mRNA (M, yellow), and areas enriched with collagen (L, red). Laminin is shown in white (K) to (M). Scale bar, 100 μm. (N) Spp1 secretion was assessed by enzyme-linked immunosorbent assay. (O and P) The expression of Acta2 (O) and Col1a1 (P) was measured by reverse transcription qPCR (RT-qPCR) in FAPs stimulated with monocyte (mono)–conditioned or gal-3+ macrophage–conditioned media. α-SPP1, neutralizing mouse Spp1 antibody. Shown is a representative of two independent experiments with conditions done in duplicate.
Fig. 5.
Fig. 5.. Chronic activation of gal-3+ macrophages in dystrophic muscle.
(A) The number of gal-3+ macrophages in B10.mdx hindlimb muscle, normalized to muscle mass (grams). n = 6 to 19 per time point. (B and C) Representative histograms and quantitative analysis of the geometric MFI of gal-3 in 4-week-old (B) and 52-week-old (C) WT and mdx muscle macrophages. (D) Picrosirius red staining of WT and mdx quadriceps cryosections from 4- and 52-week-old mice. Scale bar, 100 μm. (E and F) Enumeration of gal-3+ macrophages in the VCP-associated inclusion body myopathy mouse model (E) and in the facioscapulohumeral muscular dystrophy Tamoxifen inducible Cre-DUX4 (TIC-DUX4) mouse model (F). n = 4 to 6, 10-month-old mice (E); n = 5, 10-week-old mice (F). (G and H) Regulation of gal-3+ macrophages frequency (G) and number (H) after injury. n = 7 to 9 per time point (G) and (H). *P < 0.05, **P < 0.01, and ****P < 0.0001 using an unpaired Welch’s t test (B), (C), (E), and (F) or two-way ANOVA with Sidak’s multiple comparisons test, for comparison with 2-week time point (A) or with day 0 (G) and (H). ****P < 0.0001 using Sidak’s multiple comparisons test, for comparison with age-matched controls of 4, 8, 12, and 52 weeks, respectively.
Fig. 6.
Fig. 6.. Peripheral monocytes and skeletal muscle-resident macrophages give rise to gal-3+ macrophages.
(A and B) Adoptive transfer of monocytes into 4-week-old mdx mice. Graphical abstract of the workflow and representative flow plots of monocytes before and after transfer (A). Frequency of the donor monocytes that converted to gal-3+ macrophages at 2 and 7 days after transfer (B). n = 3 to 13 per group. (C and D) Adoptive transfer of SkMRMs into 4-week-old mdx mice. Schematic of the workflow and representative flow plots (C). Frequency of SkMRMs that converted to gal-3+ macrophages (D). n = 3 to 5 per group. (E and F) Schematic of the transfer of gal-3+ macrophages into healthy WT muscle (E) and their quantification (F). n = 3 to 7 per group. (G to I) RT-qPCR quantification of the expression of cluster 1 (E), 2 (F), and 0 genes (G) in FACS-sorted SkMRMs from WT and mdx muscle, and gal-3+ Mϕ and MDMs from mdx muscle. ***P < 0.001, and ****P < 0.0001 using a one-way ANOVA with Sidak’s multiple comparisons test (B) and (D) for comparison with the day 0 mean or an unpaired Welch’s t test (F). A two-way ANOVA with Sidak’s multiple comparisons test was used for the gene expression assays (G) to (I). IM, intramuscular; ns, not significant.
Fig. 7.
Fig. 7.. Gal-3+ macrophages are elevated in human chronic muscle disease.
(A) Immunofluorescence staining of gal-3+ macrophages in human IBM muscle. CD68 (red), gal-3 (green), nuclei (blue). Scale bars, 100 μm. (B) Representative images of immunohistochemical staining of gal-3 in control and myopathic patients. Scale bars, 100 μm. (C to E) Quantification of gal-3+ cells in the interstitial space (C), the perivascular area (D), or infiltrating the myofiber (E). n = 3 to 8 frozen sections per patient type. (F and G) Expression of human SPP1 (F) and COL1A (G) mRNA in control, DMD, and LGMD biopsies. n = 6 to 8 patients were used to measure RNA expression. *P < 0.05, **P < 0.01, and ***P < 0.001 using a two-way ANOVA with Kruskal-Wallis multiple comparisons test (C) to (G).

Update of

Similar articles

Cited by

References

    1. Davies L. C., Jenkins S. J., Allen J. E., Taylor P. R., Tissue-resident macrophages. Nat. Immunol. 14, 986–995 (2013). - PMC - PubMed
    1. Okabe Y., Molecular control of the identity of tissue-resident macrophages. Int. Immunol. 30, 485–491 (2018). - PubMed
    1. Tidball J. G., Villalta S. A., Regulatory interactions between muscle and the immune system during muscle regeneration. Am. J. Physiol. Regul. Integr. Comp. Physiol. 298, R1173–R1187 (2010). - PMC - PubMed
    1. Mosser D. M., Edwards J. P., Exploring the full spectrum of macrophage activation. Nat. Rev. Immunol. 8, 958–969 (2008). - PMC - PubMed
    1. Saclier M., Yacoub-Youssef H., Mackey A. L., Arnold L., Ardjoune H., Magnan M., Sailhan F., Chelly J., Pavlath G. K., Mounier R., Kjaer M., Chazaud B., Differentially activated macrophages orchestrate myogenic precursor cell fate during human skeletal muscle regeneration. Stem Cells 31, 384–396 (2013). - PubMed