. 2023 Jul 14;8(85):eadg3917.
doi: 10.1126/sciimmunol.adg3917. Epub 2023 Jul 7.

3D chromatin reprogramming primes human memory TH2 cells for rapid recall and pathogenic dysfunction

Affiliations

3D chromatin reprogramming primes human memory TH2 cells for rapid recall and pathogenic dysfunction

Anne Onrust-van Schoonhoven et al. Sci Immunol. .

Abstract

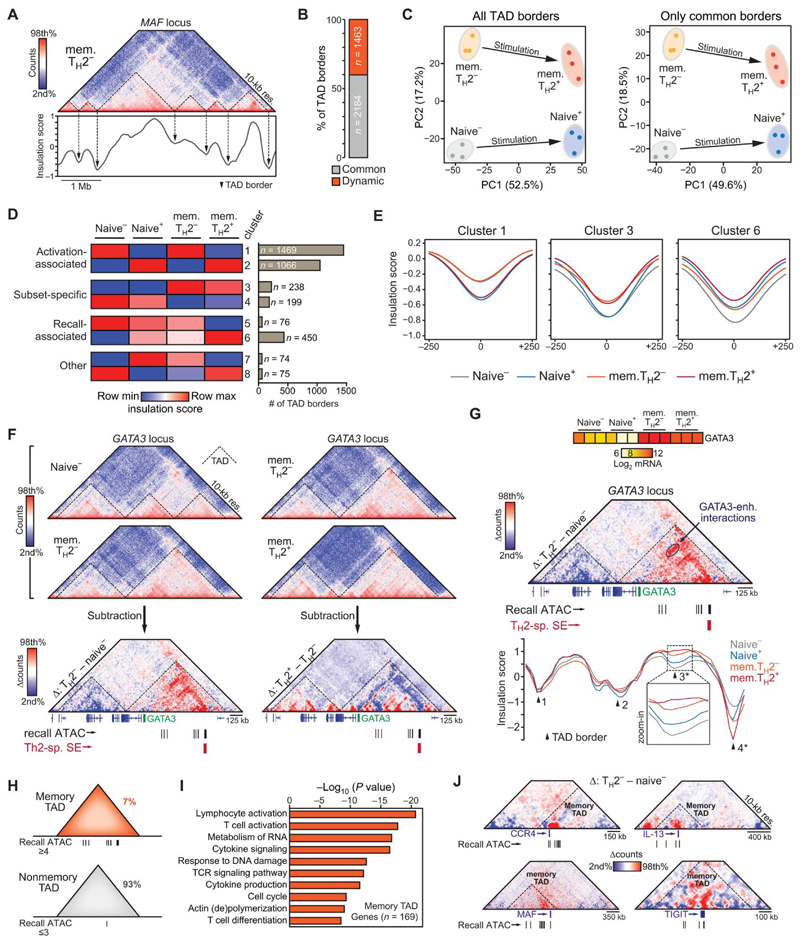
Memory T cells provide long-lasting defense responses through their ability to rapidly reactivate, but how they efficiently "recall" an inflammatory transcriptional program remains unclear. Here, we show that human CD4+ memory T helper 2 (TH2) cells carry a chromatin landscape synergistically reprogrammed at both one-dimensional (1D) and 3D levels to accommodate recall responses, which is absent in naive T cells. In memory TH2 cells, recall genes were epigenetically primed through the maintenance of transcription-permissive chromatin at distal (super)enhancers organized in long-range 3D chromatin hubs. Precise transcriptional control of key recall genes occurred inside dedicated topologically associating domains ("memory TADs"), in which activation-associated promoter-enhancer interactions were preformed and exploited by AP-1 transcription factors to promote rapid transcriptional induction. Resting memory TH2 cells from patients with asthma showed premature activation of primed recall circuits, linking aberrant transcriptional control of recall responses to chronic inflammation. Together, our results implicate stable multiscale reprogramming of chromatin organization as a key mechanism underlying immunological memory and dysfunction in T cells.


Conflict of interest statement

Competing interests: The authors declare that they have no competing interests.

Figures

Fig. 1
Fig. 1. Identification of distinct transcriptional modules linked to rapid recall in human CD4+ memory T cells.
(A) Potential epigenomic drivers of rapid recall investigated in this study. (B) Experimental system used to investigate the epigenomic underpinnings of rapid transcriptional recall in human memory (“mem.”) TH2 cells. Cells were stimulated with bead-linked anti-CD3 and anti-CD28 antibodies to mimic generic TCR and CD28 co-receptor activation. (C) Flow cytometry gating strategy used to isolate human naive CD4+ T cells and memory TH2 cells from peripheral blood. (D) mRNA expression levels of signature TH cytokine genes in the indicated resting (−) and stimulated (+) cells. Data represent measurements from three independent biological replicates. (E) PCA of scaled gene expression values for all genes expressed in at least one sample type (n = 12,284 genes). (F) Heatmap showing mRNA expression levels for genes within three recall-associated gene modules (example genes are indicated). Boxplots on the right indicate averaged expression values (z-score scaled) for each module in each of the four indicated T cell samples. P values: Kruskal-Wallis test corrected for multiple testing. ns, not significant. (G) Pathway enrichment analysis of genes belonging to the three modules. GTPases, guanosine triphosphatases; ER, endoplasmic reticulum; JAK, Janus kinase. (H) Network of biological pathways associated with recall-associated module genes. Nodes represent individual pathways (P < 0.05) that are connected and clustered on the basis of functional similarity. Nodes are represented as pie charts: The size of a pie is proportional to the total number of hits; pie charts are color-coded on the basis of the module origin of the associated genes. Circos plot indicates connections between the three modules at the pathway level, with gray lines linking genes that belong to the same enriched pathway. (I) mRNA gene expression (top) and protein levels (as measured by flow cytometry, bottom) of selected module members.
Fig. 2
Fig. 2. Extensive priming of chromatin accessibility in resting human CD4+ memory T cells.
(A) PCA of normalized accessibility values for all reproducibly detected ATAC-Seq peaks (present in at least one sample type, n = 96,102 peaks). (B) Heatmap showing normalized ATAC-Seq signals of indicated peak clusters in the indicated resting (−) and stimulated (+) cells. Line graph indicates averaged signal across all peaks within the three memory-specific clusters. (C) Pie chart depicting distances of recall-associated ATAC-Seq cluster peaks in human TH2 cells to the nearest transcription start site (TSS). Red line indicates proportion of peaks outside of promoter regions. (D) Pathway enrichment analysis of genes closest to ATAC-Seq peaks from the indicated clusters. (E) Overlap between genes linked to recall-associated ATAC-Seq peaks (“Primed genes”) and genes from the three recall-associated transcriptional modules (see Fig. 1). (F) Genome browser screenshot showing ATAC-Seq profiles at the primed IL3 locus in resting (−) and stimulated (+) naive or memory TH2 cells. Boxplot depicts IL3 mRNA levels in samples from three independent donors. (G) Heatmaps with RNA-Seq (left) and ATAC-Seq (right) signals across the indicated sample types for epigenomically primed genes with a statistically significant expression advantage after stimulation. Example genes are indicated.
Fig. 3
Fig. 3. Specific TFs govern the recall-associated chromatin landscape in human CD4+ memory T cells.
(A) Fold changes (log2 scale) in H3K27Ac levels upon TCR stimulation of total CD4+ memory T cells for naive-specific (n = 652) or recall-associated (mem-sp.1 cluster, n = 1173) ATAC-Seq peaks. (B) Heatmap representations of averaged H3K4Me2 (top) or RNA polymerase II (RNAPII, bottom) ChIP-Seq signal at the indicated recall-associated ATAC-Seq peak clusters in different resting T cell subsets. (C) Genome browser screenshots showing H3K4Me2, ATAC, and RNAPII signals at selected recall-associated ATAC-Seq peaks. Numbers on top indicate distance to TSS in kilobase. (D) Top three overrepresented TF binding motifs based on P values for the indicated recall-associated ATAC-Seq peak clusters. Percentages indicate proportion of sites in which motif was detected [versus background (vs. bg.)]. (E) Scaled mRNA levels (z-score) of motif-associated TF genes significantly up-regulated in memory TH2 cells compared with naive CD4+ T cells, either at resting state (*P < 0.05) or after activation (#P < 0.05). Boxplots depict RPKM values of selected genes from the heatmap. (F) TF occupancy patterns at all recall-associated ATAC-Seq peaks (n = 3025 peaks) in stimulated CD4+ memory T cells. Inset bar graph shows total fraction of peaks bound the indicated TF. (G) Expression analysis of recall (IL4 and IL5) and general activation (CD40LG and HPRT) genes in resting (−) and stimulated (+) memory TH2 cells with or without T-5224 AP-1 inhibitor before treatment (n = 3 independent biological replicates). (H) Flow cytometry analysis of MAF protein levels in resting (−) and stimulated (+) memory TH2 cells. Bottom two tracks show cells in which MAF was disrupted using CRISPR-Cas9 with two different crRNAs, preventing MAF induction. (I) Expression analysis of recall (IL4 and IL9) and general activation (HPRT) genes in resting (−) and stimulated (+) memory TH2 cells pretreated with Cas9 and a nontargeting control (ctrl) or MAF crRNA. (J) Proportion of indicated superenhancer (SE) categories that overlap with recall-associated ATAC-Seq peaks, including P values indicating statistical significance of the overlaps shown. (K) Heatmap showing mRNA expression levels for genes linked to memory TH2-specific SEs (example genes are indicated). (L) Genome browser screenshot (top: H3K4Me2 ChIPmentation, bottom: ATAC-Seq) of the SE landscape at the CD28-CTLA4-ICOS locus. (M) Boxplots depicting gene expression dynamics of CD28, CTLA4, and ICOS. Statistical tests used: (A, G, and I) Mann-Whitney U test; (D and J) Fisher’s exact test; (E) DESeq2 Wald test.
Fig. 4
Fig. 4. Distinct patterns of chromosome compartmentalization in human memory TH2 cells are linked to transcriptional priming.
(A) Schematic representation of nuclear compartments A and B, including the C-score distribution used to quantify compartment association of genomic regions (i.e., from −1 = strong B to 1 = strong A). (B) Compartment strength calculated as a ratio between homotypic (AA/BB) and heterotypic (AB/BA) interactions over increasing distances. (C) PCA of genome-wide C-score values (10-kb bins). (D) Quantification of dynamic C-score bins (10-kb resolution) showing a 0.3 or greater difference in at least one comparison (n, naive CD4+ T cells; −, resting; +, stimulated). Assignment of dynamic bins to individual comparisons is indicated in the right bar graph. (E) Directionality of C-score changes across dynamic bins within the indicated comparisons. (F) Heatmap representation of clustered scaled C-scores (left). The six clusters showing a recall-associated increase in C-score consist of 754 regions further detailed in the right heatmap (with absolute C-score values), including examples of associated key inflammatory genes. (G) Enrichment scores and P values (Fisher’s exact test) of recall-associated ATAC-Seq peaks (see Fig. 2 for definitions), TH2-specific or naive-specific SEs, and GATA3 binding sites in memory TH2 cells within the 754 dynamic C-score regions. (H) Meta-plot of long-range Hi-C interactions (2- to 10-Mb window) between recall-associated (cluster mem-sp.2) or naive-specific ATAC-Seq peaks. (I) Scaled C-scores (z score) of dynamic bins (ΔC-score > 0.1 in at least one pairwise comparison) at TH2-specific (n = 220 bins), memory-specific (n = 1285 bins), and naive-specific (n = 414 bins) ATAC-Seq peak clusters. (J) Scaled C-scores (z-score) of dynamic bins at gene regulatory elements linked to recall-associated genes from recall module I (n = 654), the combined recall modules II + III (n = 2352; see Fig. 1F), and primed genes with an expression advantage (“primed ATAC,” n = 897; see Fig. 2G). P values: Kruskal-Wallis test corrected for multiple testing. (K) Genome browser screenshot (top) showing C-score dynamics at the MAF locus, with gene expression dynamics depicted below in boxplots.
Fig. 5
Fig. 5. TAD dynamics linked to human memory TH2 cell function.
(A) Hi-C interaction map of the MAF locus with insulation scores and TAD borders (defined as local minima) plotted below. (B) Proportions of common (invariant in all four sample groups) and dynamic (gained or lost in at least one sample group) TAD borders. (C) PCA of insulation score values at all (left) or only common (right) TAD borders. (D) Heatmap representation of clustered scaled insulation scores at TAD borders. Patterns associated with clusters are indicated on the left; border counts for each cluster are shown on the right (bar graph). (E) Average insulation scores at dynamic TAD borders from the indicated clusters in resting (−) or stimulated (+) naive CD4+ T cells and memory TH2 cells. (F) Hi-C interaction maps of the GATA3 locus from the indicated sample groups. Signal subtraction (delta) plots are shown below to highlight differences in interaction signals (left: red = higher in TH2 versus naive; right: red = higher in TH2+ versus TH2). Locations of genes, recall-associated ATAC-Seq peaks, and TH2-specific SEs are indicated at the bottom. (G) Top: heatmap depicting GATA3 mRNA levels. Middle/bottom: Hi-C signal subtraction plot (red = higher in TH2 versus naive) as shown in (F) (left side) but with insulation score profiles and TAD border calls (n = 4) indicated below. Note the third dynamic TAD border that is only called in naive T cells. (H) Definition of “memory TADs” as those domains that contain four or more recall-associated ATAC-Seq peaks (7% of all TADs). (I) Pathway enrichment analysis of recall-associated genes located within memory TADs. (J) Hi-C signal subtraction plots (red = higher in TH versus naive) for selected memory TADs.
Fig. 6
Fig. 6. Chromatin loops prime genes for rapid recall in human memory TH2 cells.
(A) Venn diagram of all loops identified in resting (−) or stimulated (+) naive CD4+ T cells and memory TH2 cells. Meta-plots of Hi-C signal intensity averaged across all recall-associated loops (n = 308) in resting naive and memory T cell subsets are shown on the right. LS, loop strength (log2 scale). (B) Combined pie chart and radar plot depicting the proportion of memory and recall-associated loops connecting enhancers (Enh./E) and/or promoters (Prom./P). The height of each pie segment indicates fold enrichment (denoted by the gray circles). (C) Hi-C interaction maps of the GATA3 locus in stimulated memory TH2 cells. Locations of genes, recall-associated ATAC-Seq peaks, and TH2-specific SEs are indicated below, followed by significant loops involving the GATA3 promoter detected in each condition. (D) Pathway enrichment analysis of genes (n = 838) near anchors of memory and recall-associated loops. (E) Scaled mRNA expression (z-score) of genes near anchors of memory (left, n = 430) or recall-associated (right, n = 425) loops in resting (−) or stimulated (+) naive CD4+ T cells and memory TH2 cells. P values: Kruskal-Wallis test corrected for multiple testing. (F) Hi-C interaction maps and signal subtraction plot (bottom; red = higher in TH2 versus naive) of the IL9 locus. H3K4Me2 ChIP-Seq and ATAC-Seq signal tracks are shown below as well as loops involving the IL9 gene specifically detected in memory TH2 cells. (G) IL9 gene expression levels in the indicated sample types. (H) Hi-C interaction maps of the TH2 cytokine locus. Locations of genes, the TH2 LCR, recall-associated ATAC-Seq peaks, and H3K4Me2 peaks are indicated below (zoom in). Median read count per 10-kb bin [coverage (cov)] within the TH2 domain is indicated. (I) Interacting read pairs detected connecting IL5 with the LCR-IL13-IL4 region (sum of 5-kb bins) in resting naive or memory T cells. P value: Mann-Whitney U test. (J) Interacting read pairs detected connecting IL5 with the TH2 LCR, IL13, IL4, or the unrelated SHROOM1 gene across the indicated sample types. (K) Heatmap showing pathway enrichment for the indicated primed recall gene sets. Pathway cluster (n = 4) functions are summarized below.
Fig. 7
Fig. 7. Multiscale epigenomic priming in human memory TH2 cells is linked to asthma.
(A) Gene expression levels (z-score–scaled) of the three recall-associated transcriptional modules (see Fig. 1) as measured in peripheral blood memory TH2 cells from healthy controls or patients with asthma with either low or high symptom burden. (B) mRNA levels of a primed recall gene (MAF) and a general activation marker (CD40LG) across the indicated groups. (C) H3K4Me2 levels (z-score–scaled) at the four recall-associated ATAC-Seq peak clusters as measured by ChIP-Seq on peripheral blood memory TH2 cells from healthy controls or patients with asthma. (D) Genome browser screenshot of the CD82 locus showing H3K4Me2 signals in a healthy control and a patient with asthma. Inset graph below shows H3K4Me2 levels at the indicated recall-associated ATAC-Seq peak across the entire cohort (HC, healthy; AST, asthma). (E) Enrichment scores and P values for asthma-associated SNPs intersected with recall-associated or naive-specific ATAC-Seq peaks. (F) Genome browser screenshot of the CCR4-GLB1 locus, highlighting a TH2-specific SE region containing multiple recall-associated ATAC-Seq peaks and asthma SNPs. (G) Enrichment scores and P values for asthma-associated SNPs intersected with the indicated recall-associated 3D genome features. (H) Graphical summary of this study’s main findings. See text for details. Statistical tests used: (A and B) Kruskal-Wallis test corrected for multiple testing; (C and D) Mann-Whitney U test; (E and G) Fisher’s exact test. **P < 0.01 and ****P < 0.0001.

References

    1. Chaplin DD. Overview of the immune response. J Allergy Clin Immunol. 2010;125:S3–S23. doi: 10.1016/j.jaci.2009.12.980. - DOI - PMC - PubMed
    1. Zhu J, Yamane H, Paul WE. Differentiation of effector CD4 T cell populations. Annu Rev Immunol. 2010;28:445–489. doi: 10.1146/annurev-immunol-030409-101212. - DOI - PMC - PubMed
    1. Natoli G, Ostuni R. Adaptation and memory in immune responses. Nat Immunol. 2019;20:783–792. - PubMed
    1. Sallusto F, Lanzavecchia A, Araki K, Ahmed R. From vaccines to memory and back. Immunity. 2010;33:451–463. doi: 10.1016/j.immuni.2010.10.008. - DOI - PMC - PubMed
    1. Stadhouders R, Lubberts E, Hendriks RW. A cellular and molecular view of T helper 17 cell plasticity in autoimmunity. J Autoimmun. 2018;87:1–15. - PubMed