. 2023 Jul 14;8(85):eadd4817.
doi: 10.1126/sciimmunol.add4817. Epub 2023 Jul 7.

Restoring tumor immunogenicity with dendritic cell reprogramming

Affiliations

Restoring tumor immunogenicity with dendritic cell reprogramming

Olga Zimmermannova et al. Sci Immunol. .

Abstract

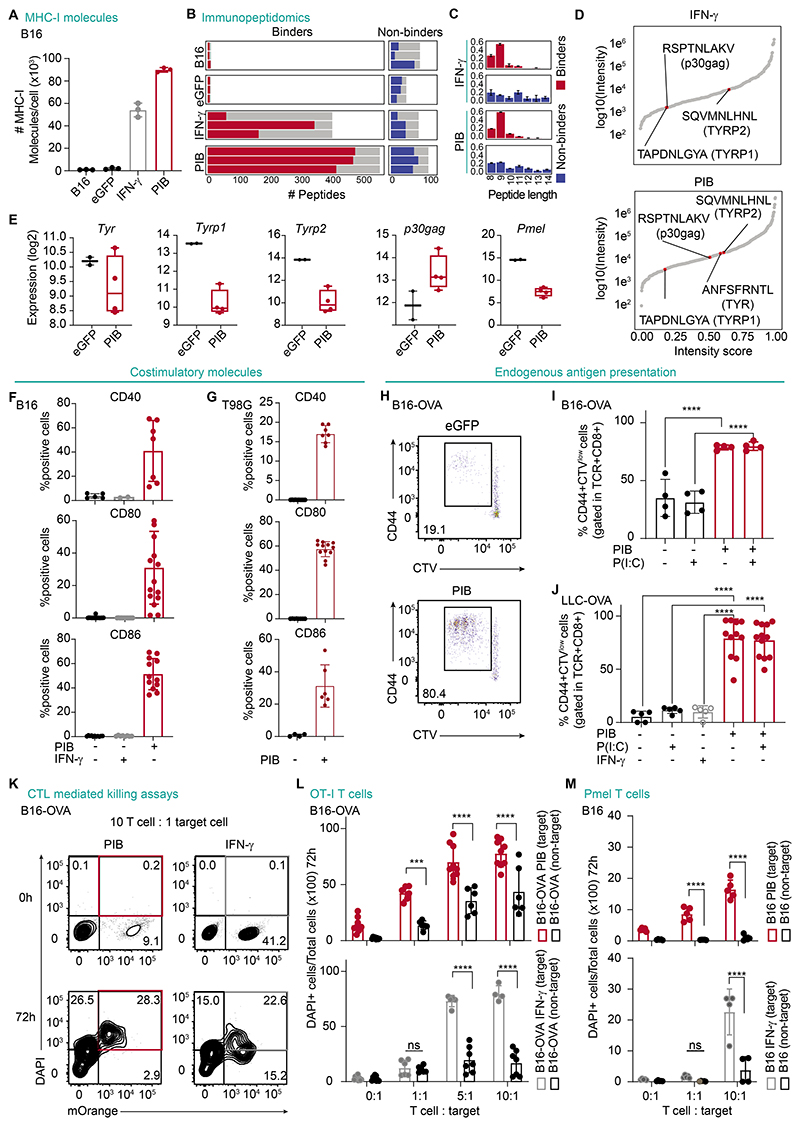
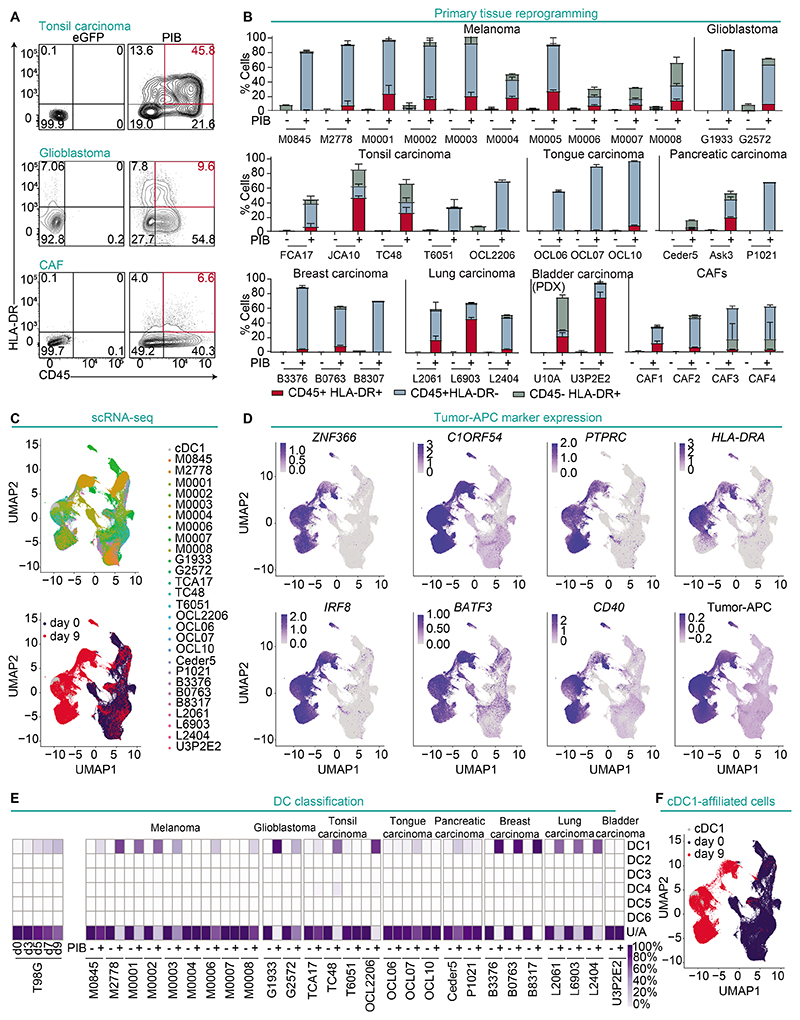
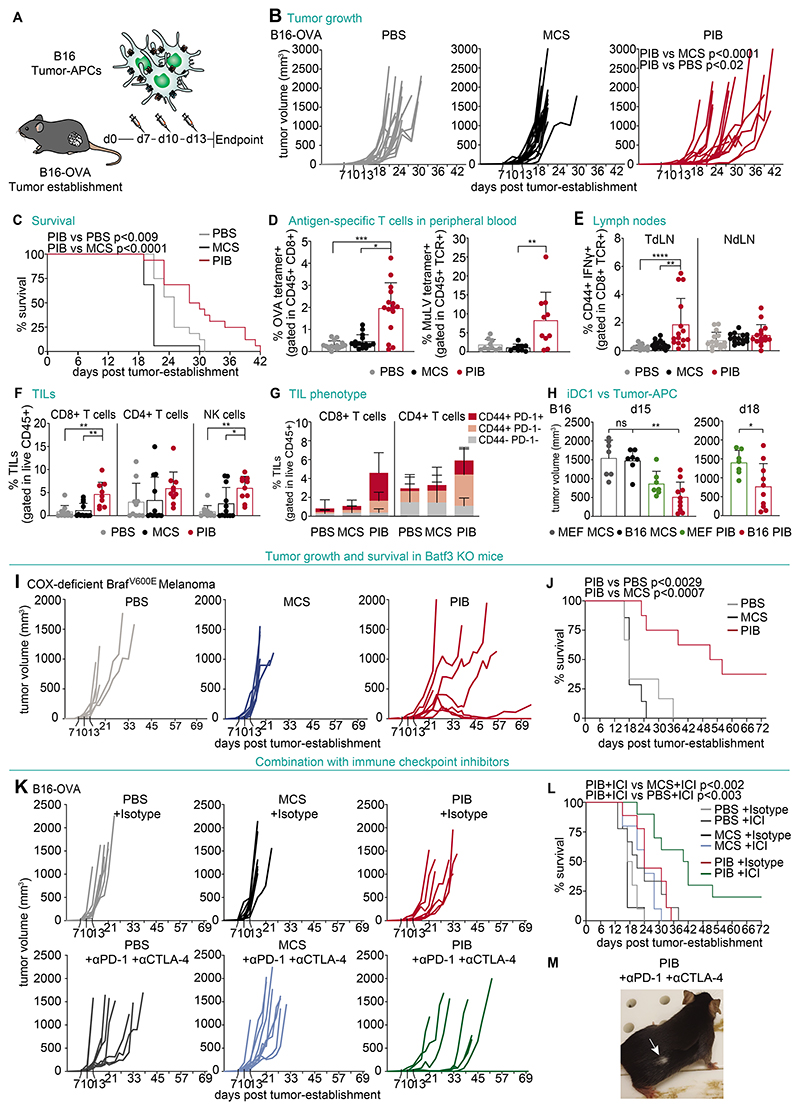
Decreased antigen presentation contributes to the ability of cancer cells to evade the immune system. We used the minimal gene regulatory network of type 1 conventional dendritic cells (cDC1) to reprogram cancer cells into professional antigen-presenting cells (tumor-APCs). Enforced expression of the transcription factors PU.1, IRF8, and BATF3 (PIB) was sufficient to induce the cDC1 phenotype in 36 cell lines derived from human and mouse hematological and solid tumors. Within 9 days of reprogramming, tumor-APCs acquired transcriptional and epigenetic programs associated with cDC1 cells. Reprogramming restored the expression of antigen presentation complexes and costimulatory molecules on the surfaces of tumor cells, allowing the presentation of endogenous tumor antigens on MHC-I and facilitating targeted killing by CD8+ T cells. Functionally, tumor-APCs engulfed and processed proteins and dead cells, secreted inflammatory cytokines, and cross-presented antigens to naïve CD8+ T cells. Human primary tumor cells could also be reprogrammed to increase their capability to present antigen and to activate patient-specific tumor-infiltrating lymphocytes. In addition to acquiring improved antigen presentation, tumor-APCs had impaired tumorigenicity in vitro and in vivo. Injection of in vitro generated melanoma-derived tumor-APCs into subcutaneous melanoma tumors delayed tumor growth and increased survival in mice. Antitumor immunity elicited by tumor-APCs was synergistic with immune checkpoint inhibitors. Our approach serves as a platform for the development of immunotherapies that endow cancer cells with the capability to process and present endogenous tumor antigens.


Conflict of interest statement

Competing interests: F.F.R., C.F.P. and C.-F.P. have equity interest and serve in management positions at Asgard Therapeutics AB, which develops cancer immunotherapies based on DC reprogramming technologies. F.F.R., C.F.P. and C.-F.P. are inventors on US patent 11,345,891, patent application WO 2018/185709 and patent application WO 2022/243448 (together with O.Z, A.G.F. and E.A.) held by Asgard Therapeutics that covers the cell reprogramming approach described here.

Figures

Figure 1
Figure 1. Reprogramming induces cDC1 program in mouse and human cancer cells.
(A) Experimental strategy to restore immunogenicity in cancer cells with PIB encoded in a lentiviral vector as a polycistronic construction. Induced tumor-APCs were characterized in vitro and in vivo. (B) Reprogramming efficiency of murine LLC cells, analyzed by flow cytometry as the percentage of CD45+MHC-II+ cells (red) gated in eGFP+ cells at day 9, when transduced with PIB-eGFP or control eGFP lentiviruses. (C) Micrographs depicting expression of MHC-II in reprogrammed melanoma (B16) cells. Scale bars, 20 μm (D) Quantification of CD45+MHC-II+ cells (n=10-21) and (E) CLEC9A+ cells gated in CD45+MHC-II+ population (n=2-8). (F) Reprogramming efficiency of human glioblastoma (T98G) and melanoma (HMVII) cells and (G) quantification from 28 solid cancer cell lines. Reprogrammed (CD45+HLA-DR+) and partially reprogrammed populations (CD45+HLA-DR- and CD45-HLA-DR+) are shown (n=2-6). (H) Surface expression and quantification of cDC1 markers gated in CD45+HLA-DR+ (n=4). Fluorescence minus one (FMO) control is shown. (I) Scanning electron microscopy of tumor-APCs purified on day 9. Scale bars, 20 μm. (J) PCA for reprogrammed (day 9++) and partially reprogrammed (day 9+) tumor-APCs, eGFP transduced cells (day 0) and peripheral blood cDC1 (HLA-DR+CD11c+CD141+, grey) (n=3-8). Color code marks cell line of origin. Arrow highlights reprogramming trajectory. (K) Percentage of tumor-APC gene signature activation in reprogrammed (red) and partially reprogrammed cells (blue). (L) Top 6 Kyoto Encyclopedia of Genes and Genomes (KEGG) (mouse)/Reactome (human) pathways, and gene ontologies upregulated in tumor-APCs. Mean±SD is represented. n = biological replicates.
Figure 2
Figure 2. PIB induce rapid global transcriptional and epigenetic reprogramming.
(A) Experimental design to evaluate the kinetics of reprogramming at the transcriptional and epigenetic levels. The human glioblastoma cell line (T98G) was transduced with PIB-eGFP. Reprogrammed (CD45+HLA-DR+, ++) and partially reprogrammed (CD45-LA-DR+, +) cells purified and profiled by RNA-seq and ATAC-seq at day 3 (d3), 5 (d5), 7 (d7) and 9 (d9). eGFP transduced cells were used as control (d0) and peripheral blood cDC1 as reference (grey). (RNA-seq, n=4-8; ATAC-seq, n=2-3; biological replicates) (B) PCA of transcriptomes. Reprogramming of HEFs was included as a reference for the dynamics. Color code identifies time points. (C) PCA based on differentially accessible chromatin regions. Arrows highlight reprogramming trajectories. (D) Percentage of tumor-APC gene signature activation and (E) chromatin accessibility in reprogrammed and partially reprogrammed cells. (F) mRNA expression of the cDC1 specific genes, ZNF366 (DC-script), CLEC9A, and XCR1 (n=3-8). (G) Representative sequencing tracks for IFI16, ANPEP, and IRF8 loci showing ATAC-seq peaks during reprogramming. Grey boxes highlight relevant peaks. (H) Transcription factor (TF) binding motif enrichment analysis and (I) Gene Ontology biological processes enrichment analysis of differential ATAC-seq peaks. Circle size refers to the number of peaks intersecting with the respective database category. Color gradient depicts adjusted P values based on a binomial test.
Figure 3
Figure 3. Reprogrammed cancer cells become immunogenic.
(A) Flow cytometry quantification of the number of MHC-I molecules in B16 cells, tumor-APCs at day 9 (PIB) or B16 cells after eGFP transduction or stimulation with IFN-γ. (n=3). (B) Number of peptides predicted as binders and non-binders per biological replicate (n=3). Grey bars indicate the total number of distinct peptides per condition. (C) Peptide length distributions and (D) ranking by normalized intensity of predicted binders. Peptides derived from canonical melanoma tumor antigens are highlighted. (E) mRNA expression in B16-derived tumor-APCs on day 9. (F) Quantification of expression of the costimulatory molecules CD40, CD80 and CD86 by flow cytometry gated in CD45+MHC-II+ (mouse) (n=2-17) or (G) CD45+HLA-DR+ (human) (n=4-12). (H) Representative flow cytometry plots and (I) quantification of CD8+ T cell proliferation, measured by Cell Trace Violet (CTV) dilution, and activation (CD44+) after co-culture with purified B16-OVA cells at reprogramming day 3. Poly(I:C) (P(I:C)) stimulation overnight when indicated (n=4). (J) Quantification of CD44+CTVlow CD8+ T cells when co-cultured with tumor-APCs derived from LLC-OVA at day 9 (n=5-12). (K) T cell-mediated killing of B16-OVA target cells (mOrange+) that were either PIB-transduced or IFN-γ-treated, after 72 h of coculture. The percentage of target dead cells (mOrange+, DAPI+) is highlighted in red. (L) Quantification of cell killing of either target or nontarget tumor cells when cocultured with increasing ratios of OT-I T cells after 72 h (n=4-9). (M) Quantification of pmel-specific T cell killing of either target or nontarget B16 tumor cells after 72 h (n=4-6). Mean±SD is represented. n= biological replicates. P value was calculated using One-way ANOVA followed by Tukey´s multiple comparison test (I, J) or Two-way ANOVA followed by Sidak multiple comparison test. ***P<0.001, ****P<0.0001.
Figure 4
Figure 4. Tumor-APCs are endowed with cDC1 function.
(A) The APC function of mouse and human tumor-APCs was assessed at reprogramming day 9. (B) Secretion of IL12p70, IL-29, CXCL10, and TNFα by human reprogrammed CD45+HLA-DR+ cells (PIB, red) with or without Poly(I:C) or LPS stimulation. eGFP-transduced cells were used as controls (-) and enriched peripheral blood DCs as reference (n=3-8). (C) Micrographs depicting uptake of fluorescently labeled OVA (OVA-AF647, red) by reprogrammed CD45+MHC-II+ LLC cells. Flow cytometry histogram (middle) and quantification (right) at 4°C and 37°C with IFN-γ stimulation, where indicated (n=3-10). Scale bars, 25μm. (D) Micrographs showing processing of DQ-OVA+ (green) by reprogrammed LLC cells. Scale bars, 25μm. Flow cytometry quantification of the percentage of DQ-OVA+ cells (right) transduced with PIB (n=6-13). (E) PSMB10 and PSMB9 protein expression in tumor-APCs. BM-DCs were used as reference, and calnexin (CANX) as loading control. (F) Engulfment of fluorescently labeled dead cells quantified by flow cytometry (left) and visualized by time-lapse microscopy (right). Black arrows highlight a reprogrammed CD45+HLA-DR+ cell (green) engulfing a dead cell over time (red, white arrows). Scale bar, 100μm. (G) Quantification of CD44+CTVlow CD8+ OT-I T cells after a 3-day coculture period with BM-DCs (left, n=7-10) and reprogrammed LLC cells pre-incubated with OVA peptide (right, SINFEKL; n=4-12). (H) Quantification of CD44+CTVlow CD8+ OT-I T cells co-cultured with tumor-APCs pulsed with OVA protein (n=2-8). Mean±SD is represented. n= biological replicates. P value was calculated using Two-way ANOVA (B) or One-way ANOVA (C,D,H) followed by Tukey´s multiple comparison test. **P<0.01, *** P<0.001, ****P<0.0001.
Figure 5
Figure 5. Human primary cancer cells are permissive to cDC1 reprogramming.
(A) Reprogramming efficiency of human primary tonsil carcinoma (JCA10), glioblastoma (G2572) and CAFs at reprogramming day 9 and (B) quantification from 35 patient samples. Reprogrammed (CD45+HLA-DR+) and partially reprogrammed populations (CD45+HLA-DR- and CD45-HLA-DR+) are shown. Individual patients are depicted by codes (n=2-6). Mean±SD is represented. (C) Reprogrammed and partially reprogrammed cells from 27 human primary tumor samples were purified and profiled by scRNA-seq without multiplexing. Peripheral blood cDC1 were used as reference, and eGFP-transduced cells as controls. UMAP analysis of single-cell transcriptomes showing 136,796 primary cancer cells according to their origin (upper panel) or treatment (bottom panel). (D) UMAP plots showing expression of cDC1 genes ZNF366 and C1ORF54, reprogramming markers PTPRC and HLA-DRA, endogenous expression of IRF8 and BATF3, costimulatory molecule CD40, and tumor-APC signature. (E) Integration of single-cell data from a reprogramming time-course of the T98G cell line (left) and primary tumor samples (right) with published DC subset data (GSE94820). Heatmap shows the percentage of single cells affiliated to individual cDC subsets or unaffiliated (U/A). (F) UMAP showing single-cell transcriptomes of cDC1-affiliated cells.
Figure 6
Figure 6. cDC1 reprogramming imposes cDC1 function in primary melanoma cells.
(A) CD8+ T cells from CMV+ donors were co-cultured with day 9 PIB-transduced, eGFP-transduced melanoma cells primed with CMV peptide and LPS and Poly(I:C). Cocultures with moDCs were included as reference. Flow cytometry plots showing percentage of CMV+ CD8+ T cells (left, detected with two similar tetramers with PE and APC fluorophores) and quantification of CMV+ CD8+ T cells (middle) and TNFα+ IFN-γ+ CD8+ T cells after coculture (right, n=3-5). (B and C) Flow cytometry plots showing percentage and quantification of MART-1 specific CD8+ T cells after coculture with tumor-APCs primed with (B) MART-1 short peptide (right, n=6) and (C) long peptide (right, n=6). (D) PIB-reprogrammed and eGFP-transduced control melanoma cells were cocultured with autologous tumor infiltrating lymphocytes (TILs). Untransduced melanoma cells were included as additional controls. Quantification of the frequency of expression of the reactivity markers CD107a, CD137, TNFα, and IFN-γ by CD8+ T cells as a proportion of the total CD8+ T cell pool (right, n=2) and TIL-mediated lysis of melanoma cells (left, n=3). The lines in the left panel connect the mean values of cytolysis at individual timepoints. (E) Quantification of mean fluorescence intensity (MFI) for the exhaustion markers BTLA, LAG3, TIM3, PD-1 expressed on CD8+ TILs after co-culture with untransduced, eGFP-transduced, and reprogrammed cells. (n=4). Mean±SD is represented. n= biological replicates. P value was calculated using Two-Way ANOVA followed by Tukey´s multiple comparison test. *P<0.05, **P<0.01, ***P<0.001, ****P<0.0001.
Figure 7
Figure 7. cDC1 reprogramming attenuates tumorigenicity in vitro and in vivo.
(A) Heatmap showing gene expression changes in cell cycle progression gene signatures in reprogramming. Reprogrammed (CD45+HLA-DR+; ++), partially reprogrammed (CD45-HLA-DR+; +), were profiled by bulk RNA-seq at day 3 (d3), 5 (d5), 7 (d7), and 9 (d9). eGFP-transduced cells were included as day 0 (d0). cDC1s served as reference. n=4-8; biological replicates. (B) mRNA expression of cell cycle progression (CCNA2, CDK1, MCM6, CDK2, PCNA, and MKI67) and cell cycle arrest genes (TP53, RB1, and CDKN1A) (n=3-8). (C) Changes in proliferation signature imposed by cDC1 reprogramming in 17 human cancer cell lines. (D) Flow cytometry analysis of cell proliferation by dye dilution. Reprogrammed T98G cells at day 9 were labelled with CTV, recultured and analyzed by flow cytometry after 1 (day 10), 3 (day 12), 4 (day 13), 6 (day 15), 8 (day 17), and 10 (day 19) days. (E) CTV MFI in reprogrammed CD45+HLA-DR+ (red) and eGFP+ (black) populations from 4 cell lines (n=2). (F) Anchorage-independent growth in soft agar of purified reprogrammed and partially reprogrammed cells. Colony formation after 4 to 6 weeks of culture and quantification for three cell lines (n=3-6). Relevant mutations are indicated. (G) Anchorage-independent growth of cells reprogrammed with DOX-inducible lentiviral PIB-expressing system. Colony formation after 5 weeks of culture after removal of DOX. (n=6). (H) Assessment of tumorigenic potential of tumor-APCs in vivo (top). Survival curves of NXG mice transplanted with reprogrammed T98G-derived CD45+HLA-DR+ cells (red, n=6), eGFP-transduced controls (black, n=9) and with 3P2C PDX-derived CD45+HLA-DR+ cells (red, n=4) and eGFP-transduced cells (black, n=5). For graphs in (A-G), mean±SD is presented. n= biological replicates. P values in (H) were calculated using Mantel-Cox test.
Figure 8
Figure 8. Tumor-APCs trigger anti-tumor immunity in vivo.
(A) B16-OVA tumors were injected intratumorally at day 7, 10 and 13 with B16-derived tumor-APCs pulsed with OVA protein and Poly(I:C). (B) Tumor growth and (C) survival of mice injected with tumor-APCs (PIB) compared with PBS and injection of control transduced cells (MCS) (n=16). (D) Flow cytometry quantification of peripheral blood T cells with OVA tetramer (left) or Murine Leukemia Virus (MuLV) tetramer (right), as a proportion of CD45+ CD8+ T cells, at day 14 after tumor establishment. (n=10-15) (E) Quantification of CD44+IFN-γ+ CD8+ T cells isolated from tumor-draining (TdLN) or non-draining lymph nodes (NdLN) after in vitro restimulation with pmel peptide at day 18. (n=15) (F) Quantification of tumor infiltrating lymphocytes (TILs) and (G) CD44+ and PD-1+ expression at day 18. (n=10) (H) Volumes of B16 tumors at day 15 (left) and 18 (right) treated with tumor-APCs (B16 PIB) compared with MEF-derived iDC1 (MEF PIB) after overnight stimulation with Poly(I:C) (n=7-10). (I) Tumor growth and (J) survival of BATF3-/- mice injected with Cox-deficient BRAFV600E melanoma tumor cells treated with tumor-APCs derived from the same cell line after overnight stimulation with Poly(I:C) (n=6-8). (K) Tumor growth and (L) survival of mice treated with ICIs (anti-PD-1 and anti-CTLA-4) or isotype controls (IgG2a and IgG2b) in combination with B16-derived tumor-APCs (PIB) after overnight incubation with OVA and Poly(I:C) (n=9-10). (M) Animal cured with combination therapy showing depigmentation (white arrow) on tumor regression site. Mean±SD is represented. n= biological replicates. P values were calculated using Kruskal Wallis (B, D-H), Mann-Whitney (H), and Mantel-Cox test (C, J, L). *P<0.05, **P<0.01, ***P<0.001, ****P<0.0001.

References

    1. Sharma P, Hu-Lieskovan S, Wargo JA, Ribas A. Primary, Adaptive, and Acquired Resistance to Cancer Immunotherapy. Cell. 2017;168:707–723. - PMC - PubMed
    1. Jhunjhunwala S, Hammer C, Delamarre L. Antigen presentation in cancer: insights into tumour immunogenicity and immune evasion. Nat Rev Cancer. 2021;21:298–312. - PubMed
    1. Manguso RT, Pope HW, Zimmer MD, Brown FD, Yates KB, Miller BC, Collins NB, Bi K, La Fleur MW, Juneja VR, Weiss SA, et al. In vivo CRISPR screening identifies Ptpn2 as a cancer immunotherapy target. Nature. 2017;547:413–418. - PMC - PubMed
    1. Patel SJ, Sanjana NE, Kishton RJ, Eidizadeh A, Vodnala SK, Cam M, Gartner JJ, Jia L, Steinberg SM, Yamamoto TN, Merchant AS, et al. Identification of essential genes for cancer immunotherapy. Nature. 2017;548:537–542. - PMC - PubMed
    1. Hashimoto M, Kamphorst AO, Im SJ, Kissick HT, Pillai RN, Ramalingam SS, Araki K, Ahmed R. CD8 T Cell Exhaustion in Chronic Infection and Cancer: Opportunities for Interventions. Annu Rev Med. 2018;69:301–318. - PubMed

Substances