. 2023 Jul 6;30(7):962-972.e6.
doi: 10.1016/j.stem.2023.06.003.

Organ function is preserved despite reorganization of niche architecture in the hair follicle

Affiliations

Organ function is preserved despite reorganization of niche architecture in the hair follicle

Haoyang Wei et al. Cell Stem Cell. .

Abstract

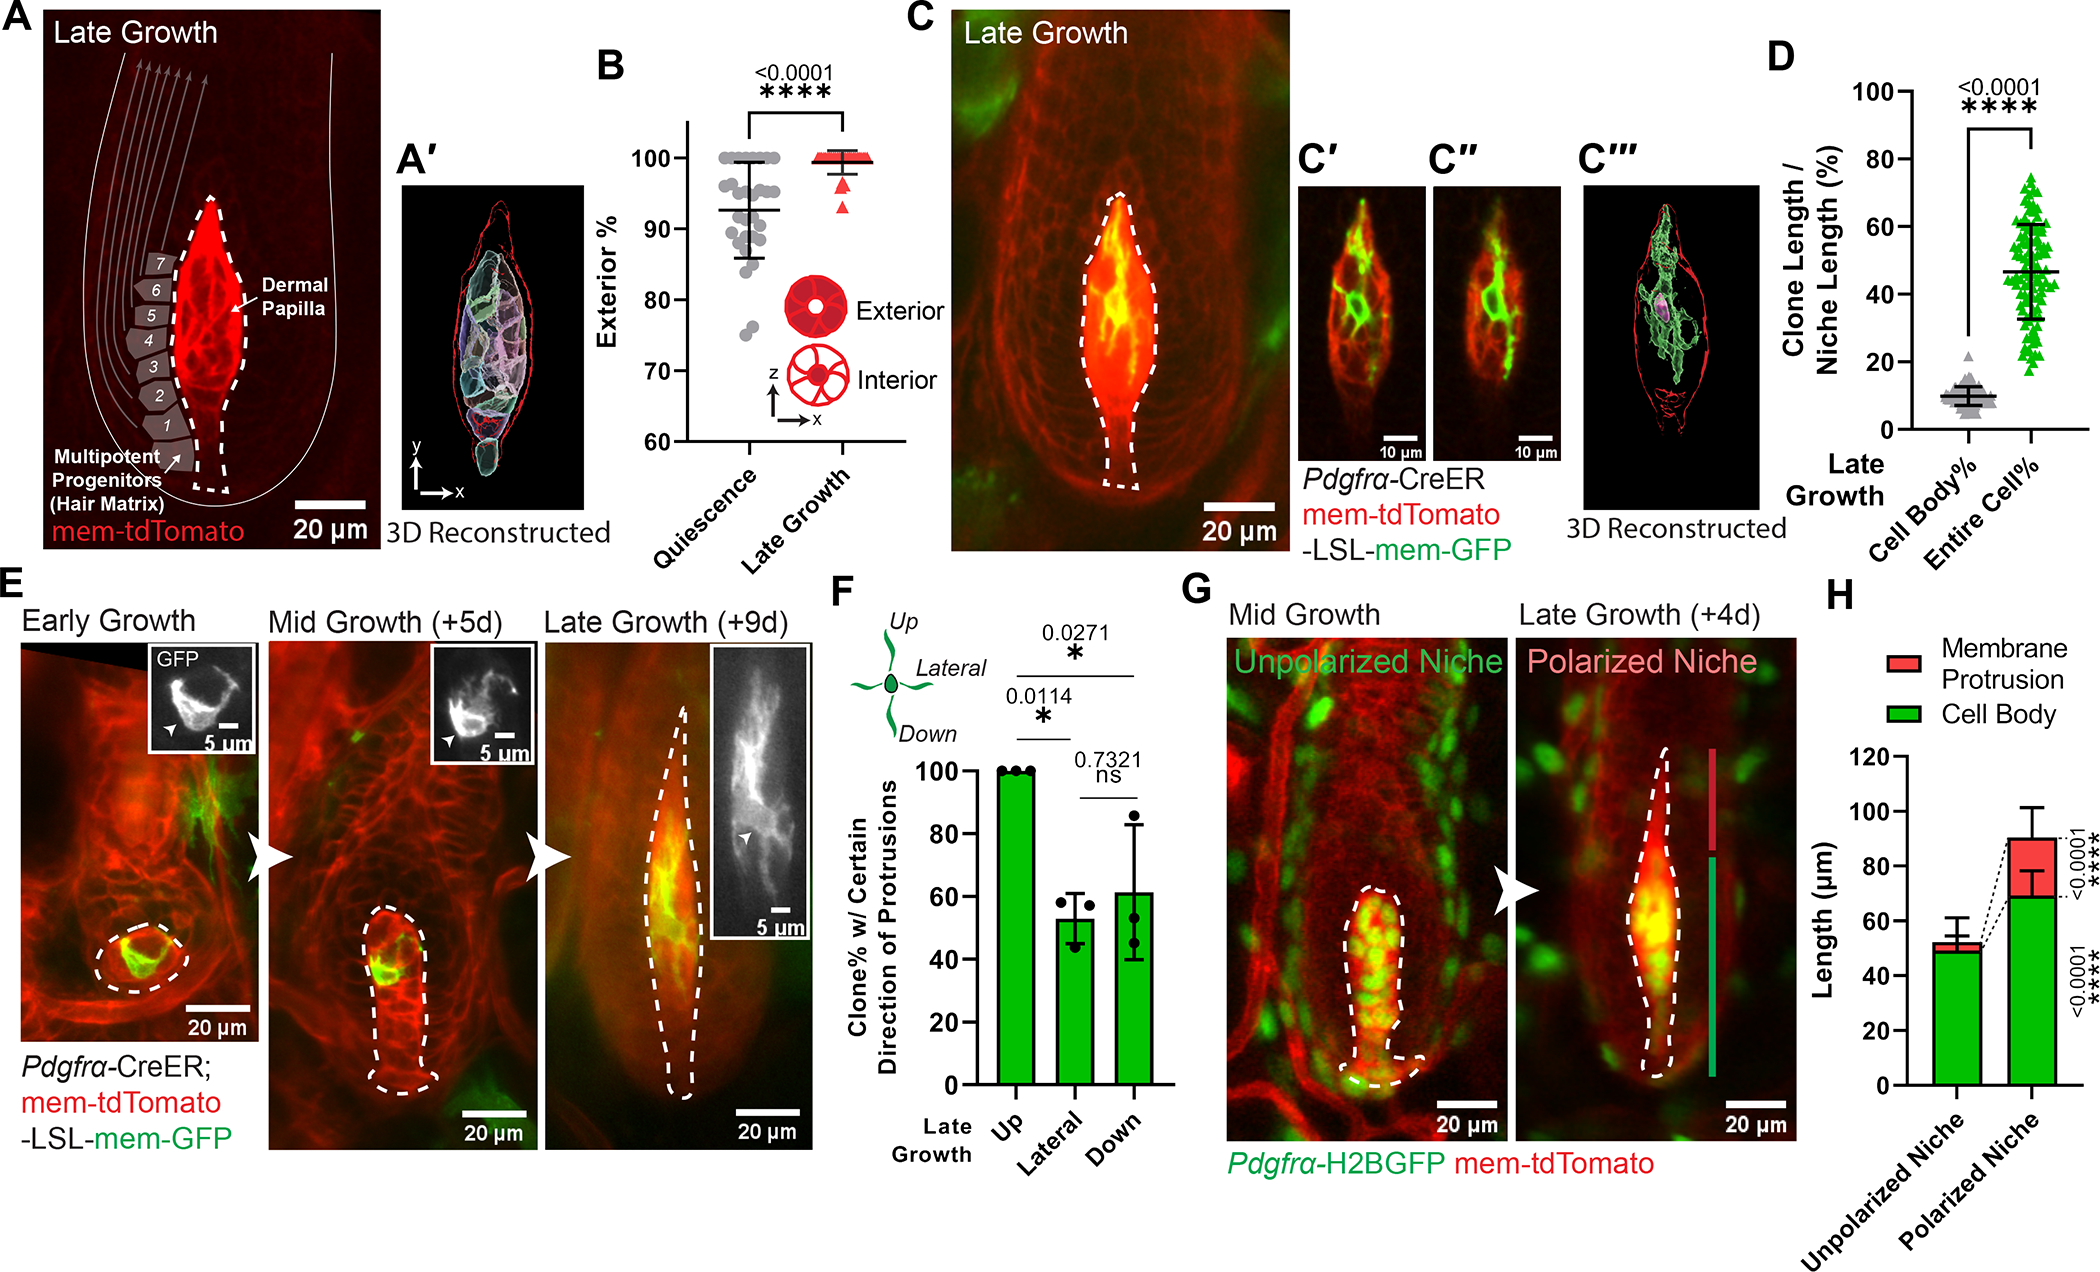
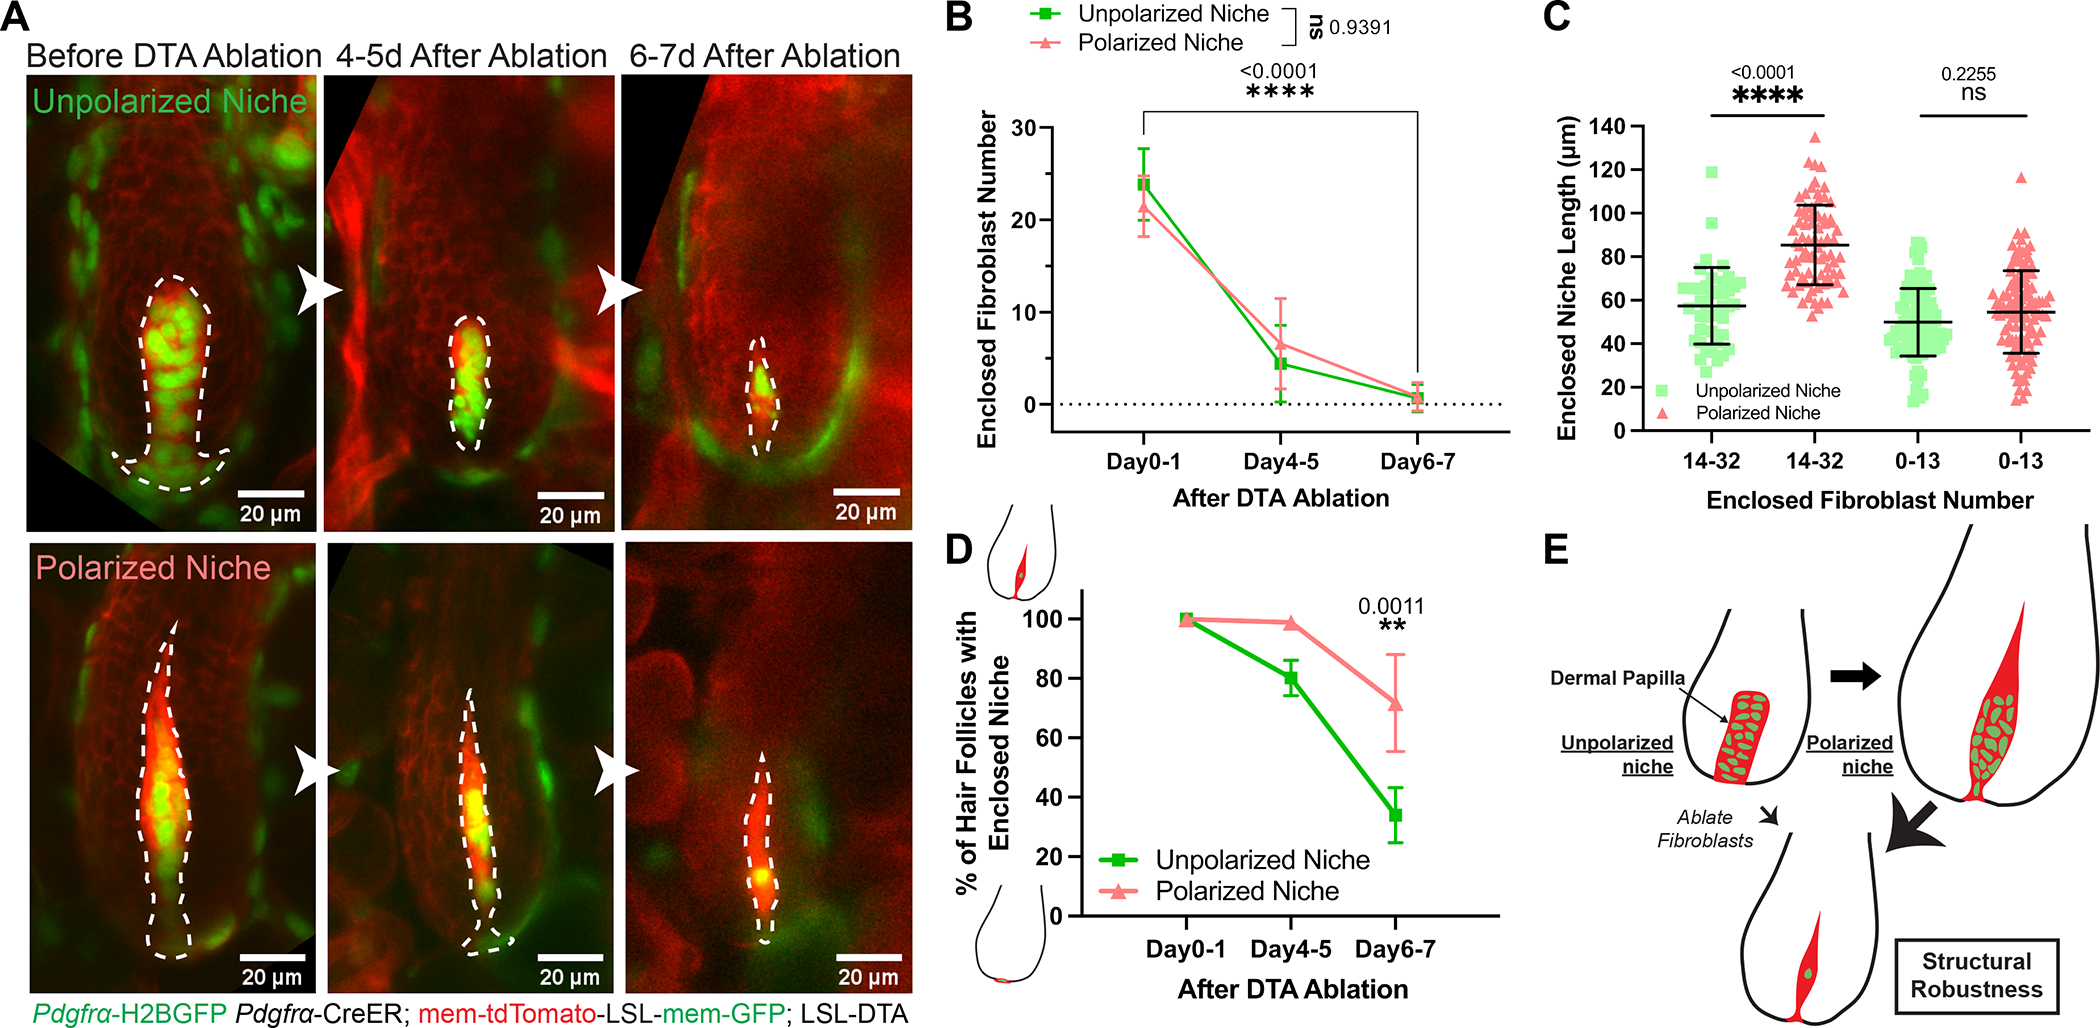
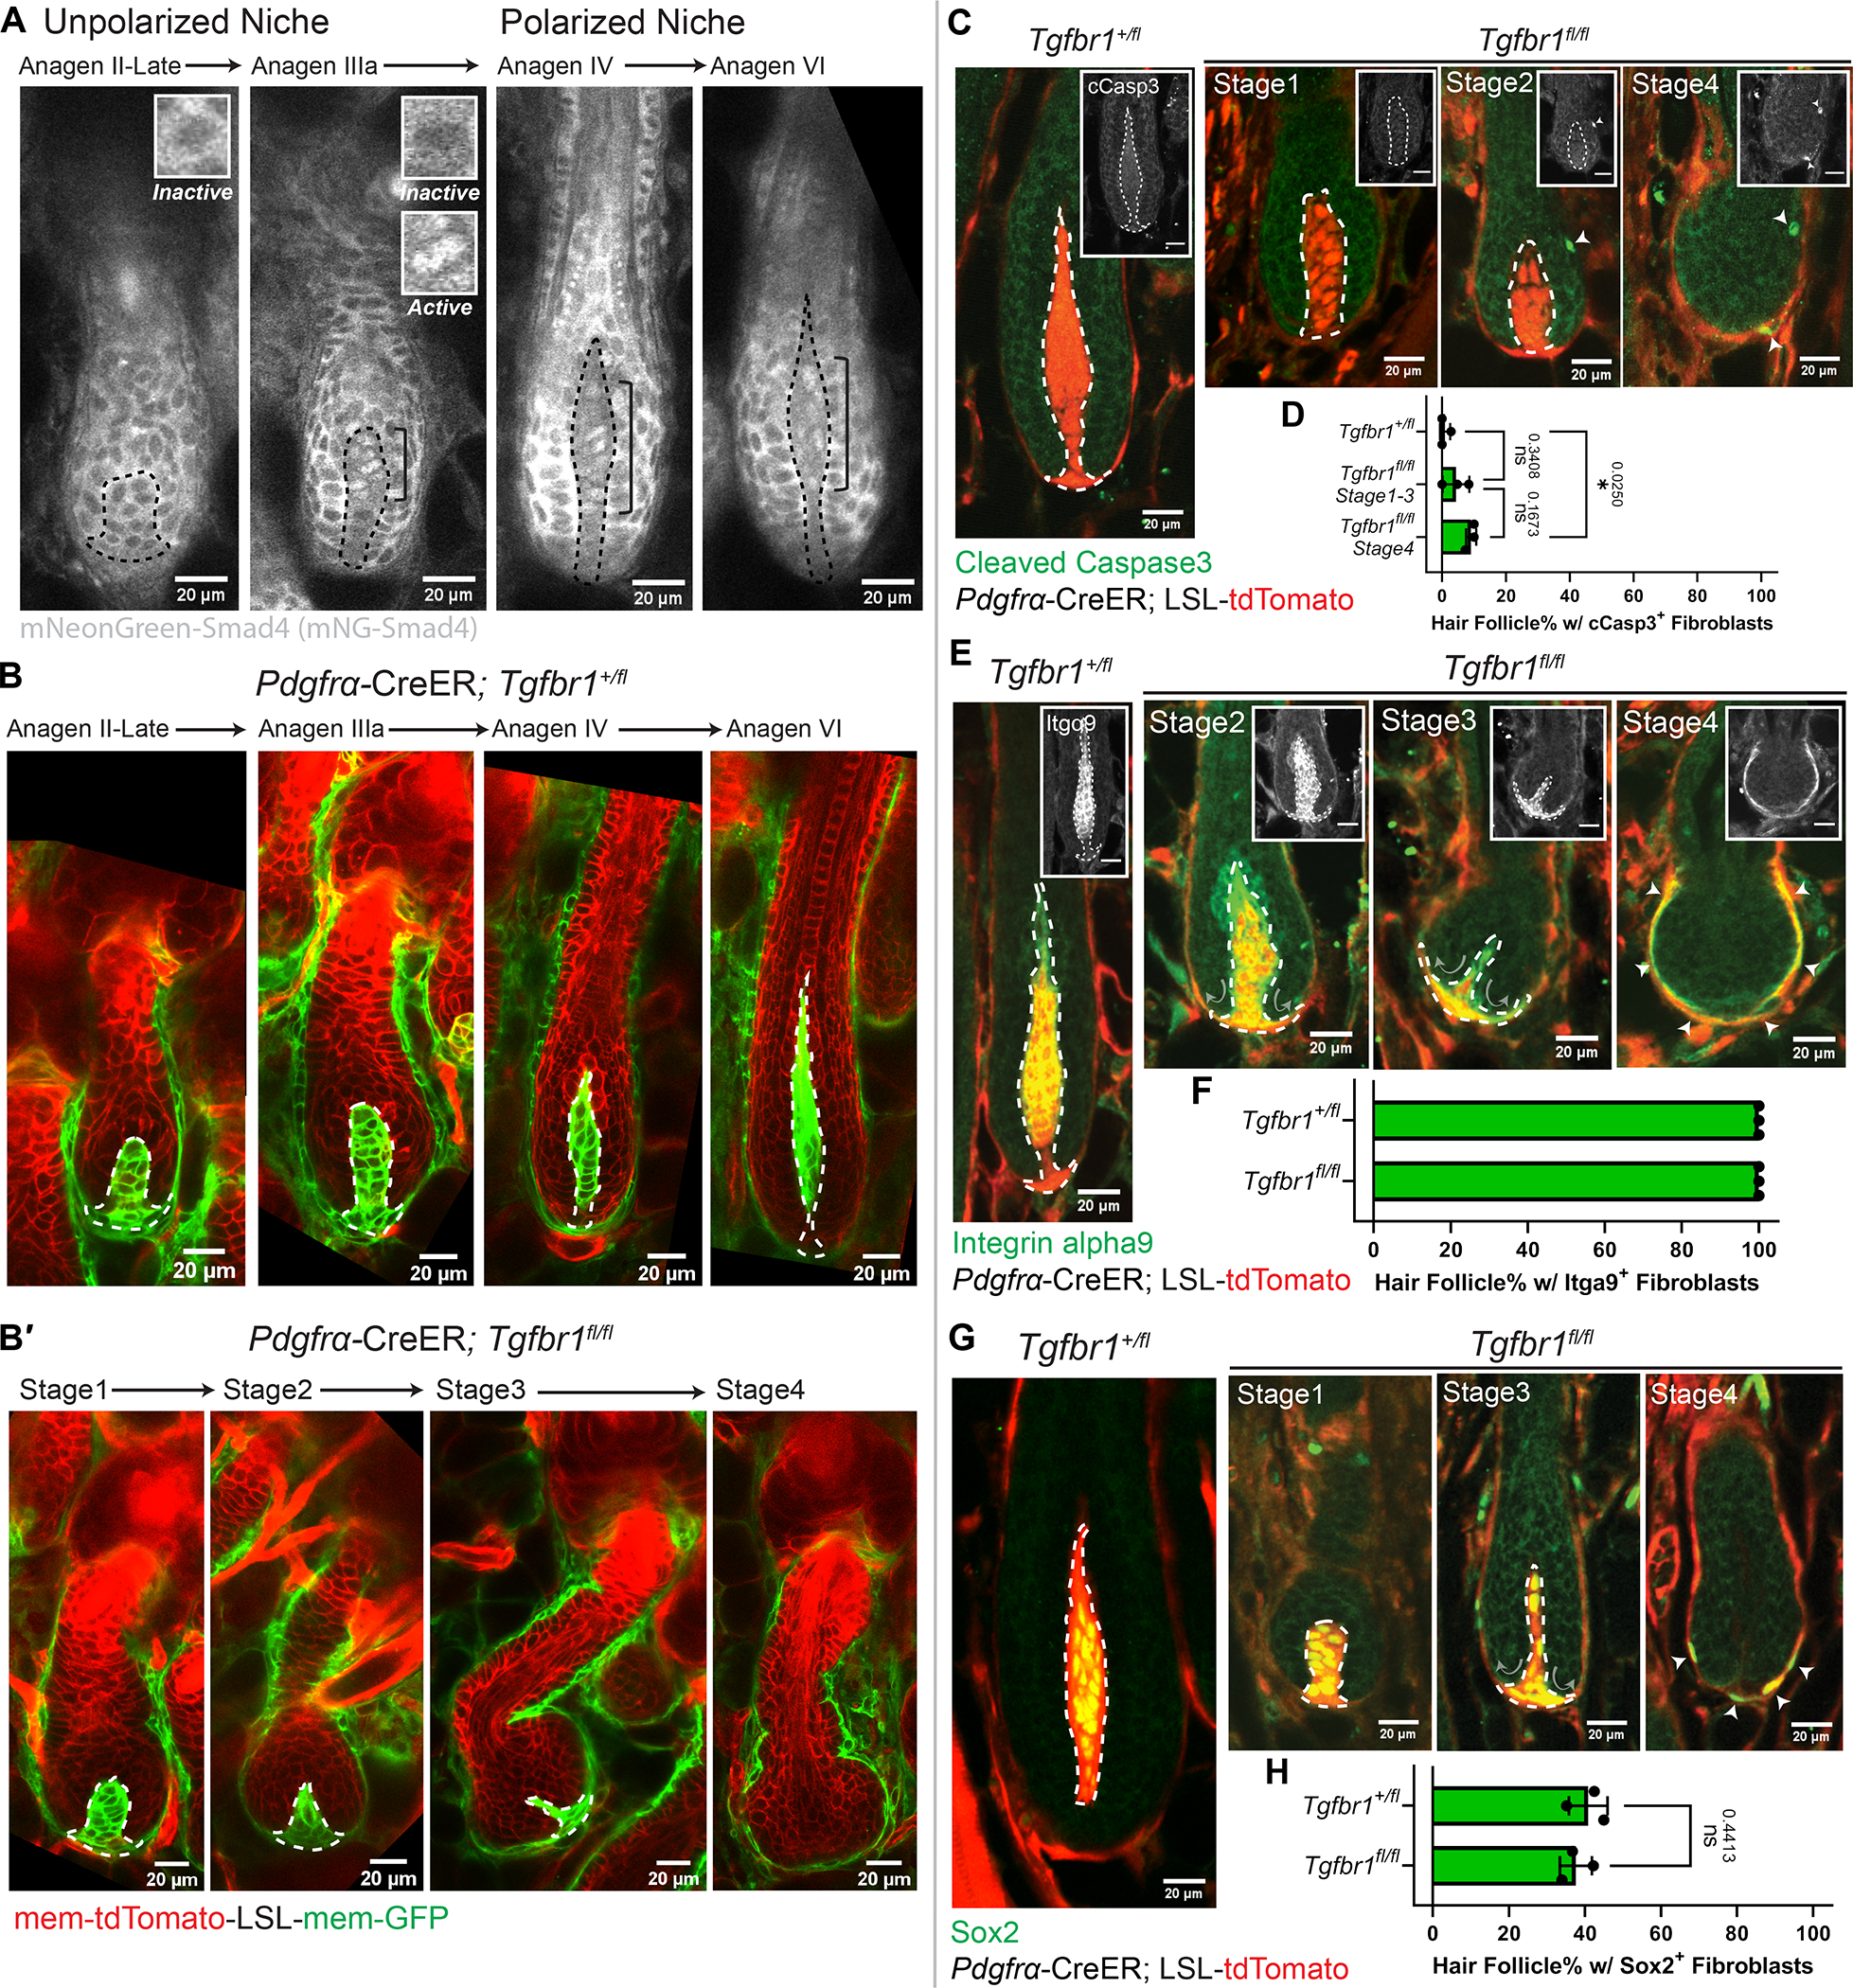
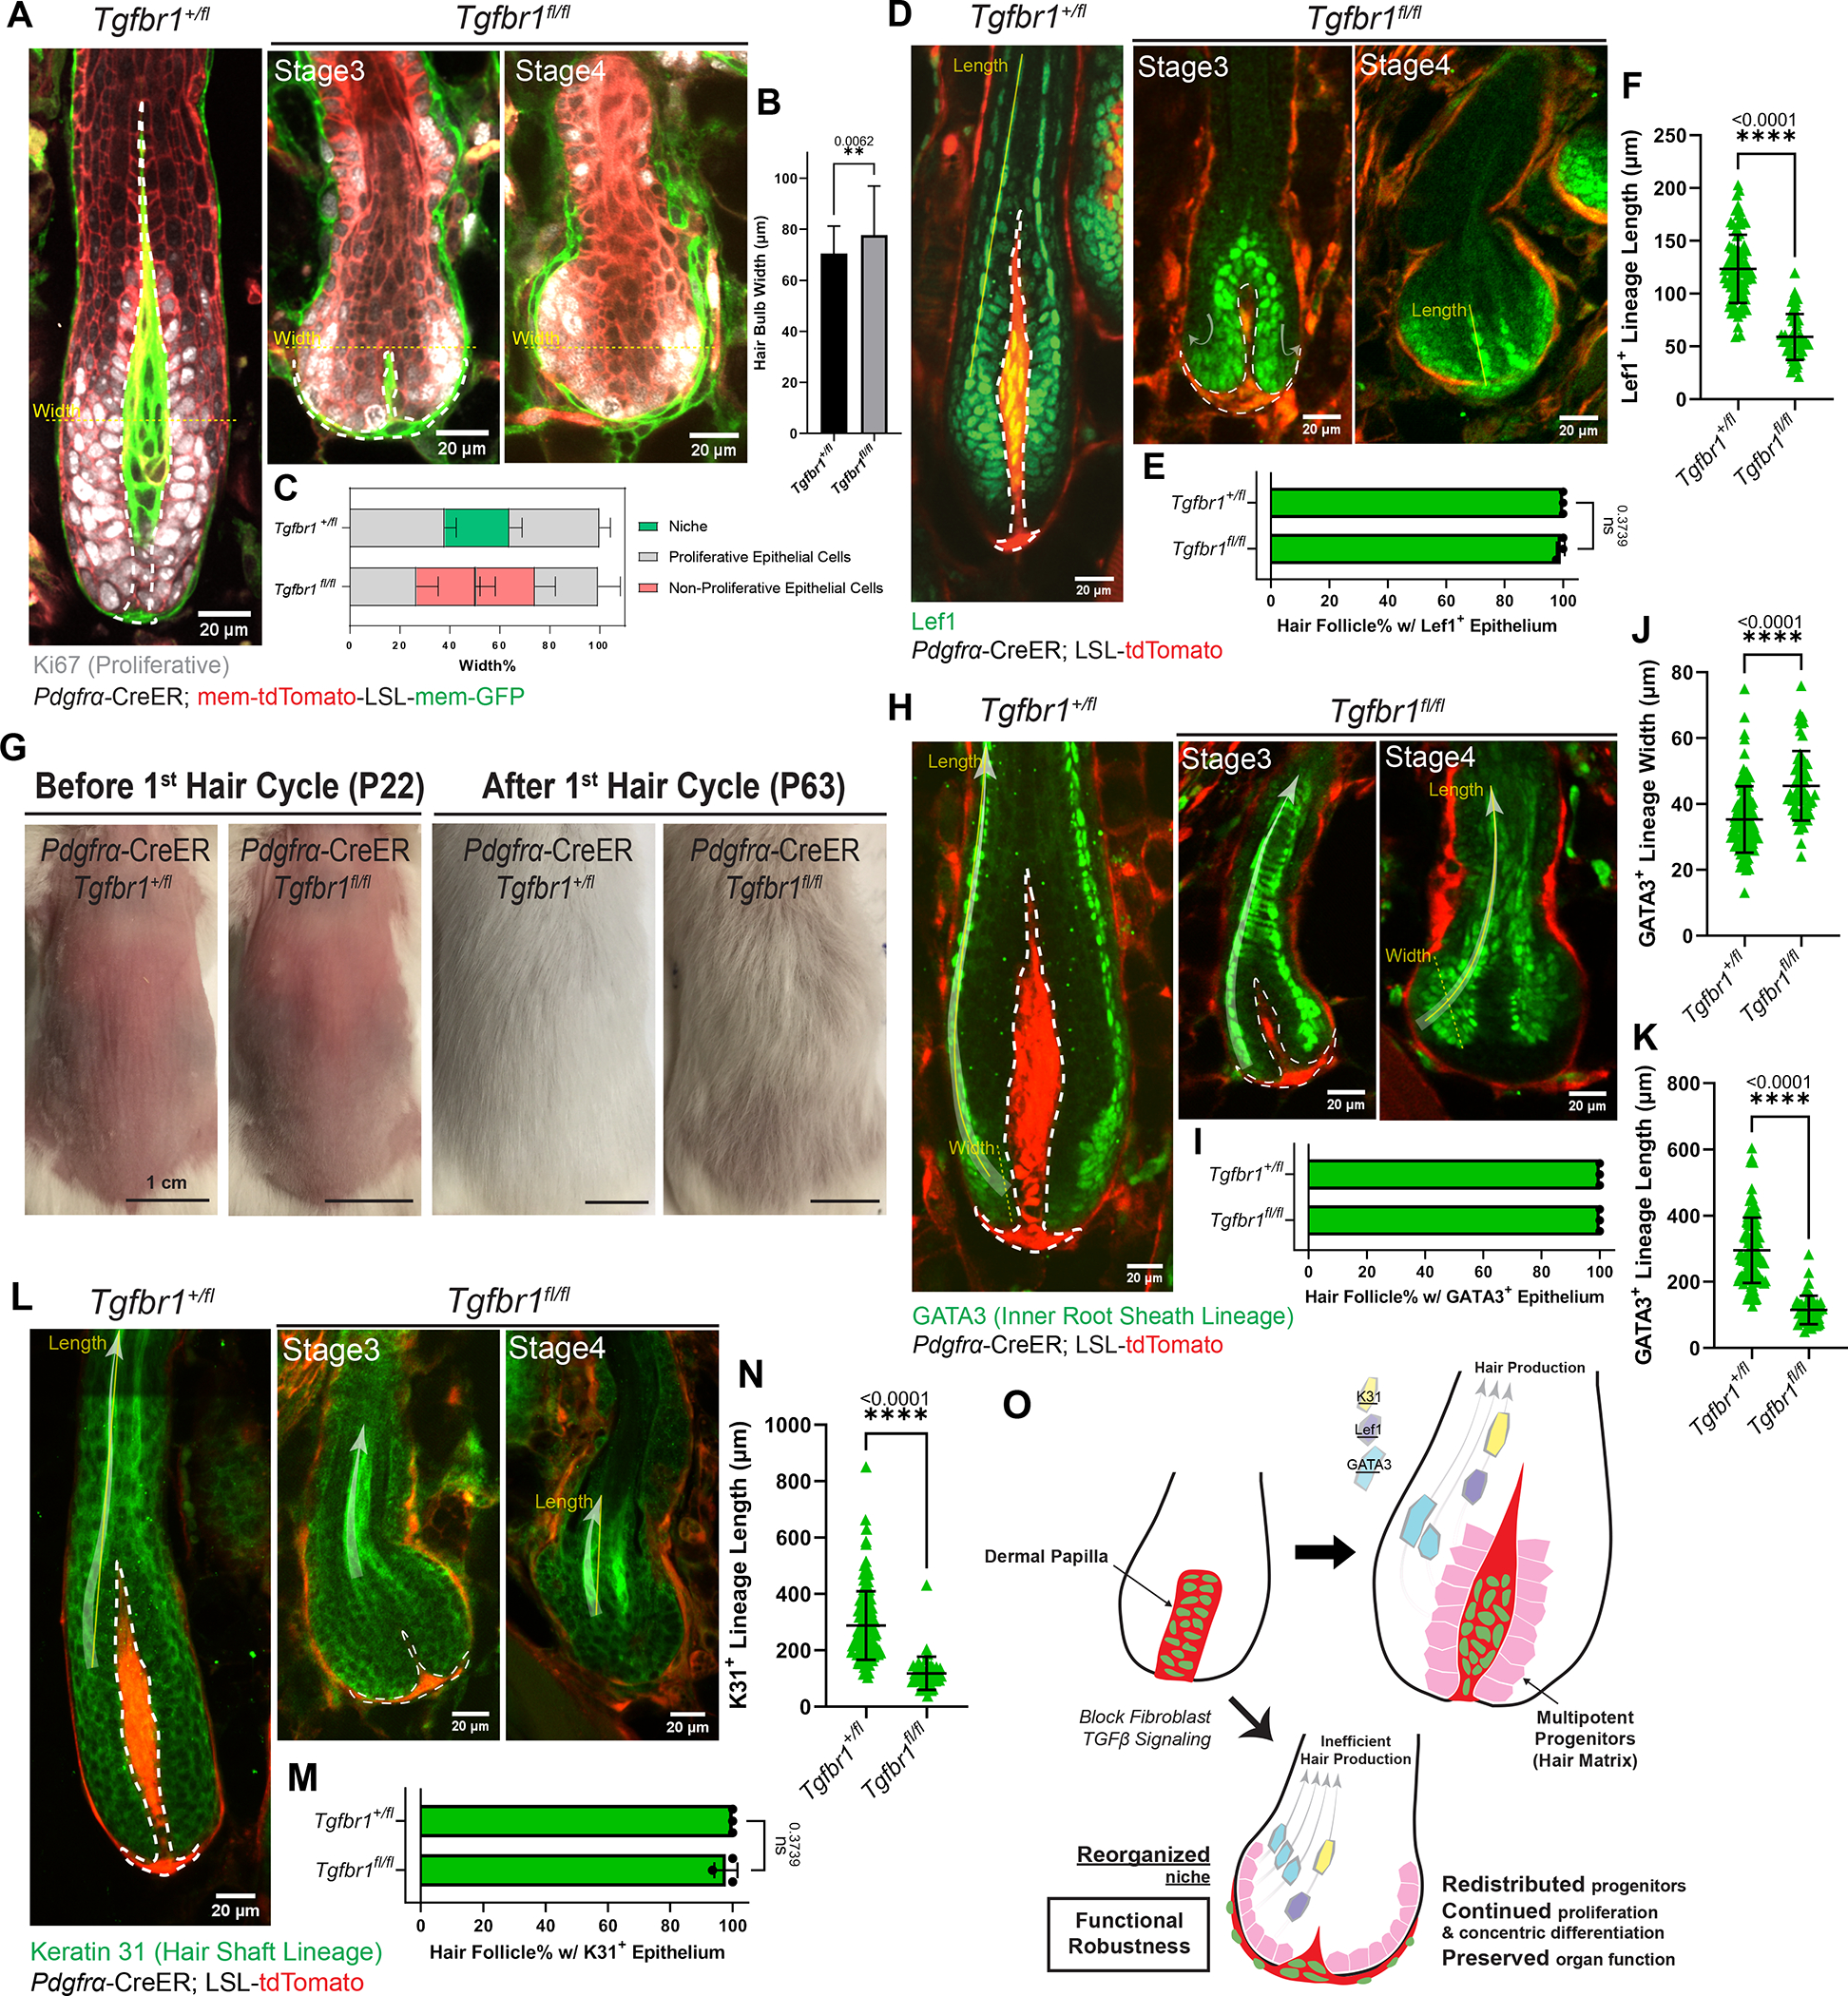
The ability of stem cells to build and replenish tissues depends on support from their niche. Although niche architecture varies across organs, its functional importance is unclear. During hair follicle growth, multipotent epithelial progenitors build hair via crosstalk with their remodeling fibroblast niche, the dermal papilla, providing a powerful model to functionally interrogate niche architecture. Through mouse intravital imaging, we show that dermal papilla fibroblasts remodel individually and collectively to form a morphologically polarized, structurally robust niche. Asymmetric TGF-β signaling precedes morphological niche polarity, and loss of TGF-β signaling in dermal papilla fibroblasts leads them to progressively lose their stereotypic architecture, instead surrounding the epithelium. The reorganized niche induces the redistribution of multipotent progenitors but nevertheless supports their proliferation and differentiation. However, the differentiated lineages and hairs produced by progenitors are shorter. Overall, our results reveal that niche architecture optimizes organ efficiency but is not absolutely essential for organ function.

Keywords: hair follicle; intravital imaging; regeneration; skin fibroblasts; stem cell niche; tissue architecture.


Conflict of interest statement

Declaration of interests The authors declare no competing interests.

Figures

Figure 1.
Figure 1.. Niche cells undergo collective polarization to build a morphologically polarized architecture
A. Intravitally imaged dermal papilla (DP, outlined) at the hair follicle late-growth stage (n=3 mice). DP fibroblasts are labeled with membrane-tdTomato. Gray squares illustrate adjacent multipotent progenitors, with arrows indicating their differentiation routes. (A′) 3D reconstructed DP (red outlined) based on its membrane-tdTomato signal. Fibroblast cell bodies are rendered into surfaces with different colors. B. Percentage of fibroblasts whose cell bodies are located at DP exterior. Exterior-localized: any fibroblasts whose cell body directly contacts DP edge; interior-localized: a fibroblast cell body surrounded by other fibroblasts’ cell bodies. n=30 quiescent and 30 late-growth HFs from 3 mice. C. Intravitally imaged single fibroblast at late-growth stage (n=3 mice). (C′-C″) Long membrane protrusions extend through other fibroblasts. (C‴) 3D reconstructed single fibroblast based on its membrane-GFP signal. Within the red-outlined DP, this fibroblast’s cell body is rendered into a pink surface and its entire membrane in a green surface. D. Coverage percentage of DP fibroblast clones at late growth, as the length of fibroblast cell body or entire membrane relative to the entire DP length. n=103 fibroblast clones from 3 mice. E. Longitudinal imaging of a representative DP fibroblast from early to late-growth (n=3 mice). Insets highlight membrane-GFP (gray) and fibroblast cell body (arrowheads). F. Percentage of DP fibroblasts harboring certain direction of membrane protrusions at late growth. n=77 fibroblast clones from 3 mice. G. Longitudinally imaging of the same DP from mid- to late-growth. The membrane protrusion compartment (red line) on top of the cell body compartment (green line) organizes a morphologically polarized niche at late-growth (Anagen IIIc-VI), in contrast to an unpolarized niche at mid-growth (late Anagen II-IIIb). H. Length of DP compartments at mid-growth (unpolarized niche) and late-growth stage (polarized niche). Lengths of membrane protrusion and cell body compartments are significantly different between the polarized and unpolarized niche stages. n=117 unpolarized DPs and 102 polarized DPs from 3 mice. DPs are dash-lined. In Fig.1C, E, a single fibroblast is labeled by mosaic recombined membrane-GFP (mTmG) under the fibroblast driven CreER (Pdgfrα-CreER). In Fig.1G, fibroblast nuclei are labeled in green (Pdgfrα-H2BGFP) and cell membranes are in red (membrane-tdTomato). All data are presented as mean ± S.D. Unpaired two-tailed t-test is used in Fig.1B, D, H. Tukey’s multiple comparisons test is used in Fig.1F. See also Figure S1, Data S1 (Movie).
Figure 2.
Figure 2.. Polarized niche confers a structurally robust architecture despite the loss of its constituent cells
A. The same unpolarized and polarized dermal papillae (DPs, dash-lined) longitudinally imaged before and after diphtheria toxin (DTA) induced fibroblast ablation. Ablation is achieved by tamoxifen activated Cre in fibroblasts (Pdgfrα-CreER) and LSL-DTA. Fibroblast nuclei are labeled in green (Pdgfrα-H2BGFP) and cell membranes are in red (membrane-tdTomato). B. The number of fibroblasts that remain enclosed within the hair follicle (HF) epithelium after DTA-induced fibroblast ablation. Fibroblast number is counted based on green fibroblast nuclear signal labeled by Pdgfrα-H2BGFP. For unpolarized DPs at mid-growth, n=41 (Day0–1), 53 (Day4–5), and 60 (Day6–7) from 3 mice; for polarized DPs at late-growth, n=72 (Day0–1), 78 (Day4–5), and 71 (Day6–7) from 3 mice. C. Length of entire DPs that remain enclosed after ablation. Based on the reported critical threshold of DP fibroblast number, we classified DP as either with abundant (14 to 32) or few (0 to 13) enclosed fibroblasts. For unpolarized DPs, n=42 HFs (14–32 fibroblasts) and 99 HFs (0–13 fibroblasts) from 3 mice; For polarized DPs, n=77 HFs (14–32 fibroblasts) and 110 HFs (0–13 fibroblasts) from 3 mice. D. Percentage of HFs that remain enclosed DPs after fibroblast ablation. For HFs with unpolarized DPs, n=3 mice (68 HFs at Day0–1, 68 HFs at Day4–5, and 66 HFs at Day6–7); for HFs with polarized DPs, n=3 mice (102 HFs at Day0–1, 108 HFs at Day4–5, and 89 HFs at Day6–7). E. Schematic of forming a polarized DP niche architecture that is structurally more robust even after fibroblast ablation. Green indicates DP fibroblast nuclei and red indicates their membranes. All data are presented as mean ± S.D. Mixed-effects analysis is used in Fig.2B. Tukey’s multiple comparisons test is used in Fig.2C, D. See also Figure S1.
Figure 3.
Figure 3.. Niche architecture and location are actively maintained through fibroblast TGFβ signaling
A. Intravital imaging of TGFβ signaling reporter, mNeonGreen-Smad4 (gray), in hair follicles (HFs) at different stages (n=3 mice). Nuclear-localized Smad4 is present in dermal papilla (DP) fibroblasts within the bracket. Insets show inactive (cytoplasmic) or active (nuclear) Smad4 signals. B-B′. Intravitally imaged Tgfbr1+/fl and Tgfbr1fl/fl HFs at mid and late-growth stages (B, Tgfbr1+/fl late Anagen II-VI; B′, Tgfbr1fl/fl Stage1–4) after CreER induction at the quiescent stage (n=3 mice). Fibroblast membranes are in green membrane-GFP and other membranes are in red membrane-tdTomato. C. Immunostaining for cleaved Caspase3 (cCasp3, green) in thick back skin sections to detect apoptosis at different stages. Arrowheads indicate cCasp3 signal. Insets show cCasp3 in gray (Scale bar=20μm). D. Percentage of HFs containing cCasp3+ fibroblasts. N=3 Tgfbr1+/fl mice (280 late-growth HFs), n=3 Tgfbr1fl/fl mice (49 HFs at Stage1–3, 81 HFs at Stage4). Tukey’s multiple comparisons test. E. Immunostaining for Integrin alpha9 (Itgα9, green) in thick back skin sections to detect DP identity at different stages. Arrowheads indicate Itgα9+ regions in Tgfbr1fl/fl Stage4. Arrows indicate the reorganizing direction of DP fibroblasts. Insets show Itgα9 in gray (Scale bar=20μm). F. Percentage of HFs containing Itgα9+ fibroblasts. N=3 Tgfbr1+/fl mice (234 late-growth HFs), n=3 Tgfbr1fl/fl mice (144 HFs from stages shown). G. Immunostaining for Sox2 (green) in thick back skin sections to detect DP identity at different stages. Arrowheads indicate Sox2+ regions in Tgfbr1fl/fl Stage4. Arrows indicate the reorganizing direction of DP fibroblasts. H. Percentage of HFs containing Sox2+ fibroblasts. N=3 Tgfbr1+/fl mice (594 late-growth HFs), n=3 Tgfbr1fl/fl mice (226 HFs from stages shown). Unpaired two-tailed t-test. DPs are dash-lined. In Fig.3C, E, G, fibroblasts are labeled in red by Pdgfrα-CreER; LSL-tdTomato. All data are presented as mean ± S.D. See also Figure S2–3, Data S2 (Movie).
Figure 4.
Figure 4.. Reorganized niche induces redistribution of multipotent progenitors but largely supports their function
A. Immunostaining for Ki67 (gray) in ear skin whole mounts to detect proliferative epithelial cells in hair follicles (HFs) at different stages. Fibroblast membranes are in green (Pdgfrα-CreER; membrane-GFP) and other membranes are in red (membrane-tdTomato). B. Hair bulb maximal width in Tgfbr1+/fl and Tgfbr1fl/fl at yellow dash-line locations in Fig.4A. n=75 HFs from three Tgfbr1+/fl mice, n=62 HFs from three Tgfbr1fl/fl mice. C. Spatial distribution of cell populations (niche, proliferative epithelial cells, non-proliferative epithelial cells) in the bulb region, measured as the width percentage of each population at maximal hair bulb width (yellow dash-lines in Fig.4A). n=75 HFs from three Tgfbr1+/fl mice, n=62 HFs from three Tgfbr1fl/fl mice. D. Immunostaining for Lef1 (green) in thick back skin sections to detect multipotent progenitors and Wnt/β-catenin signaling at different stages. The redistribution directions are marked by arrows. E. Percentage of HFs containing Lef1+ epithelial populations in the bulb region. n=3 Tgfbr1+/fl mice (215 late-growth HFs), n=3 Tgfbr1fl/fl mice (93 HFs from stages shown). F. Length of Lef1+ differentiating lineage along the differentiation routes (yellow solid line in Fig.4D). n=81 late-growth HFs from three Tgfbr1+/fl mice, n=49 Stage4 HFs from three Tgfbr1fl/fl mice. G. Representative photos of mice with back skin shaved at the quiescent stage, and revisited after an entire first hair cycle. n=3 Tgfbr1+/fl and 3 Tgfbr1fl/fl mice. H. Immunostaining for GATA3 (green) in thick back skin sections to detect the differentiation of inner root sheath lineages (Cuticle and Huxley’s layer) at different stages. The differentiation routes are marked with arrows. I. Percentage of HFs containing GATA3+ epithelial populations in concentric organizations. n=3 Tgfbr1+/fl mice (328 late-growth HFs), n=3 Tgfbr1fl/fl mice (103 HFs from stages shown). J. Width of GATA3+ differentiating lineage at the beginning of differentiation routes (yellow dash line in Fig.4H). n=109 late-growth HFs from three Tgfbr1+/fl mice, n=59 Stage4 HFs from four Tgfbr1fl/fl mice. K. Length of GATA3+ differentiating lineage along the differentiation routes (yellow solid line in Fig.4H). n=112 late-growth HFs from three Tgfbr1+/fl mice, n=51 Stage4 HFs from four Tgfbr1fl/fl mice. L. Immunostaining for Keratin 31 (K31, green) in thick back skin sections to detect the differentiation of hair shaft lineage (Cortex) at different stages. The differentiation routes are marked with arrows. M. Percentage of HFs containing K31+ epithelial populations in concentric organizations. n=3 Tgfbr1+/fl mice (243 late-growth HFs), n=3 Tgfbr1fl/fl mice (109 HFs from stages shown). N. Length of K31+ differentiating lineage along the differentiation routes (yellow solid line in Fig.4L). n=132 late-growth HFs from three Tgfbr1+/fl mice, n=44 Stage4 HFs from three Tgfbr1fl/fl mice. O. Schematic illustrating that reorganized niche architecture continues supporting redistributed proliferative multipotent progenitors. However, progenitor differentiation is rerouted and generates shorter lineages for less efficient hair production. Dermal papillae are dash-lined. In Fig.4D, H, L, fibroblasts are labeled in red by Pdgfrα-CreER; LSL-tdTomato. All data are presented as mean ± S.D. and analyzed with unpaired two-tailed t-test. See also Figure S2, S4.

References

    1. Xin T, Greco V, and Myung P (2016). Hardwiring Stem Cell Communication through Tissue Structure. Cell 164, 1212–1225. 10.1016/j.cell.2016.02.041. - DOI - PMC - PubMed
    1. Fuchs E, and Blau HM (2020). Tissue Stem Cells: Architects of Their Niches. Cell Stem Cell 27, 532–556. 10.1016/j.stem.2020.09.011. - DOI - PMC - PubMed
    1. O’Brien LE, and Bilder D (2013). Beyond the niche: tissue-level coordination of stem cell dynamics. Annu Rev Cell Dev Biol 29, 107–136. 10.1146/annurev-cellbio-101512-122319. - DOI - PMC - PubMed
    1. Lane SW, Williams DA, and Watt FM (2014). Modulating the stem cell niche for tissue regeneration. Nat Biotechnol 32, 795–803. 10.1038/nbt.2978. - DOI - PMC - PubMed
    1. Plikus MV, Wang X, Sinha S, Forte E, Thompson SM, Herzog EL, Driskell RR, Rosenthal N, Biernaskie J, and Horsley V (2021). Fibroblasts: Origins, definitions, and functions in health and disease. Cell 184, 3852–3872. 10.1016/j.cell.2021.06.024. - DOI - PMC - PubMed

Publication types

Substances

LinkOut - more resources