. 2023 Aug 14;41(8):1407-1426.e9.
doi: 10.1016/j.ccell.2023.06.005. Epub 2023 Jul 6.

Evolution of immune and stromal cell states and ecotypes during gastric adenocarcinoma progression

Affiliations

Evolution of immune and stromal cell states and ecotypes during gastric adenocarcinoma progression

Ruiping Wang et al. Cancer Cell. .

Abstract

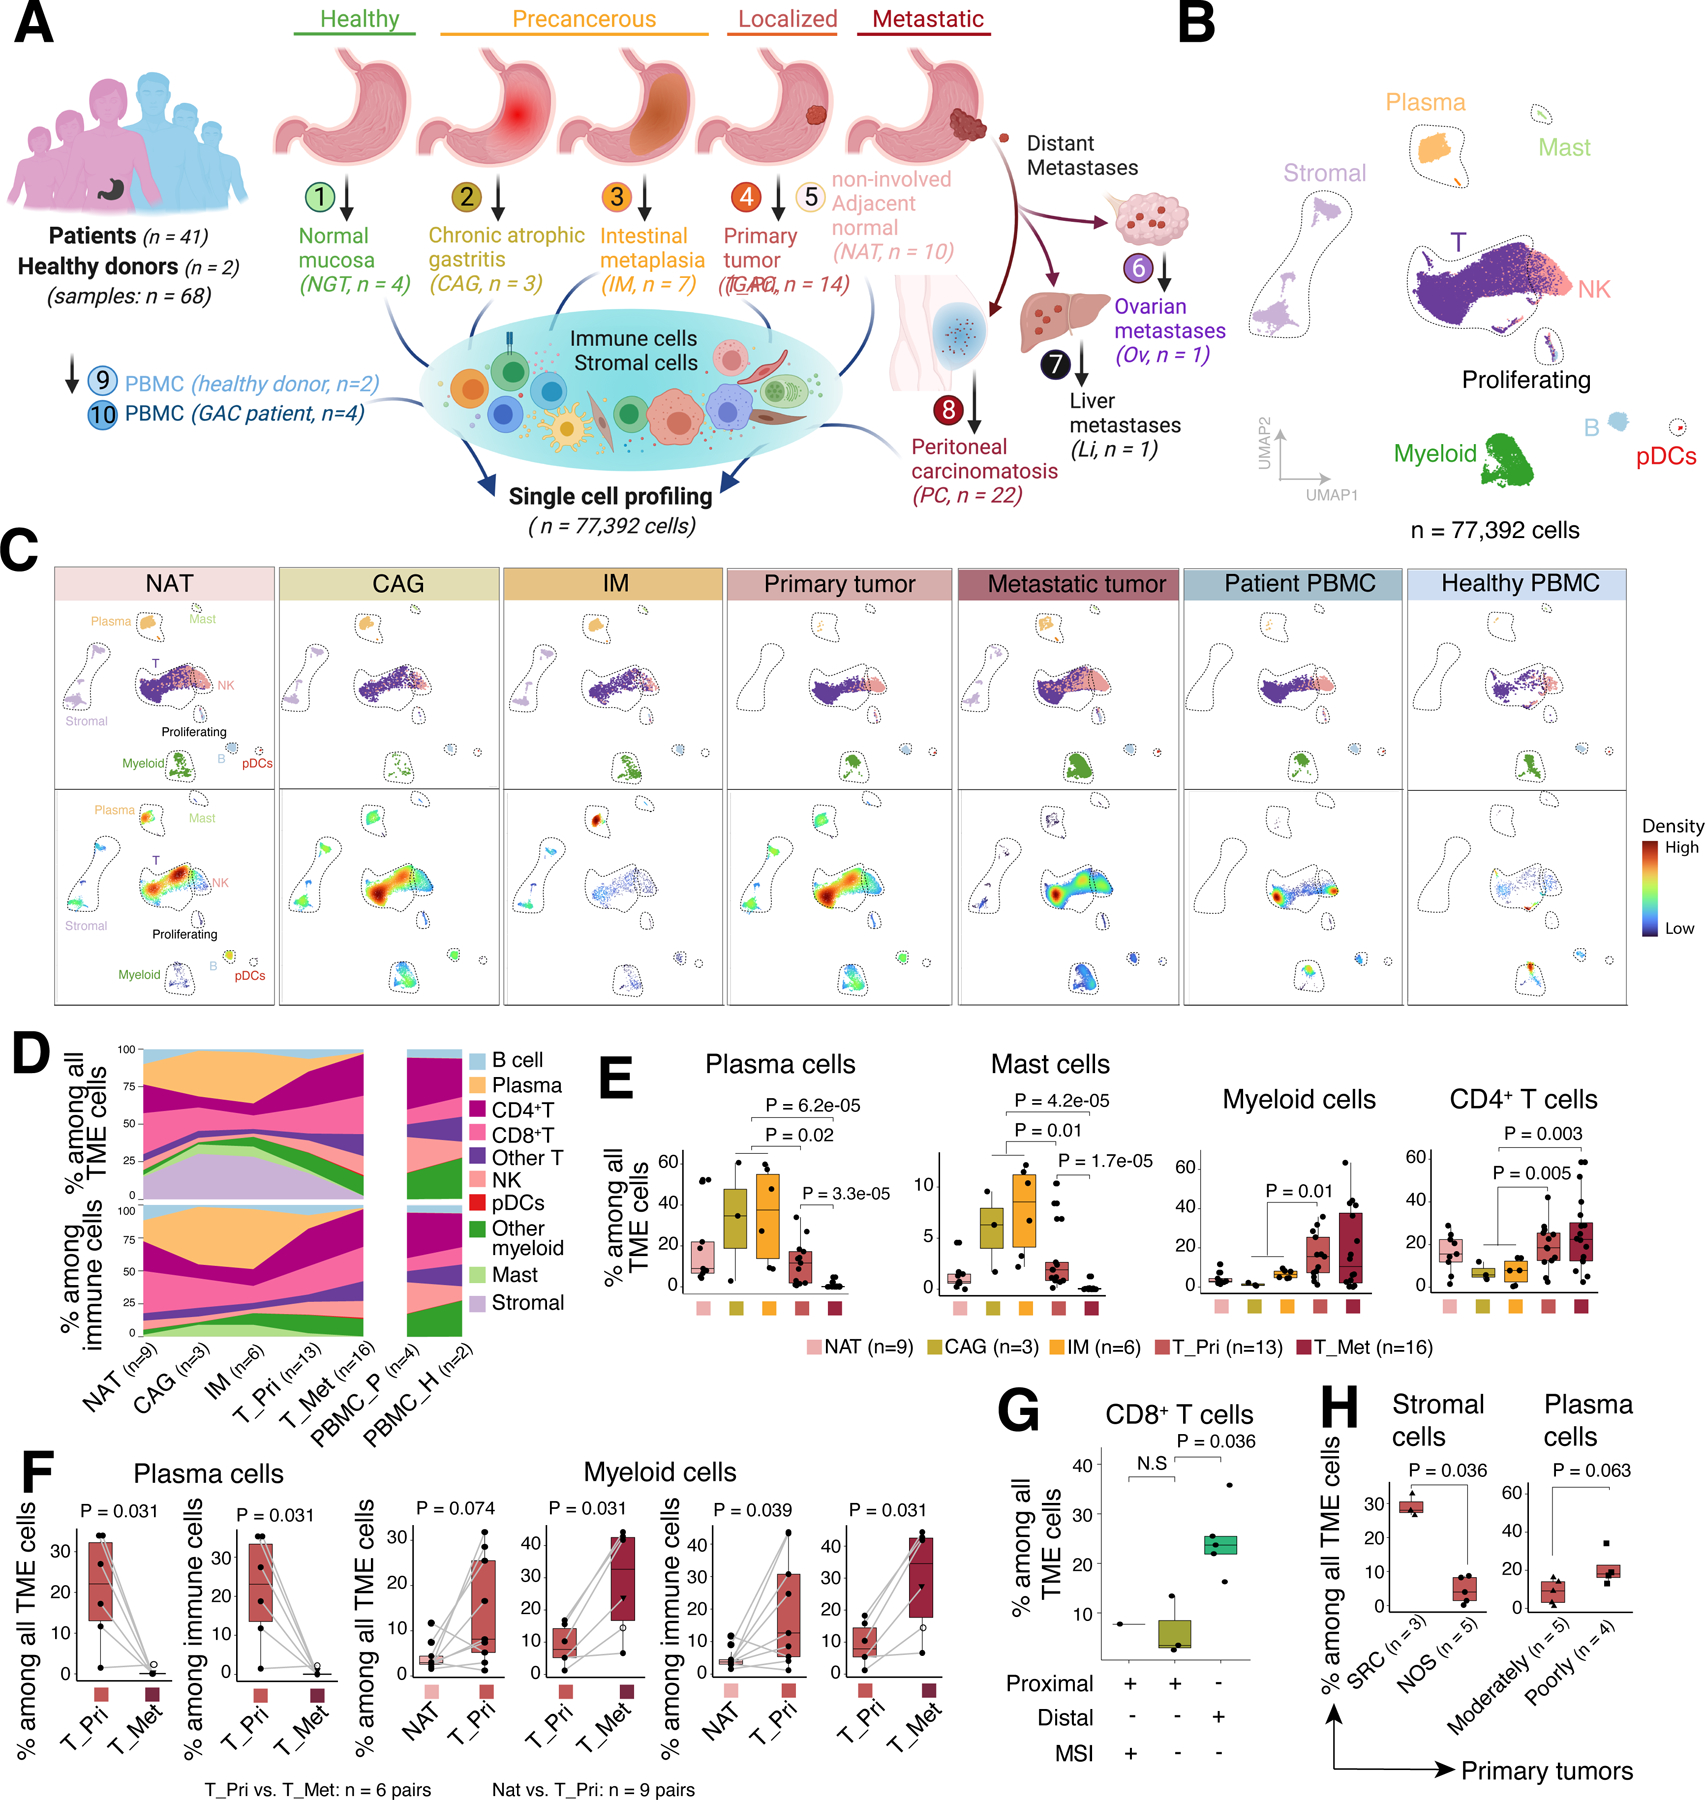
Understanding tumor microenvironment (TME) reprogramming in gastric adenocarcinoma (GAC) progression may uncover novel therapeutic targets. Here, we performed single-cell profiling of precancerous lesions, localized and metastatic GACs, identifying alterations in TME cell states and compositions as GAC progresses. Abundant IgA+ plasma cells exist in the premalignant microenvironment, whereas immunosuppressive myeloid and stromal subsets dominate late-stage GACs. We identified six TME ecotypes (EC1-6). EC1 is exclusive to blood, while EC4, EC5, and EC2 are highly enriched in uninvolved tissues, premalignant lesions, and metastases, respectively. EC3 and EC6, two distinct ecotypes in primary GACs, associate with histopathological and genomic characteristics, and survival outcomes. Extensive stromal remodeling occurs in GAC progression. High SDC2 expression in cancer-associated fibroblasts (CAFs) is linked to aggressive phenotypes and poor survival, and SDC2 overexpression in CAFs contributes to tumor growth. Our study provides a high-resolution GAC TME atlas and underscores potential targets for further investigation.

Keywords: Cancer-associated fibroblast; Chronic Atrophic Gastritis; Ecotype; Gastric Adenocarcinoma; Immune-Stroma Crosstalk; Intestinal Metaplasia; Peritoneal Carcinomatosis; Single Cell RNA Sequencing; Syndecan 2; Tumor Microenvironment.


Conflict of interest statement

Declaration of interests The authors declare no competing interests.

Figures

Figure 1.
Figure 1.. Single-Cell Landscape of Immune and Stromal Cells at Different Stages of GACs.
(A) Schematic depicting the study design, created with BioRender.com. (B) UMAP view of major cell lineages. (C) UMAP plots, as in (B), showing TME cell clusters (upper panels) and cell density (lower panels) across tissue groups. (D) Compositions of total TME cells (upper panels) and immune cells (lower panels) across tissue groups. Only samples with ≥ 200 TME cells and groups with ≥ 2 samples were included. T_Pri, primary GAC; T_Met, metastatic GAC; PBMC_P, PBMCs from patients; PBMC_H, PBMCs from healthy donors. (E) The proportions of four representative cell types across tissue groups. Only samples with ≥ 200 TME cells were included. (F) Paired comparisons of cell proportions of plasma cells and myeloid cells among paired samples from the same patients (linked by grey lines). Triangle denotes ovarian metastasis and open circle denotes liver metastasis. P values were calculated by paired two-sided Wilcoxon rank sum test. (G) Box plots comparing the proportions of CD8+ T cells across defined sample groups. (H) The proportions of representative cell types among all TME (left) or immune cells (right) between defined sample groups. Box, median +/− interquartile range. Whiskers, minimum and maximum. For (E, G, H), P values were calculated by two-sided Wilcoxon rank sum test. See also Figure S1 and Table S1.
Figure 2.
Figure 2.. Characterization of T cell States.
(A) UMAP view of 7 CD4+ T cell clusters. (B) UMAP view of 10 CD8+ T cell clusters. (C) Expression levels and frequencies of selected markers across CD8+ T cell clusters. (D) Heatmap showing tissue prevalence estimated by the ratio of observed to expected cell numbers with the chi-square test (Ro/e) for each CD4+ (upper panels) and CD8+ (lower panels) T cell subsets. Top bar plot showing cell composition and right bar plot showing tissue composition. (E) The cellular proportions of representative CD4+/CD8+ T cell subsets across tissue groups for this study. Only samples with ≥ 50 total CD4+ or CD8+ T cells were included. (F) Same as in (E) showing the single-cell cohort from Kumar et al. (G) Monocle trajectory inference of CD8+ T cells, colored by their corresponding pseudotime. (H) Same as in (G) but displayed by tissue origins. (I) Cell density plots for CD8+ T cell subsets along the pseudotime. (J) Expression dynamics of representative genes in different tissues (color coded), along the pseudotime. (E, F) P values were calculated by one-way Kruskal-Wallis rank sum test. Box, median +/− interquartile range. Whiskers, minimum and maximum. See also Figure S2 and Table S2.
Figure 3.
Figure 3.. Characterization of Myeloid, B, and stromal cell populations.
(A) UMAP view of myeloid cell clusters. (B) Expression levels and frequencies of genes composing the M1-like, M2-like, angiogenesis, phagocytosis signatures, and checkpoint genes across myeloid cell clusters. Only genes (expressed in ≥ 20% cells in at least one of the myeloid cell subsets) are shown. (C) Expression levels of 4 gene signatures across myeloid cell clusters. (D) The proportions of 2 myeloid cell subsets across tissue groups. Only samples with ≥ 50 cells were included. P values across different tissues were calculated by one-way Kruskal-Wallis rank sum test and P values between T_pri and T_Met were calculated by two-sided Wilcoxon rank sum test. (E) The odds ratios and P values based on transcriptome similarity with their corresponding cell subsets from primary GACs or PBMCs, indicating the likely origins of myeloid cells in PC ascites samples. P values were calculated by two-sided Fisher’s exact test. (F) UMAP view of B and plasma cell clusters. (G) Heatmap showing tissue prevalence estimated by Ro/e score for each B/plasma cell subsets. Top bar plots showing cell compositions and right bar plot showing tissue compositions. (H) The cellular proportions of IgA+ plasma cells across tissue groups with available H. pylori status. Only samples with ≥ 50 total TME cells were included. Number of samples (from left to right): 3, 7, 4, 3, respectively. (I) UMAP view of stromal cell clusters. (J) Tissue prevalence estimated by Ro/e score for each stromal cell subset. (K) Correlation coefficient between cell proportions of Endo_C7 and other TME cell subsets. Only statistically significant (P < 0.05) positive (red) and negative (green) correlations are shown. Correlation coefficient and P values were calculated by Spearman’s correlation test. (L) Expression of 4 representative immune checkpoint genes across tissue groups. Box, median +/− interquartile range. Whiskers, minimum and maximum. See also Figures S3, S4 and Tables S2, S3.
Figure 4.
Figure 4.. Phenotypic relationships and population abundance of 62 TME cell subpopulations.
(A) Unsupervised hierarchical clustering of 62 TME cell subsets. The heatmap shows the expression of inflammation and cytokine gene signatures (top panels), tissue prevalence estimated by Ro/e score (middle panels), and their prognostic significance in 4 primary GAC cohorts (bottom panels) as evaluated by univariable Cox regression analysis. (B) Correlation among 62 TME cell subsets in 58 samples, based on their relative population abundance among all TME cells. P values were calculated by Spearman correlation test with Benjamini–Hochberg correction for multiple comparisons.
Figure 5.
Figure 5.. Ecotypes of TME cells and their clinical relevance.
(A) Six ecotypes (EC1–6) inferred based on TME cell compositions in the 58 samples. (B) Network plots based on the Jaccard similarity index of cell population co-existence. (C) Representative histology images for various tissue groups. (D) The composition of detected ecotypes in primary GACs. (E) Deconvolution analysis of TCGA STAD cohort. Heatmap on the left shows the identification of EC3-like and EC6-like ecotypes. The alluvial plots in the middle depict relationships between the two cellular ecotypes and Lauren’s histology types, as well as previously defined molecular subtypes. The Kaplan–Meier plots on the right display survival correlations of the two cellular ecotypes in all GACs, CIN subtype GACs, and diffuse type GACs, respectively. (F) The same as in (E), showing deconvolution analyses of another primary GAC cohort. See also Figure S5 and Tables S4–S6.
Figure 6.
Figure 6.. SDC2 Upregulation in Tumor Stromal Cells.
(A) Bubble plots (upper panel) show expression levels and proportions of immunomodulatory genes across TME cell clusters. The heatmap (lower panel) depict their prognostic significance in 4 primary GAC cohorts using univariable Cox regression model. (B) SDC2 expression levels across different cell subsets in 3 independent single-cell cohorts. (C-D) SDC2 expression levels across fibroblast subsets in this study (C) and the Kumar et al. cohort (D). (E) Correlations between the proportions of SDC2+ fibroblasts and expression levels of CAF signature scores. P values were calculated by Spearman correlation tests. (F) Expression of SDC2 in fibroblasts and VSMCs across tissue groups in this study. P values were calculated by one-way Kruskal-Wallis rank sum test. (G) SDC2 expression in fibroblasts of normal and primary tumor samples in the scRNA-seq data from Kumar et al. (H) Dual immunofluorescent staining of SDC2 and Vimentin. Representative images of intestinal and diffuse type of GAC tissues are shown. (I) SDC2 expression in EC3-like (n=232) and EC6-like (n=177) groups identified in Figure 6E. Box, median +/− interquartile range. Whiskers, minimum and maximum. (J-K) Increased SDC2 expression in diffuse (vs. intestinal) type of GAC tissues in this study (J) and the Kumar et al. cohort (K). (L) SDC2 expression in fibroblasts between matched peritoneal metastases (implants) and ascites cells obtained from the same GAC patients (n = 13). (C-D, G, I, J-K) P values were calculated by two-sided Wilcoxon rank sum test. See also Figures S6, S7, and Table S3.
Figure 7.
Figure 7.. Prognostic Significance of SDC2 Upregulation in GAC Cohorts and the Effect of SDC2 Overexpression in CAFs on Tumor Growth in Mouse Models.
(A) Kaplan–Meier plots illustrating prognostic significance of SDC2 upregulation across 4 primary GAC cohorts. P values were calculated by log-rank test. (B) Schematic depicting the study design of an independent primary GAC cohort to validate clinical relevance of SDC2 overexpression at protein level. (C) Composition of patients with SDC2-positive or SDC2-negative statuses as determined by IHC staining of normal and tumor tissues (left), and early (stage I or II) or late stages (stage III or IV) (right). P values were calculated by two-sided Fisher’s exact tests. (D) The prognostic significance of SDC2 staining positivity in this cohort. P values were calculated by log-rank test. (E) Univariate and multivariate Cox proportional regression outcomes for this validation cohort, with age, gender, differentiation status, Lauren’s type, tumor stage, and SDC2 IHC included. CI, confidence interval; TNM, tumor, node, metastases. (F-J) Effect of SDC2-overexpressed CAF in the xenografted mice. In vivo tumor growth of co-subcutaneous injection of patient-derived PC tumor cells (GA0518) and cancer-associated fibroblasts (CAFs) with SDC2-overexpression (OE) as GF0818-SDC2 is shown. GA0518 cells labeled with mCherry-Luciferase (GA0518-mCh2) as tumor cells plus GF0818-SDC2 or corresponding empty vector transfected GF0818 cells (GF0818-EV) as CAFs were subcutaneously co-injected into five female SCID mice with two injection sites per mice. (F) Bioluminescent images by luciferase in representative mice at three time points post-injection. (G) Quantification of tumor size expressed as total bioluminescence intensity of injection sites at each time points. Box, median +/− interquartile range. Whiskers, minimum and maximum. (H) Tumor growth measured twice a week with a digital caliper over time. (I) Macro images of the excised subcutaneous tumor mass upon sacrifice. No tumors were observed in four injection sites of the EV control group and one injection site of SDC2 group at endpoint. One mouse in the SDC2 group was euthanized because of tumor ulceration before endpoint. (J) Tumor weights of the extracted subcutaneous tumors at the endpoint. Data represent mean ± SD from five mice. *, P < 0.05; **, P < 0.01; ***, P < 0.001 vs. empty vector control (two-sided Wilcoxon rank sum test) See also Figure S7.

References

    1. Bray F, Ferlay J, Soerjomataram I, Siegel RL, Torre LA, and Jemal A (2018). Global cancer statistics 2018: GLOBOCAN estimates of incidence and mortality worldwide for 36 cancers in 185 countries. CA Cancer J Clin 68, 394–424. 10.3322/caac.21492. - DOI - PubMed
    1. Tan HL, Chia CS, Tan GHC, Choo SP, Tai DWM, Chua CWL, Ng MCH, Soo KC, and Teo MCC (2019). Metastatic gastric cancer: Does the site of metastasis make a difference? Asia-Pacific Journal of Clinical Oncology 15, 10–17. - PubMed
    1. Sugarbaker PH (2019). Prevention and treatment of peritoneal metastases: a comprehensive review. Indian Journal of Surgical Oncology 10, 3–23. - PMC - PubMed
    1. Hirao M, Yamada T, Michida T, Nishikawa K, Hamakawa T, Mita E, Mano M, and Sekimoto M (2018). Peritoneal seeding after gastric perforation during endoscopic submucosal dissection for gastric cancer. Digestive surgery 35, 457–460. - PubMed
    1. Yoshida M, Sugino T, Kusafuka K, Nakajima T, Makuuchi R, Tokunaga M, Tanizawa Y, Bando E, Kawamura T, and Terashima M (2016). Peritoneal dissemination in early gastric cancer: importance of the lymphatic route. Virchows Archiv 469, 155–161. - PubMed

Publication types