. 2023 Oct;193(10):1548-1567.
doi: 10.1016/j.ajpath.2023.06.008. Epub 2023 Jul 5.

Different Mouse Models of Nemaline Myopathy Harboring Acta1 Mutations Display Differing Abnormalities Related to Mitochondrial Biology

Affiliations

Different Mouse Models of Nemaline Myopathy Harboring Acta1 Mutations Display Differing Abnormalities Related to Mitochondrial Biology

Jennifer A Tinklenberg et al. Am J Pathol. 2023 Oct.

Abstract

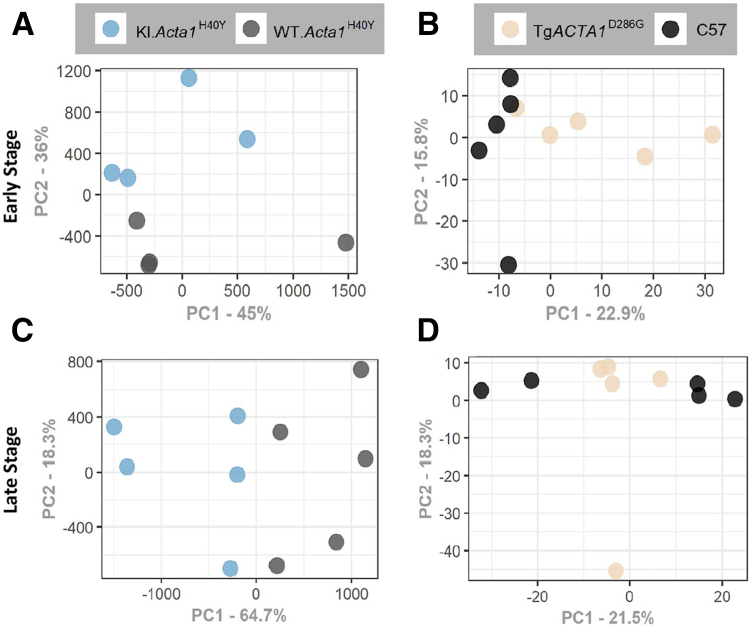
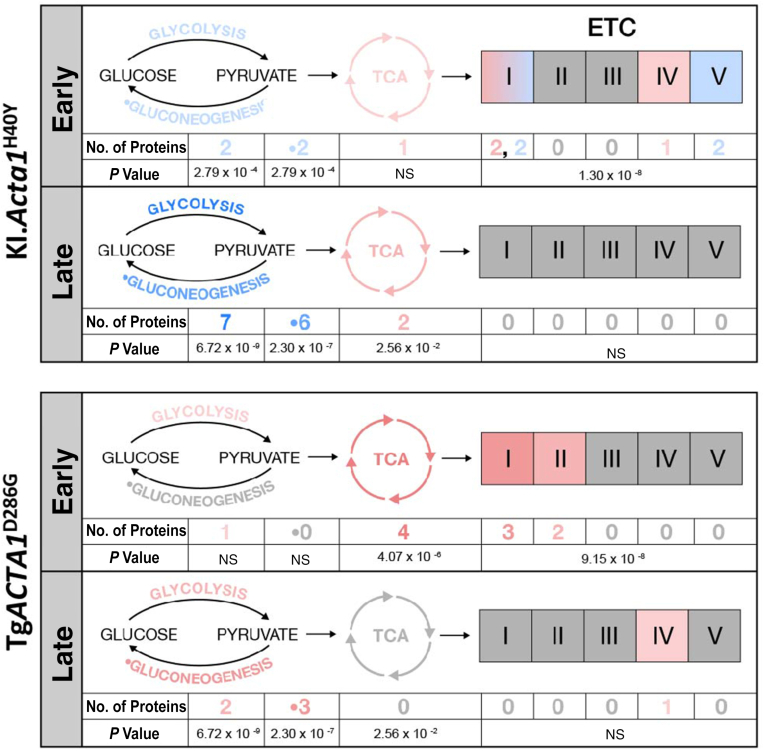
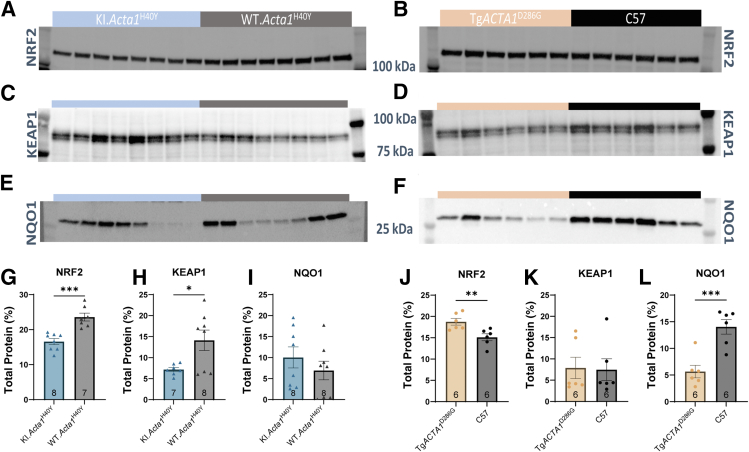
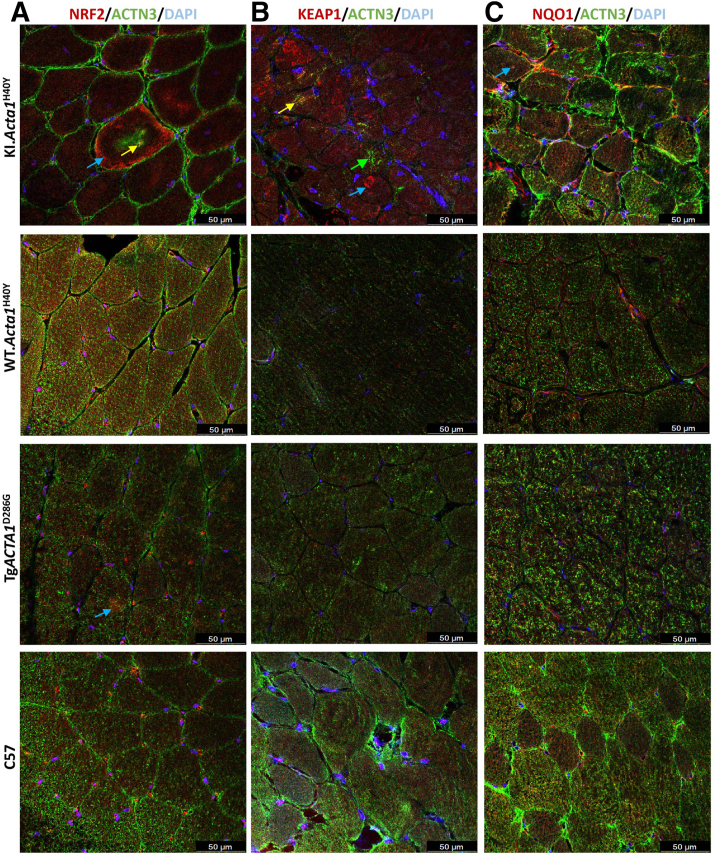
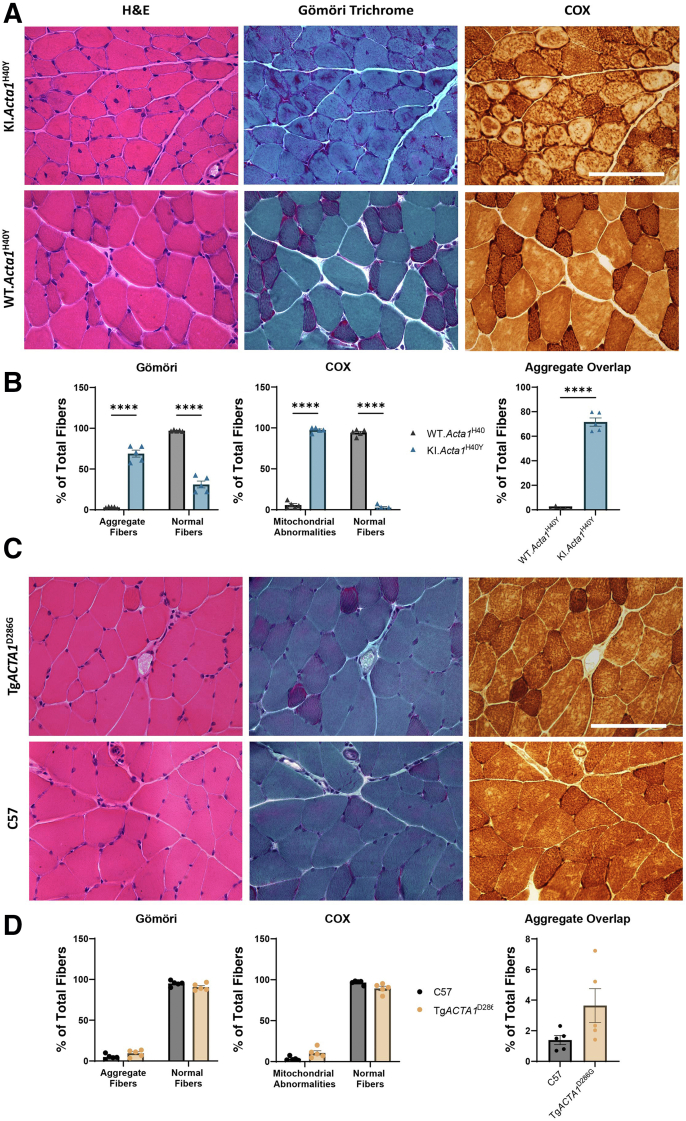
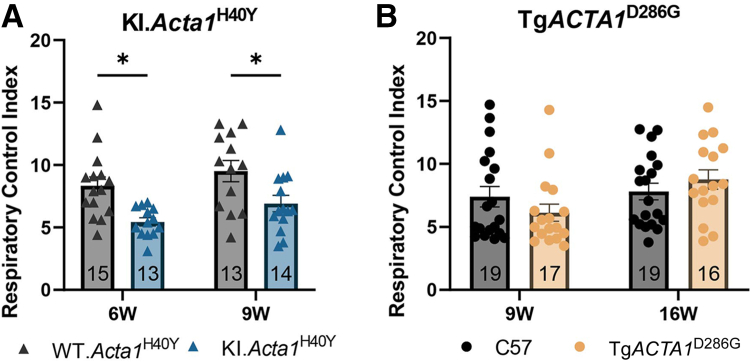
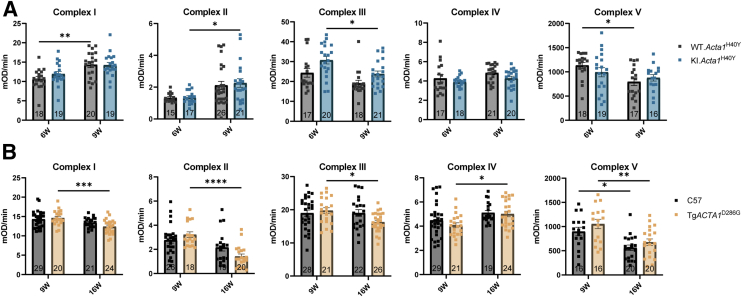
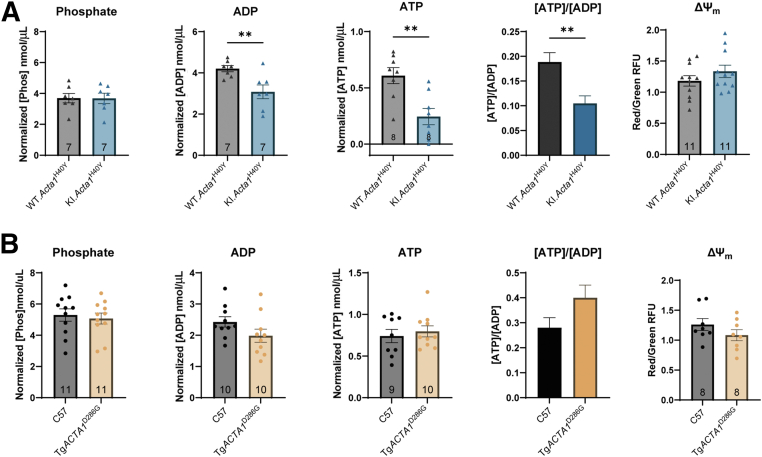
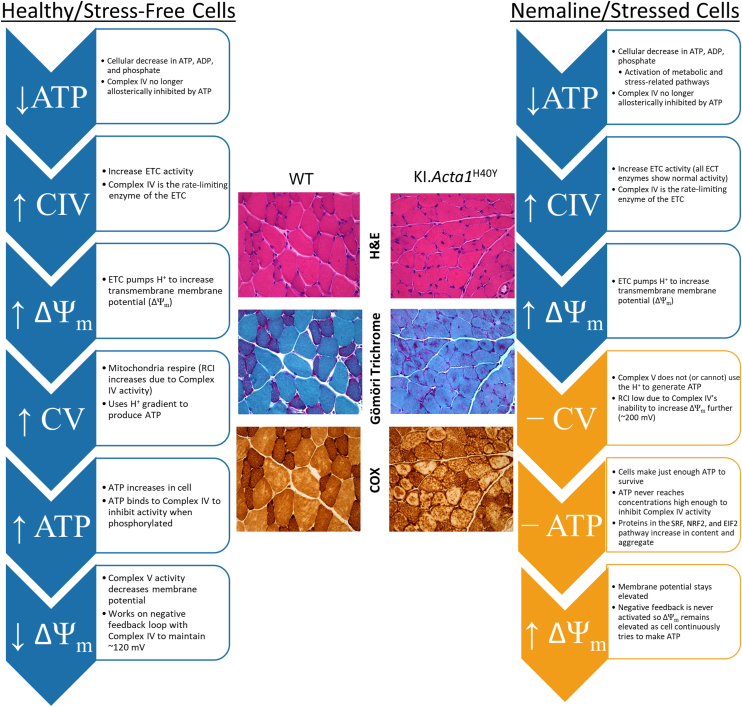
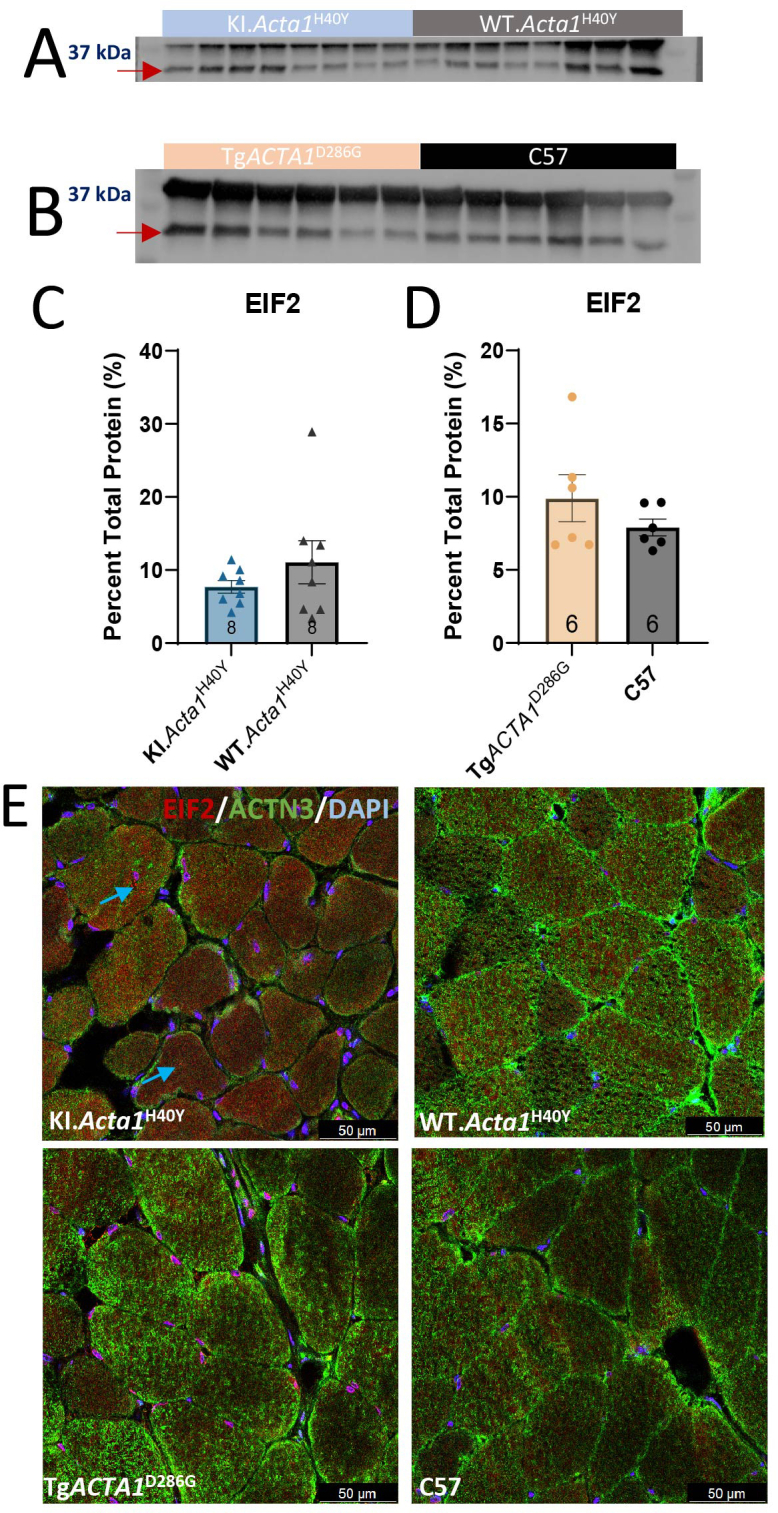
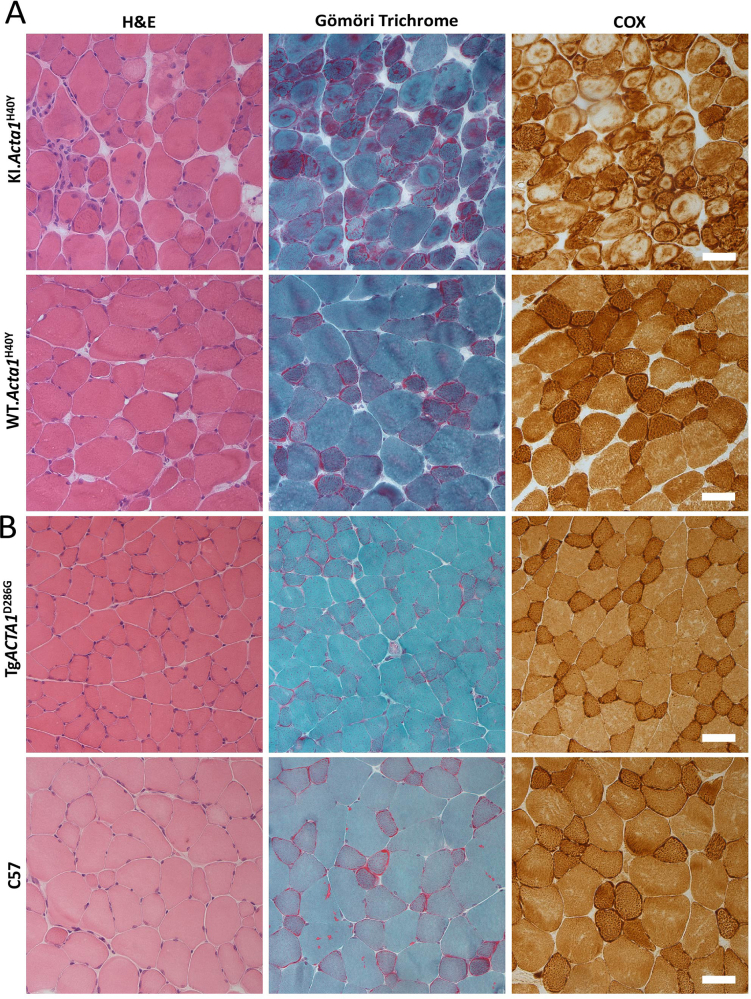
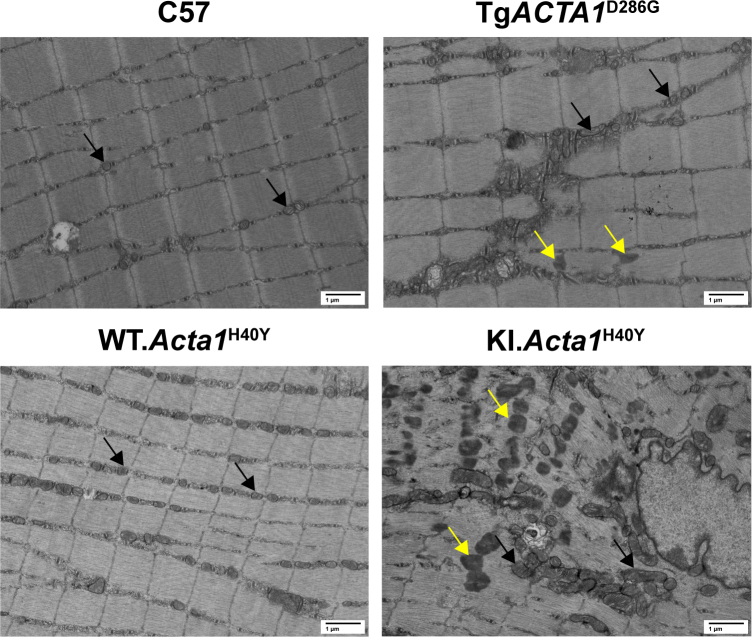
ACTA1 encodes skeletal muscle-specific α-actin, which polymerizes to form the thin filament of the sarcomere. Mutations in ACTA1 are responsible for approximately 30% of nemaline myopathy (NM) cases. Previous studies of weakness in NM have focused on muscle structure and contractility, but genetic issues alone do not explain the phenotypic heterogeneity observed in patients with NM or NM mouse models. To identify additional biological processes related to NM phenotypic severity, proteomic analysis was performed using muscle protein isolates from wild-type mice in comparison to moderately affected knock-in (KI) Acta1H40Y and the minimally affected transgenic (Tg) ACTA1D286G NM mice. This analysis revealed abnormalities in mitochondrial function and stress-related pathways in both mouse models, supporting an in-depth assessment of mitochondrial biology. Interestingly, evaluating each model in comparison to its wild-type counterpart identified different degrees of mitochondrial abnormality that correlated well with the phenotypic severity of the mouse model. Muscle histology, mitochondrial respiration, electron transport chain function, and mitochondrial transmembrane potential were all normal or minimally affected in the TgACTA1D286G mouse model. In contrast, the more severely affected KI.Acta1H40Y mice displayed significant abnormalities in relation to muscle histology, mitochondrial respirometry, ATP, ADP, and phosphate content, and mitochondrial transmembrane potential. These findings suggest that abnormal energy metabolism is related to symptomatic severity in NM and may constitute a contributor to phenotypic variability and a novel treatment target.


Figures

Figure 1
Figure 1
Principal component (PC) analysis of nemaline myopathy mouse models. A: Principal component analysis of KI.Acta1H40Y early-stage versus wild-type (WT) differential expression data sets. B: Principal component analysis of TgACTA1D286G early-stage versus WT differential expression data sets. C: Principal component analysis of KI.Acta1H40Y late-stage versus WT differential expression data sets. D: Principal component analysis of TgACTA1D286G late-stage versus WT differential expression data sets.
Figure 2
Figure 2
Canonical pathways and protein expression related to energetic metabolism and stress-related pathways are affected differently in each model at each stage. Number of proteins refers to the number of differentially expressed proteins in each data set. Pink represents an increase in expression, whereas blue represents a decrease, with the relative amount of change indicated by the shade of the colors. ETC, electron transport chain; NS, not significant; TCA, tricarboxylic acid.
Figure 3
Figure 3
Nuclear factor erythroid 2–related factor 2 (NRF2) pathway protein expression is differentially affected in two Acta1 nemaline myopathy models. A and G: NRF2 expression is decreased between KI.Acta1H40Y and wild-type (WT) animals at late stage. B and J: NRF2 expression is significantly increased in the TgACTA1D286G animals versus their WT counterparts at late stage (P = 0.009). C, D, H, and K: Kelch-like ECH-associated protein 1 (KEAP1) expression is decreased in the KI.Acta1H40Y animals and not changed in the TgACTA1D286G animals at late stage. E and I: NAD(P)H dehydrogenase [quinone] 1 (NQO1) protein expression is not different in the KI.Acta1H40Y animals versus their WT counterparts at late stage. F and L: NQO1 expression is significantly decreased in the TgACTA1D286G animals at late stage. ∗P < 0.05, ∗∗P < 0.01, and ∗∗∗P < 0.001. C57, C57Bl/6J.
Figure 4
Figure 4
Nuclear factor erythroid 2–related factor 2 (NRF2) pathway protein localization is differentially affected in two Acta1 nemaline myopathy models. A: NRF2 is localized to aggregates separate to nemaline rods in the KI.Acta1H40Y and TgACTA1D286G animals at late stage. B: Kelch-like ECH-associated protein 1 (KEAP1) is mislocalized to cytoplasmic aggregates in the KI.Acta1H40Y animals but has normal localization in the TgACTA1D286G animals at late stage. C: NAD(P)H dehydrogenase [quinone] 1 (NQO1) localizes to cytoplasmic aggregates and nemaline rods in the KI.Acta1H40Y animals at late stage. NQO1 localization is not altered in the TgACTA1D286G animals at late stage. (Blue arrows indicate cytoplasmic aggregates; green arrows, nemaline rods; and yellow arrows, co-localization with nemaline rods.) Scale bars = 50 μm (AC). ACTN3, alpha-actinin 3.
Figure 5
Figure 5
Structural differences are seen in the Acta1 mouse models of nemaline myopathy. A: KI.Acta1H40Y animals had smaller muscle fibers on hematoxylin and eosin (H&E) stain and significant aggregation on Gömöri trichrome stain. KI.Acta1H40Y animals also had a unique staining pattern on cytochrome oxidase (COX) that highlights both mitochondrial aggregates as well as areas where mitochondria appear nearly absent. B: KI.Acta1H40Y animals had a significant number of cells with aggregates on Gömöri trichrome stain and a significant number of cells with abnormal mitochondria compared with wild-type (WT) animals. There was also significant overlap in the cells with aggregates on the Gömöri trichrome stain with cells that had abnormal mitochondria on the COX stain, indicating that some aggregates seen on the Gömöri stain were not nemaline rods, but mitochondrial aggregates. C: TgACTA1D286G animals had minimal muscle pathology on H&E, Gömöri trichrome, or COX stains compared with WT animals. D: TgACTA1D286G animals did not have significant increases in the number of cells with aggregates on the Gömöri trichrome stain or cells with mitochondrial abnormalities with the COX stain. There was also no significant overlap of aggregate cells with mitochondrial abnormalities. ∗∗∗∗P < 0.0001. Scale bar = 100 μm (A and C). Original magnification, ×400 (A and C). C57, C57Bl/6J.
Figure 6
Figure 6
Mitochondrial respirometry in Acta1 mice. A: KI.Acta1H40Y mice had a significant reduction in respiratory control index at both 6 and 9 weeks when compared with wild-type (WT) littermates. B: TgACTA1D286G mice had no significant differences in mitochondrial respirometry at either 9 or 16 weeks when compared with C57Bl/6J (C57) animals. ∗P < 0.05.
Figure 7
Figure 7
Electron transport chain (ETC) enzyme activity assays in Acta1 mice. Both KI.Acta1H40Y (A) and TgACTA1D286G (B) animals had no significant differences in enzyme function in any complexes of the ETC between wild-type (WT) and mutant animals. However, significant differences were seen between ages of animals within each enzyme. ∗P < 0.05, ∗∗P < 0.01, ∗∗∗P < 0.001, and ∗∗∗∗P < 0.0001. C57, C57Bl/6J; mOD, milli-optical density.
Figure 8
Figure 8
Changes in phosphate, ADP, ATP, and membrane potential in Acta1 mice. A: KI.Acta1H40Y animals had significant decreases in the amount of ATP and ADP, but not phosphate or mitochondrial transmembrane potential (ΔΨm). B: TgACTA1D286G animals had no significant changes to phosphate, ADP, or ATP levels in tissue isolates or any changes in ΔΨm. Phosphate, ADP, and ATP samples were normalized to protein concentration. ∗∗P < 0.01.
Figure 9
Figure 9
Working model of changes in nemaline myopathy (NM) mouse metabolism and stress pathways. Changes in protein expression and stress pathways impact muscle morphology and mitochondrial homeostasis in NM mouse models. ΔΨm, mitochondrial transmembrane potential; CIV, complex IV; COX, cytochrome oxidase; CV, complex V; EIF2, eukaryotic translation initiation factor 2; ETC, electron transport chain; H&E, hematoxylin and eosin; NRF2, nuclear factor erythroid 2–related factor 2; RCI, respiratory control index; SRF, serum response factor.
Supplemental Figure S1
A: Volcano plot representing differentially expressed proteins in the KI.Acta1H40Y early-stage quadriceps versus their wild-type (WT) counterpart. B: TgACTA1D286G early-stage quadriceps versus their WT counterpart. C: KI.Acta1H40Y late-stage quadriceps versus their WT counterpart. D: TgACTA1D286G late-stage quadriceps versus their WT counterpart. Dashed lines indicate differentially expressed proteins with fold change of <0.5 or >2.
Supplemental Figure S2
Proteins related to the serum response factor (SRF) pathway are altered in expression to varying degrees in the KI.Acta1H40Y and TgACTA1D286G mice at late stage. A, B, and IM: SRF protein expression is significantly increased in the KI.Acta1H40Y (P = 0.0016) and decreased in the TgACTA1D286G (P = 0.024) mice. CF and JO: Striated muscle activator of Rho signaling (STARS) (C, D, and JN) and myocardin-related transcription factor A (MRTF-A) (E, F, and KO) expression levels are not statistically different between KI.Acta1H40Y and wild-type (WT) mice or TgACTA1D286G and WT mice. G, H, LN, and P: Vinculin expression is statistically significantly increased in the KI.Acta1H40Y mice (P = 0.0004), whereas it was not altered in the TgACTA1D286G mice. (Red arrows indicate the protein band of interest.) ∗P < 0.05, ∗∗P < 0.01, and ∗∗∗P < 0.001.
Supplemental Figure S3
Localization of serum response factor (SRF) pathway proteins is disparately affected in two Acta1 nemaline myopathy models. A: SRF nuclear localization appears to be increased in the KI.Acta1H40Y and TgACTA1D286G animals compared with their wild-type (WT) counterparts at late stage. B: Striated muscle activator of Rho signaling (STARS) is mislocalized to cytoplasmic aggregates in the KI.Acta1H40Y animals but has normal localization in the TgACTA1D286G animals at late stage. C: Myocardin-related transcription factor A (MRTF-A) localizes to nemaline rods in the KI.Acta1H40Y animals at late stage. MRTF-A localization is not altered in the TgACTA1D286G animals at late stage. (Blue arrows indicate cytoplasmic aggregates; and yellow arrow, colocalization with nemaline rods.) Scale bars = 50 μm (AC). ACTN3, alpha-actinin 3; C57, C57Bl/6J.
Supplemental Figure S4
Eukaryotic translation initiation factor 2EIF2) expression is not altered in Acta1 nemaline myopathy, but localization is differentially affected. AD: Total EIF2 expression is not altered in the KI.Acta1H40Y or TgACTA1D286G animals at late stage. E: EIF2 nuclear localization appears to increase in both the KI.Acta1H40Y and TgACTA1D286G animals. The KI.Acta1H40Y animals exhibit punctate cytoplasmic staining in a subset of KI.Acta1H40Y samples. (Red arrows indicate the protein band of interest; and blue arrows, cytoplasmic aggregation.) Scale bars = 50 μm (E). ACTN3, alpha-actinin 3; C57, C57Bl/6J.
Supplemental Figure S5
Histologic staining of early-stage KI.Acta1H40Y and late-stage TgACTA1D286G animals. A: At 6 weeks, KI.Acta1H40Y animals already exhibit small muscle fibers with aggregation on hematoxylin and eosin (H&E) and Gömöri trichrome staining. The abnormal cytochrome oxidase (COX) staining patterns seen at 9 weeks of life are already evident at 6 weeks as well. B: At 16 weeks, the TgACTA1D286G animals maintain minimal pathologic changes on H&E, Gömöri trichrome, or COX stains. Scale bars = 50 μm (A and B).
Supplemental Figure S6
Electron microscopy sectioning shows variable mitochondrial pathology in Acta1 nemaline myopathy animals. Ultrastructural evaluation of skeletal muscle from TgACTA1D286G mice identified rare few nemaline rods (yellow arrows) and no morphologic changes to the mitochondria (black arrows) in comparison to C57Bl/6J (C57) animals. Ultrastructural evaluation of skeletal muscle from KI.Acta1H40Y animals identified nemaline rods, myofibrillar disarray, and clustering and enlargement of mitochondria in some areas, and other areas where there were few mitochondria found in intermyofibrillar spaces. Scale bars = 1 μm. Original magnification, ×15,000.

Similar articles

Cited by

References

    1. North K.N., Laing N.G., Wallgren-Pettersson C. Nemaline myopathy: current concepts: the ENMC international consortium and nemaline myopathy. J Med Genet. 1997;34:705–713. - PMC - PubMed
    1. Sewry C.A., Laitila J.M., Wallgren-Pettersson C. Nemaline myopathies: a current view. J Muscle Res Cell Motil. 2019;40:111–126. - PMC - PubMed
    1. Nilipour Y., Nafissi S., Tjust A.E., Ravenscroft G., Hossein Nejad Nedai H., Taylor R.L., Varasteh V., Pedrosa Domellof F., Zangi M., Tonekaboni S.H., Olive M., Kiiski K., Sagath L., Davis M.R., Laing N.G., Tajsharghi H. Ryanodine receptor type 3 (RYR3) as a novel gene associated with a myopathy with nemaline bodies. Eur J Neurol. 2018;25:841–847. - PubMed
    1. Ryan M.M., Ilkovski B., Strickland C.D., Schnell C., Sanoudou D., Midgett C., Houston R., Muirhead D., Dennett X., Shield L.K., De Girolami U., Iannaccone S.T., Laing N.G., North K.N., Beggs A.H. Clinical course correlates poorly with muscle pathology in nemaline myopathy. Neurology. 2003;60:665–673. - PubMed
    1. Agrawal P.B., Strickland C.D., Midgett C., Morales A., Newburger D.E., Poulos M.A., Tomczak K.K., Ryan M.M., Iannaccone S.T., Crawford T.O., Laing N.G., Beggs A.H. Heterogeneity of nemaline myopathy cases with skeletal muscle alpha-actin gene mutations. Ann Neurol. 2004;56:86–96. - PubMed

Publication types