Distinguishing Keratoacanthoma from Well-Differentiated Cutaneous Squamous Cell Carcinoma Using Single-Cell Spatial Pathology
- PMID: 37419445
- PMCID: PMC10840781
- DOI: 10.1016/j.jid.2023.06.192
Distinguishing Keratoacanthoma from Well-Differentiated Cutaneous Squamous Cell Carcinoma Using Single-Cell Spatial Pathology
Abstract
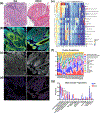
Keratoacanthoma (KA) is a common keratinocyte neoplasm that is regularly classified as a type of cutaneous squamous cell carcinoma (cSCC) despite demonstrating benign behavior. Differentiating KA from well-differentiated cSCC is difficult in many cases due to the substantial overlap of clinical and histological features. Currently, no reliable discriminating markers have been defined, and consequently, KAs are often treated similarly to cSCC, creating unnecessary surgical morbidity and healthcare costs. In this study, we used RNA sequencing to identify key differences in transcriptomes between KA and cSCC, which suggested divergent keratinocyte populations between each tumor. Imaging mass cytometry was then used to identify single-cell tissue characteristics, including cellular phenotype, frequency, topography, functional status, and interactions between KA and well-differentiated cSCC. We found that cSCC had significantly increased proportions of Ki67+ keratinocytes among tumor keratinocytes, which were dispersed significantly throughout non-basal keratinocyte communities. In cSCC, regulatory T-cells were more prevalent and held greater suppressive capacity. Furthermore, cSCC regulatory T-cells, tumor-associated macrophages, and fibroblasts had significant associations with Ki67+ keratinocytes as opposed to avoidances with KA, indicating a more immunosuppressive environment. Our data suggest that multicellular spatial features can serve as a foundation to enhance the histological discrimination of ambiguous KA and cSCC lesions.
Copyright © 2023. Published by Elsevier Inc.
Conflict of interest statement
Figures


Similar articles
-
Gene expression landscape of cutaneous squamous cell carcinoma progression.Br J Dermatol. 2024 Oct 17;191(5):760-774. doi: 10.1093/bjd/ljae249. Br J Dermatol. 2024. PMID: 38867481
-
A clinical and biological review of keratoacanthoma.Br J Dermatol. 2021 Sep;185(3):487-498. doi: 10.1111/bjd.20389. Epub 2021 Jun 14. Br J Dermatol. 2021. PMID: 33864244 Review.
-
Aberrant p16, p53 and Ki-67 immunohistochemistry staining patterns can distinguish solitary keratoacanthoma from cutaneous squamous cell carcinoma.Pathology. 2023 Oct;55(6):772-784. doi: 10.1016/j.pathol.2023.07.001. Epub 2023 Jul 20. Pathology. 2023. PMID: 37573161
-
Expression of PD-L1 in keratoacanthoma and different stages of progression in cutaneous squamous cell carcinoma.Cancer Immunol Immunother. 2017 Sep;66(9):1199-1204. doi: 10.1007/s00262-017-2015-x. Epub 2017 May 13. Cancer Immunol Immunother. 2017. PMID: 28501937 Free PMC article.
-
Matrix metalloproteinases in keratinocyte carcinomas.Exp Dermatol. 2021 Jan;30(1):50-61. doi: 10.1111/exd.14183. Epub 2020 Sep 17. Exp Dermatol. 2021. PMID: 32869366 Free PMC article. Review.
Cited by
-
Generalised eruptive keratoacanthomas of Grzybowski.BMJ Case Rep. 2024 Mar 21;17(3):e260007. doi: 10.1136/bcr-2024-260007. BMJ Case Rep. 2024. PMID: 38514156 No abstract available.
-
Predictive role of peripheral blood indicators in the prognosis of patients with cutaneous squamous cell carcinoma treated with immune checkpoint inhibitors.Am J Cancer Res. 2025 Apr 15;15(4):1705-1718. doi: 10.62347/KZOQ9722. eCollection 2025. Am J Cancer Res. 2025. PMID: 40371131 Free PMC article.
-
The spatial and single-cell landscape of skin: Charting the multiscale regulation of skin immune function.Semin Immunol. 2025 Jun;78:101958. doi: 10.1016/j.smim.2025.101958. Epub 2025 Apr 22. Semin Immunol. 2025. PMID: 40267702 Review.
-
The landscape of long noncoding RNA during cutaneous squamous cell carcinoma progression.Br J Dermatol. 2025 Aug 18;193(3):490-501. doi: 10.1093/bjd/ljaf108. Br J Dermatol. 2025. PMID: 40152495 Free PMC article.
-
Keratoacanthoma in a Patient With Skin of Color.Cureus. 2025 Apr 21;17(4):e82695. doi: 10.7759/cureus.82695. eCollection 2025 Apr. Cureus. 2025. PMID: 40400895 Free PMC article.
References
-
- Boyd S, Virolainen S, Parssinen J, Skoog T, van Hogerlinden M, Latonen L, et al. MMP-10 (Stromelysin-2) and MMP-21 in human and murine squamous cell cancer. Exp Dermatol 2009;18(12):1044–52. - PubMed
Publication types
MeSH terms
Substances
Grants and funding
LinkOut - more resources
Full Text Sources
Medical
Molecular Biology Databases

