. 2023 Jul 7;6(9):e202302214.
doi: 10.26508/lsa.202302214. Print 2023 Sep.

B-cell targeting with anti-CD38 daratumumab: implications for differentiation and memory responses

Affiliations

B-cell targeting with anti-CD38 daratumumab: implications for differentiation and memory responses

Dorit Verhoeven et al. Life Sci Alliance. .

Abstract

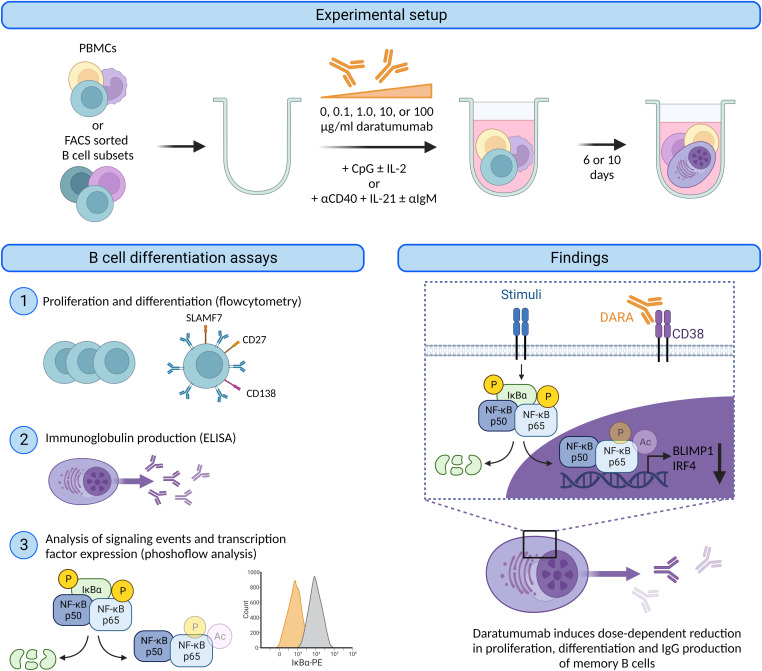
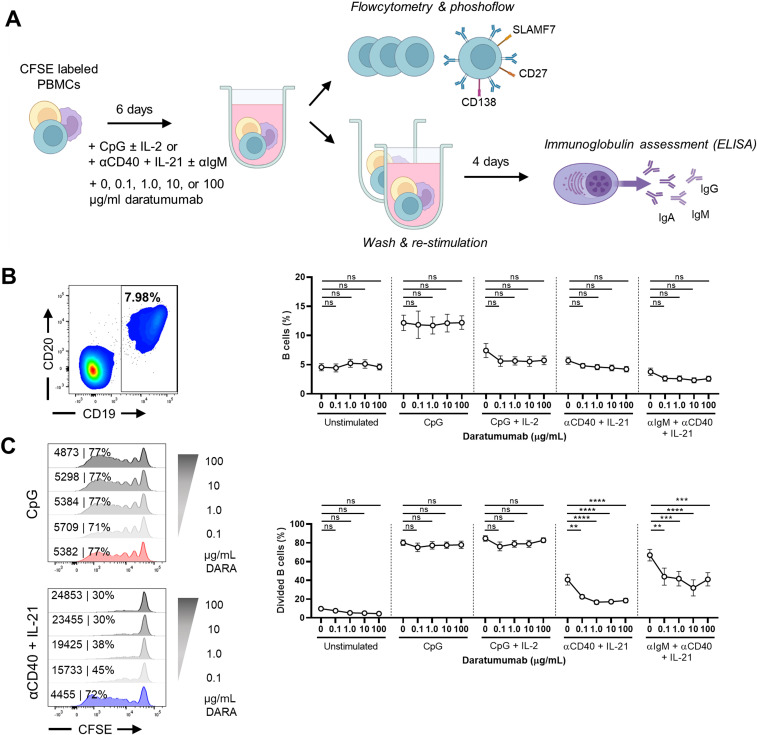
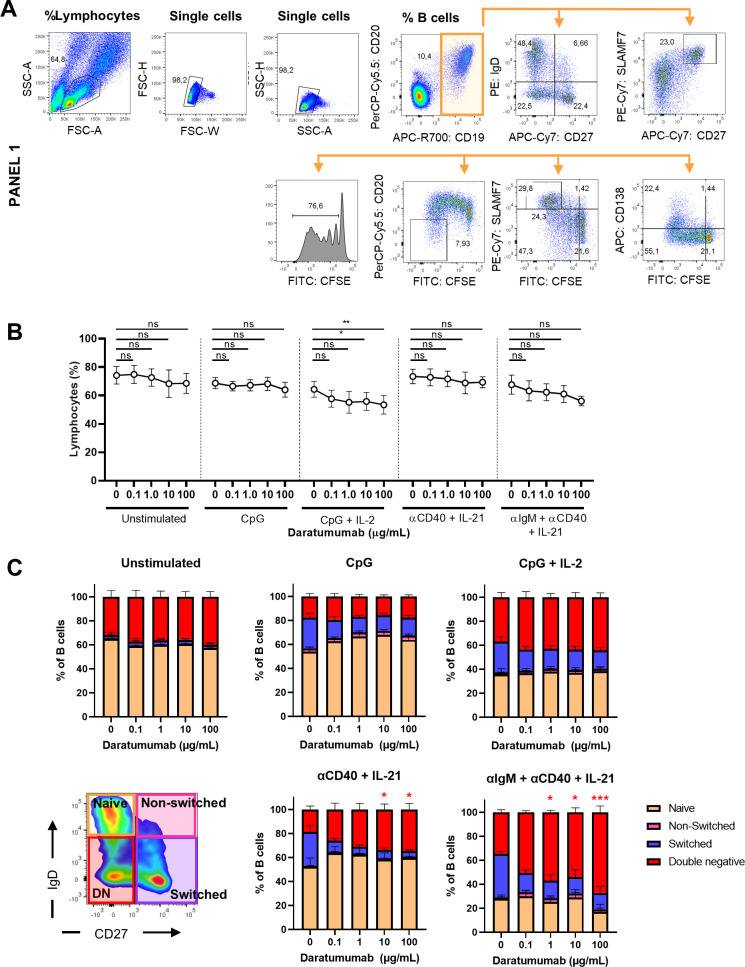
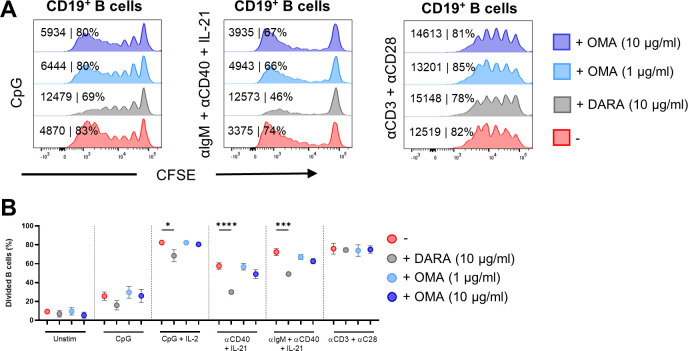
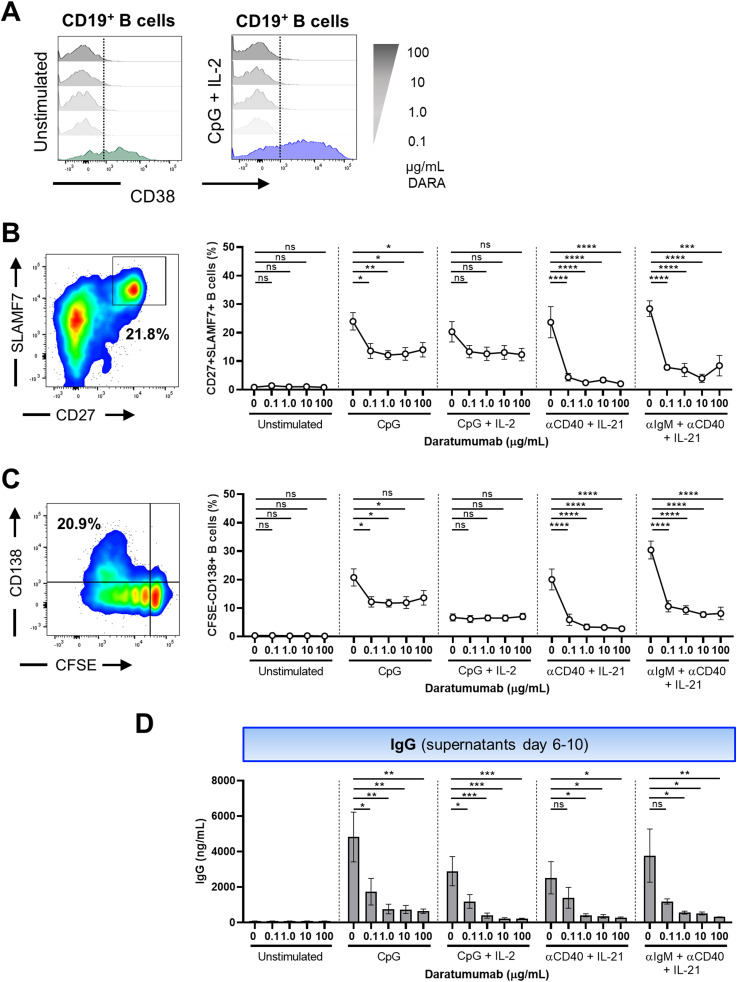
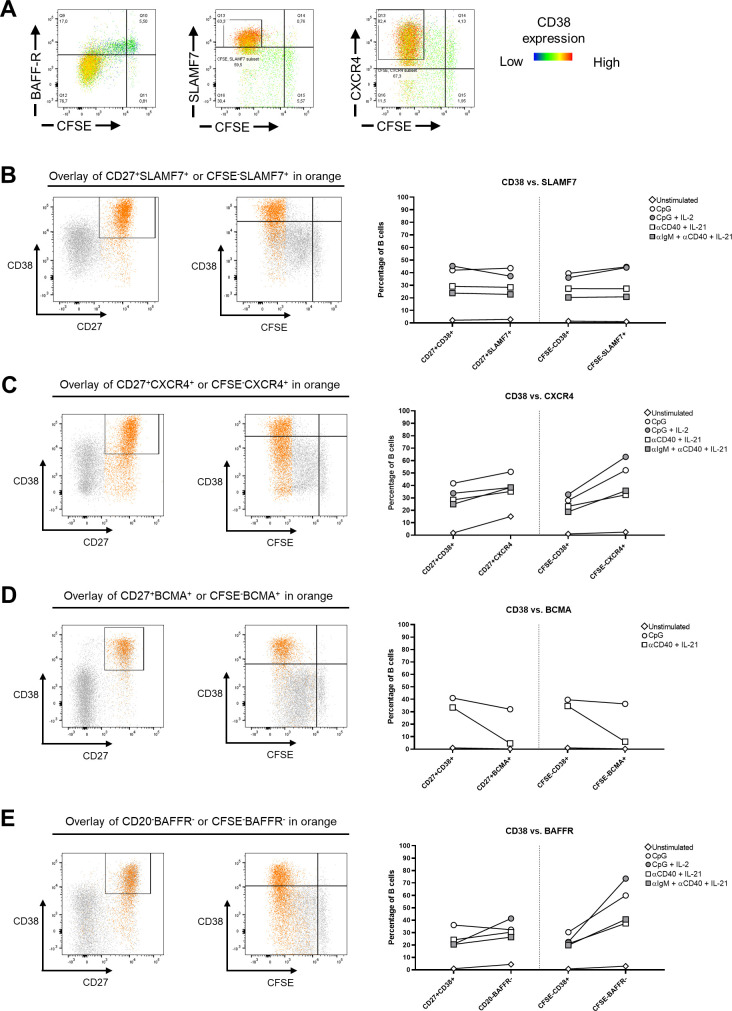
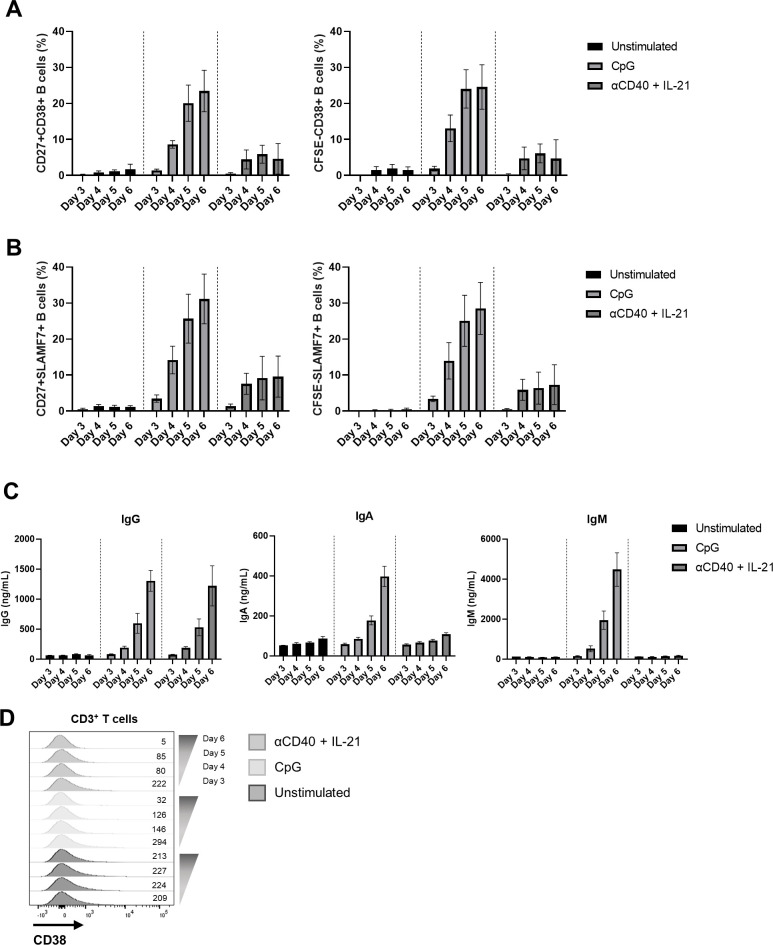
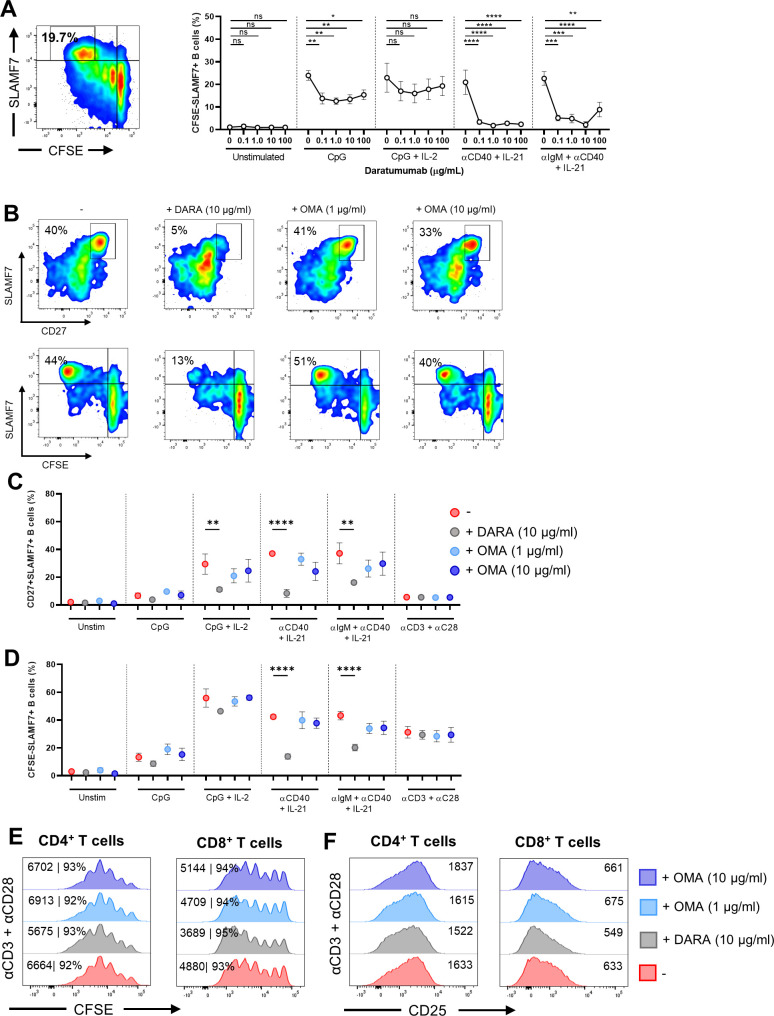
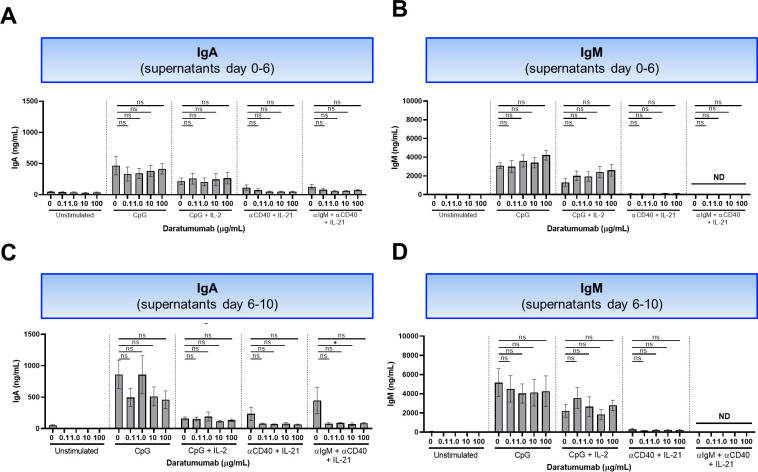
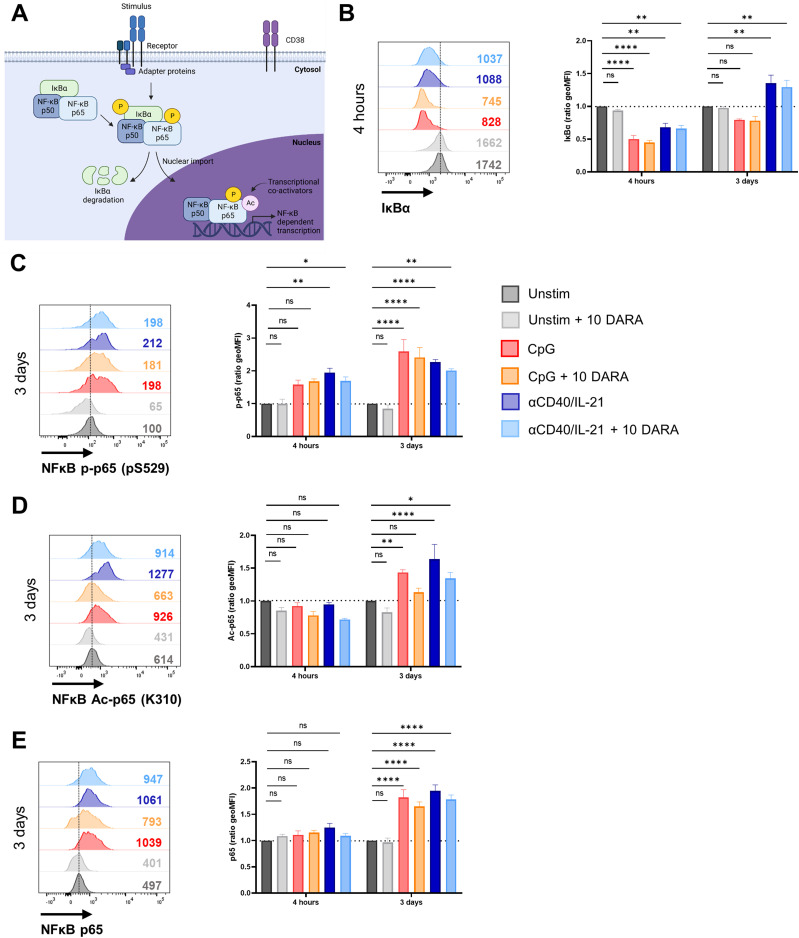
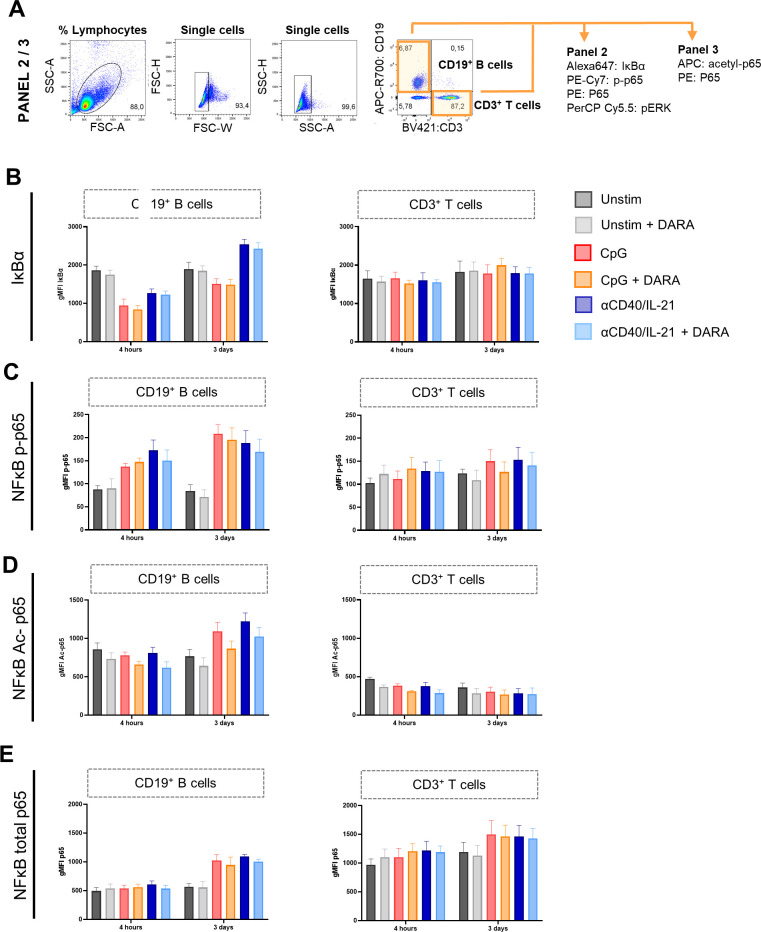
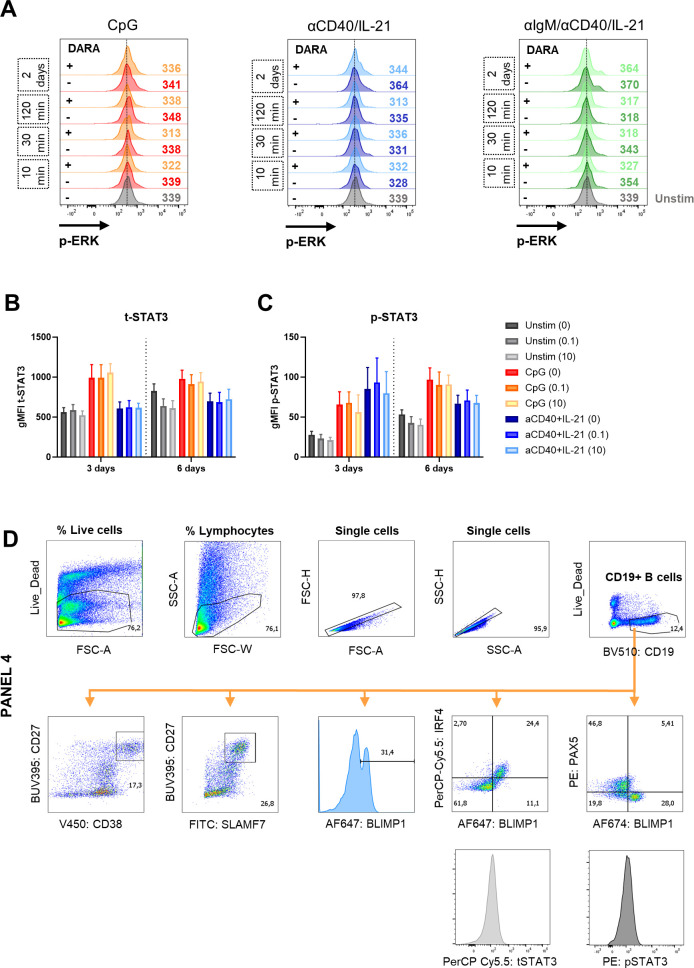
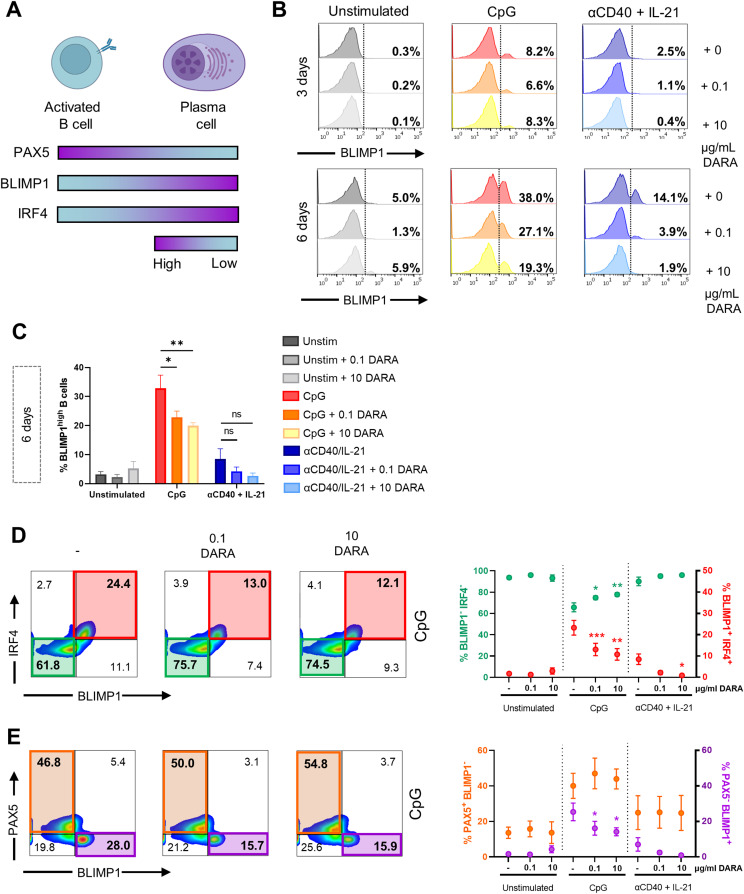
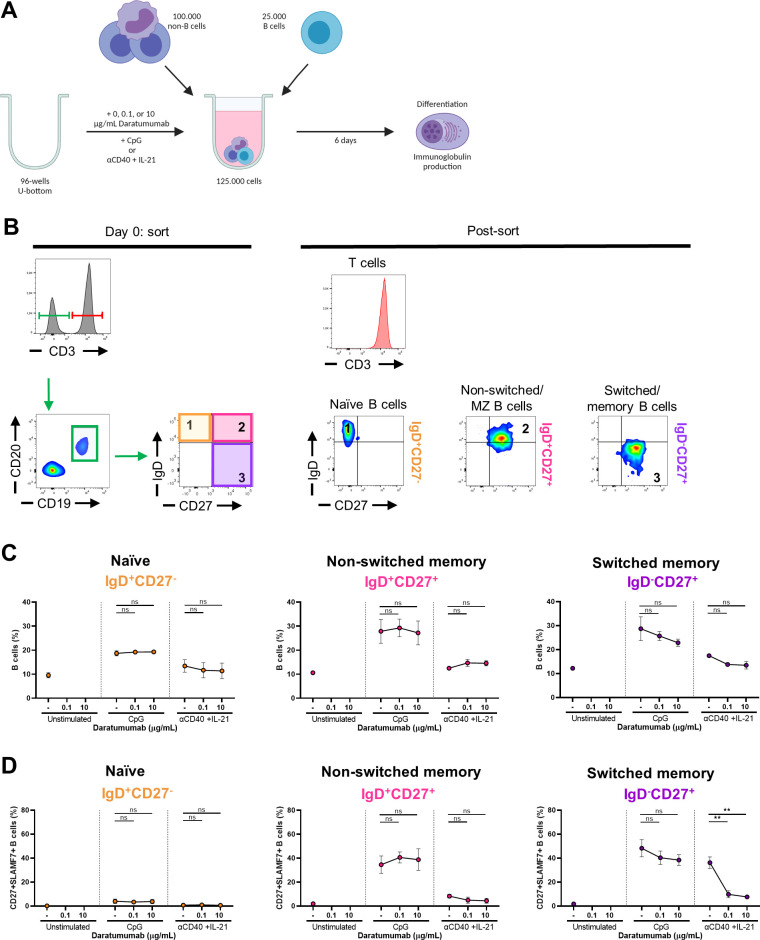
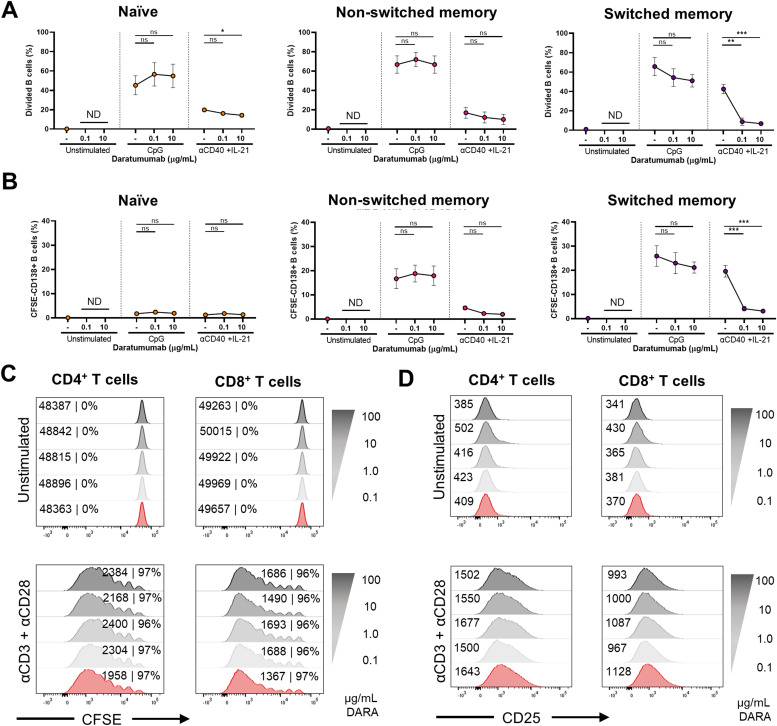
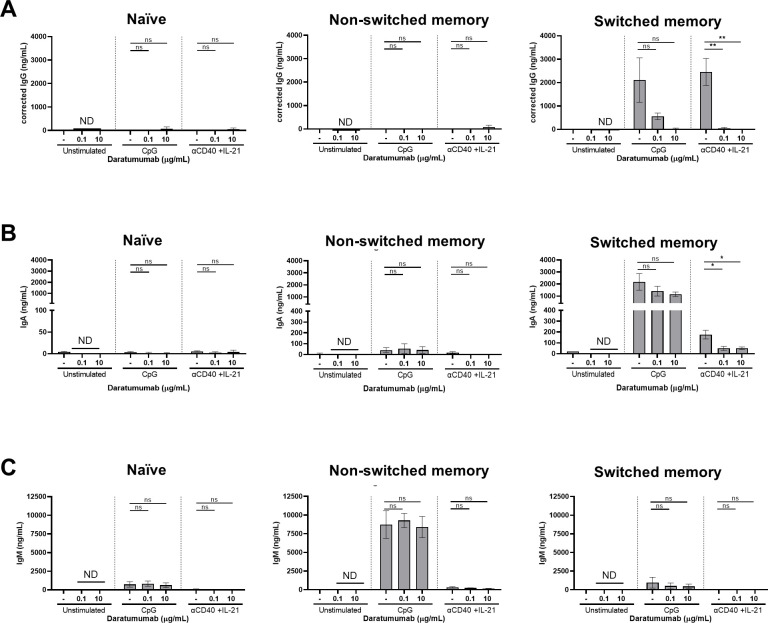
B cell-targeted therapies, such as CD20-targeting mAbs, deplete B cells but do not target the autoantibody-producing plasma cells (PCs). PC-targeting therapies such as daratumumab (anti-CD38) form an attractive approach to treat PC-mediated diseases. CD38 possesses enzymatic and receptor capabilities, which may impact a range of cellular processes including proliferation and differentiation. However, very little is known whether and how CD38 targeting affects B-cell differentiation, in particular for humans beyond cancer settings. Using in-depth in vitro B-cell differentiation assays and signaling pathway analysis, we show that CD38 targeting with daratumumab demonstrated a significant decrease in proliferation, differentiation, and IgG production upon T cell-dependent B-cell stimulation. We found no effect on T-cell activation or proliferation. Furthermore, we demonstrate that daratumumab attenuated the activation of NF-κB in B cells and the transcription of NF-κB-targeted genes. When culturing sorted B-cell subsets with daratumumab, the switched memory B-cell subset was primarily affected. Overall, these in vitro data elucidate novel non-depleting mechanisms by which daratumumab can disturb humoral immune responses. Affecting memory B cells, daratumumab may be used as a therapeutic approach in B cell-mediated diseases other than the currently targeted malignancies.


Conflict of interest statement

The authors declare that they have no conflict of interest.

Figures

None
Graphical abstract
Figure 1.
Figure 1.. Characterization of an in vitro system to establish the effects of daratumumab on B-cell proliferation.
(A) Schematic overview of the experimental setup (created with BioRender.com). In short, CFSE-labeled PBMCs were cultured for 6 d without or with various concentrations of daratumumab and stimulated with CpG ± IL-2 or αCD40 + IL-21 ± αIgM. For some experiments, cells were washed at day 6 and restimulated until day 10. (B) Representative CD19/CD20 FACS plot (left) after 6 d of culture with CpG showing the gating of CD19+ B cells. Quantification (right) of the percentages CD19+ B cells (of lymphocytes) for the different conditions tested. n = 6–8. (C) Amount of proliferation by CFSE dilution. Representative histogram overlays of CD19+ B cells (left) for CpG and αCD40 + IL-21 stimulation at day 6. Values depicted next to the histograms represent the corresponding geometric MFI and the percentages of divided B cells. Quantification (right) of the percentages of divided CD19+ B cells for the different conditions tested. n = 6–8. P-values were calculated using a one-way ANOVA and Dunnett’s multiple comparisons test for each condition. ns, not significant, **P ≤ 0.01, ***P ≤ 0.001, and ****P ≤ 0.0001. Means ± SEM are displayed.
Figure S1.
Figure S1.. Phenotypic characterization of B-cell subsets.
(A) Gating strategy for lymphocyte and different B-cell populations. (B) Quantification of the percentages of lymphocytes for the different conditions tested. n = 6–8. (C) Quantification of the naïve (IgD+CD27), non-switched (IgD+CD27+), switched memory (IgDCD27+), and double-negative (IgDCD27) B-cell subsets in the different conditions tested. n = 6–8. P-values were calculated using a one-way ANOVA and Dunnett’s multiple comparisons test for each condition. ns, not significant, *P ≤ 0.05, **P ≤ 0.01, and ***P ≤ 0.001. Means ± SEM are displayed.
Figure S2.
Figure S2.. Effects of daratumumab and omalizumab on B-cell proliferation.
(A) Amount of proliferation by CFSE dilution. Representative histogram overlays of CD19+ B cells for CpG αIgM + αCD40 + IL-21 and αCD3 + αCD28 stimulation at day 6 with or without daratumumab (DARA; 10 μg/ml) or omalizumab (OMA; 1 and 10 μg/ml). Values depicted next to the histograms represent the corresponding geometric MFI and the percentages of divided B cells. (B) Quantification of the percentages of divided CD19+ B cells for the different conditions tested. n = 3. P-values were calculated using a two-way ANOVA and Dunnett’s multiple comparisons test. ns, not significant, *P ≤ 0.05, **P ≤ 0.01, ***P ≤ 0.001, and ****P ≤ 0.0001. Means ± SEM are displayed.
Figure 2.
Figure 2.. Effect of daratumumab on B-cell differentiation and IgG production.
(A) Representative histogram overlays of the CD38 expression of CD19+ B cells in the presence of different concentrations of daratumumab. (B, C) Representative CD27/SLAMF7 FACS plot and CFSE/CD138 FACS plot (left) showing the gating of SLAMF7+CD27+ and CFSElowCD138+ B cells within the CD19+ gate after stimulation with CpG. Quantification (right) of %SLAMF7+CD27+ and %CFSElowCD138+ B cells after 6 d of culture for the different conditions tested. n = 6–8. (D) IgG secretion measured in culture supernatants between days 6 and 10 (after washing and restimulation). n = 4. P-values were calculated using a one-way ANOVA and Dunnett’s multiple comparisons test for each condition. ns, not significant, *P ≤ 0.05, **P ≤ 0.01, and ***P ≤ 0.001. Means ± SEM are displayed.
Figure S3.
Figure S3.. SLAMF7 as an alternative for a plasmablast marker CD38.
Assessment of the expression of CD38 combined with plasmablast markers B-cell activation factor receptor (BAFFR), SLAMF7, B-cell maturation antigen (BCMA), and CXCR4 in B cells after 6 d of PBMC culture corrected for B-cell numbers with T cell–dependent (αCD40 + IL-21 and αIgM + αCD40 + IL-21) and T cell–independent (CpG and CpG + IL-2) stimulations. BCMA samples were cultured with a γ-secretase inhibitor to prevent cleavage of BCMA. (A) Representative FACS plots showing the CD38 expression overlaid on BAFFR, SLAMF7, and CXCR4 versus CFSE plots. (B, C, D, E) Representative plot overlays on the left of CpG-stimulated B cells showing (B) CD27+SLAMF7+ or CFSElowSLAMF7+, (C) CD27+CXCR4+ or CFSElowCXCR4+, (D) CD27+BCMA+ or CFSElowBCMA+, and (E) CD20BAFFR or CFSElowBAFFR compared with the conventional CD27+CD38+ or CFSElowCD38+ gating strategy to identify plasmablasts and plasma cells. Plots on the right show quantification for all different stimuli tested. n = 3–4. Means are displayed.
Figure S4.
Figure S4.. Timeline of CD38 and SLAMF7 up-regulation in B cells.
Expression of CD38 and SLAMF7 was determined in CD19+-gated B cells after 3, 4, 5, and 6 d of culture. Furthermore, supernatants were collected to measure the immunoglobulin production. (A) Quantification of percentages of CD27+CD38+ (left) and CFSElowCD38+ (right) B cells. (B) Percentages of CD27+SLAMF7+ (left) and CFSElowSLAMF7+ (right) B cells. (C) Secreted IgG, IgA, and IgM in cultured supernatants. n = 4. Means ± SEM are displayed. (D) Representative plot overlays of CD38 expression in CD3+ T cells after 3, 4, 5, and 6 d of stimulation.
Figure S5.
Figure S5.. Effects of daratumumab and omalizumab on B-cell differentiation and T-cell activation.
(A) Representative CFSE/SLAMF7 FACS plot (left panel) showing the gating of CFSElowSLAMF7+ B cells within the CD19+ gate after stimulation with CpG. Quantification (right panel) of %CFSElowSLAMF7+ B cells after 6 d of culture. n = 6–8. P-values were calculated using a one-way ANOVA and Dunnett’s multiple comparisons test for each condition. (B) Representative CD27/SLAMF7 (upper panels) and CFSE/SLAMF7 (lower panels) FACS plots (left panel) showing B-cell differentiation of CD19+ B cells after αCD40 + IL-21 stimulation after 6 d of culture with or without daratumumab (DARA; 10 μg/ml) or omalizumab (OMA; 1 and 10 μg/ml) n = 3. (C, D) Quantification of %SLAMF7+CD27+ and %CFSElowSLAMF7+ B cells after 6 d of culture for the different conditions tested. n = 3. (E, F) Representative histogram overlays of CFSE dilution and CD25 up-regulation of CD4+ and CD8+ T cells at day 6 after αCD3 + αCD28 stimulation. Values depicted next to the histograms represent the corresponding percentages of divided CD4+ and CD8+ T cells and/or geometric MFI, respectively. n = 3. P-values were calculated using a two-way ANOVA and Dunnett’s multiple comparisons test. ns, not significant, *P ≤ 0.05, **P ≤ 0.01, ***P ≤ 0.001, and ****P ≤ 0.0001. Means ± SEM are displayed.
Figure S6.
Figure S6.. Effect of daratumumab on IgA and IgM production.
(A, B) Secreted IgA and IgM in culture supernatants between days 0 and 6. n = 6–8. (C, D) Secreted IgA and IgM measured in culture supernatants between days 6 and 10 (after washing and restimulation). n = 4. P-values were calculated using a one-way ANOVA and Dunnett’s multiple comparisons test for each condition. ns, not significant, *P ≤ 0.05, **P ≤ 0.01, ***P ≤ 0.001, and ****P ≤ 0.0001. Means ± SEM are displayed.
Figure 3.
Figure 3.. Daratumumab attenuates activation-induced phosphorylation and acetylation of NF-κB in B cells.
(A) Schematic representation of phosphorylation and acetylation events of NF-κB proteins upon stimulation. (B) Representative histogram overlays (left) of the IκBα expression of CD19+ B cells after 4 h of stimulation with indicated stimuli ± 10 μg/ml daratumumab. The geometric mean (geoMFI) ratio (right) was calculated by normalizing to the expression in unstimulated CD19+ B cells (set at a value of 1) at the corresponding time point. n = 3. (C, D, E) Representative histogram overlays (left) of (C) NF-κB phospho-p65 (pS529), (D) NF-κB acetylated-p65 (K310), and (E) NF-κB total-p65 and expression of CD19+ B cells after 3 d of stimulation with indicated stimuli ± 10 μg/ml daratumumab. The geometric mean (geoMFI) ratio (right) was calculated by normalizing to the expression in unstimulated CD19+ B cells (set at a value of 1) at the corresponding time point. n = 3. P-values were calculated using a two-way ANOVA and Dunnett’s multiple comparisons test. ns, not significant, *P ≤ 0.05, **P ≤ 0.01, and ****P ≤ 0.0001. Means ± SEM are displayed.
Figure S7.
Figure S7.. Effects of daratumumab on activation of canonical NF-κB proteins in B and T cells.
(A) Gating strategy for B- and T-cell populations. (B, C, D, E) Geometric MFI of CD19+ B cells (left) and CD3+ T cells (right) of (B) IκBα, (C) NF-κB phospho-p65 (pS529), (D) NF-κB acetylated-p65 (K310), and (E) NF-κB total-p65 expression after 4 h and 3 d of culture with indicated stimuli ± 10 μg/ml daratumumab. n = 3. Means ± SEM are displayed.
Figure S8.
Figure S8.. Effects of daratumumab on signaling molecules and transcription factors in B cells.
(A) Histogram overlays of pERK expression after 10, 30, and 120 min, and 2 d of culture without stimulation (unstim) or indicated stimuli with or without daratumumab (1.0 μg/ml). One representative donor is shown of n = 2–4. (B, C) Geometric MFI of CD19+ B cells of total-STAT3 and p-STAT3 (pY705) expression after 3 and 6 d of culture with indicated stimuli and daratumumab (0.1 or 10 μg/ml). n = 3. (D) Gating strategy for B-cell populations and transcription factor expression.
Figure 4.
Figure 4.. Effects of daratumumab on B-cell transcription factors during differentiation.
(A) Schematic representation of the expression of transcription factors PAX5, BLIMP1, and IRF4 during B-cell activation and differentiation (created with BioRender.com). (B) Representative histogram overlays of the BLIMP1 expression of CD19+ B cells after 3 and 6 d of stimulation with indicated stimuli and daratumumab (0.1 or 10 μg/ml). (C) Quantification of the percentages of BLIMP1high B cells at day 6 for the different conditions tested. n = 3. (D) Representative BLIMP1/IRF4 FACS plots (left) showing the gating of BLIMP1IRF4 and BLIMP1+IRF4+ within the CD19+ gate after stimulation with CpG. Quantification (right) of %BLIMP1IRF4 (green) and %BLIMP1+IRF4+ (red) B cells after 6 d of culture for the different conditions tested. n = 3. (E) Representative BLIMP1/PAX5 FACS plots (left) showing the gating of PAX5+BLIMP1 and PAX5BLIMP1+ within the CD19+ gate after stimulation with CpG. Quantification (right) of %PAX5+BLIMP1 (orange) and %PAX5BLIMP1+ (purple) B cells after 6 d of culture for the different conditions tested. n = 3. P-values were calculated using a two-way ANOVA and Dunnett’s multiple comparisons test. ns, not significant, *P ≤ 0.05, and **P ≤ 0.01. Means ± SEM are displayed.
Figure S9.
Figure S9.. Effects of daratumumab on sorted naïve and memory B-cell subsets and T cells.
(A) Schematic overview of the experimental setup (created with BioRender.com). In short, CFSE-labeled PBMCs were sorted on day 0. 25,000 FACS-sorted naïve (CD19+IgD+CD27), non-switched (CD19+IgD+CD27+), and memory (CD19+IgDCD27+) B-cell populations were co-cultured with 100,000 autologous non-B cells and DARA (0.1 and 10 μg/ml) for 6 d. FACS-sorted CD3+ T cells were cultured with five different concentrations of DARA with αCD3+αCD28 for 6 d. (B) Gating strategy used for sorting on day 0 (on the left) and purity stains after sorting (on the right). (C) B-cell percentages of cultured IgD+CD27, IgD+CD27+, and IgDCD27+ B cells. (D) Differentiation of cultured IgD+CD27, IgD+CD27+, and IgDCD27+ B cells determined by CD27+SLAMF7+ B cells. n = 3. P-values were calculated using a two-way ANOVA and Dunnett’s multiple comparisons test. ns, not significant and **P ≤ 0.01. Means ± SEM are displayed.
Figure 5.
Figure 5.. Effects of daratumumab on sorted naïve and memory B-cell subsets and T cells.
(A, B) FACS-sorted naïve (CD19+IgD+CD27), non-switched (CD19+IgD+CD27+), and memory (CD19+IgDCD27+) B-cell populations were co-cultured with autologous non-B cells with CpG or αCD40 + IL-21 and daratumumab (0.1 or 10 μg/ml) for 6 d. (A, B) Quantification of the percentages of (A) divided and (B) CFSECD138+ B cells at day 6. n = 3. (C, D) FACS-sorted CD3+ T cells were cultured with αCD3+αCD28 and five different concentrations of daratumumab for 6 d. (C, D) Amount of proliferation by CFSE dilution and (D) amount of activation by CD25 up-regulation. Representative histogram overlays of CD4+ (left) and CD8+ (right) T cells at day 6 after no stimulation or αCD3 + αCD28. Values depicted next to the histograms represent the corresponding geometric MFI and the percentages of divided CD4+ and CD8+ T cells, respectively. n = 3. P-values were calculated using a two-way ANOVA and Dunnett’s multiple comparisons test. ns, not significant, *P ≤ 0.05, **P ≤ 0.01, and ***P ≤ 0.001. Means ± SEM are displayed.
Figure S10.
Figure S10.. Effects of daratumumab on IgG, IgA, and IgM production of sorted naïve and memory B-cell subsets.
(A, B, C) Secreted (A) IgG, (B) IgA, and (C) IgM in culture supernatants between days 0 and 6 of sorted naïve (IgD+CD27), non-switched (IgD+CD27+), and switched (IgDCD27+) B cells. IgG concentrations were corrected for the presence of DARA in the supernatant. n = 3. P-values were calculated using a two-way ANOVA and Dunnett’s multiple comparisons test. ns, not significant, *P ≤ 0.05, and **P ≤ 0.01. Means ± SEM are displayed.

References

    1. Nutt SL, Hodgkin PD, Tarlinton DM, Corcoran LM (2015) The generation of antibody-secreting plasma cells. Nat Rev Immunol 15: 160–171. 10.1038/nri3795 - DOI - PubMed
    1. Allman D, Wilmore JR, Gaudette BT (2019) The continuing story of T-cell independent antibodies. Immunol Rev 288: 128–135. 10.1111/imr.12754 - DOI - PMC - PubMed
    1. Ettinger R, Sims GP, Fairhurst AM, Robbins R, da Silva YS, Spolski R, Leonard WJ, Lipsky PE (2005) IL-21 induces differentiation of human naive and memory B cells into antibody-secreting plasma cells. J Immunol 175: 7867–7879. 10.4049/jimmunol.175.12.7867 - DOI - PubMed
    1. Tellier J, Nutt SL (2017) Standing out from the crowd: How to identify plasma cells. Eur J Immunol 47: 1276–1279. 10.1002/eji.201747168 - DOI - PubMed
    1. Cobaleda C, Schebesta A, Delogu A, Busslinger M (2007) Pax5: The guardian of B cell identity and function. Nat Immunol 8: 463–470. 10.1038/ni1454 - DOI - PubMed

Publication types

LinkOut - more resources