

Evaluating prediction model performance
- PMID: 37419761
- PMCID: PMC10529246
- DOI: 10.1016/j.surg.2023.05.023
Evaluating prediction model performance
Abstract
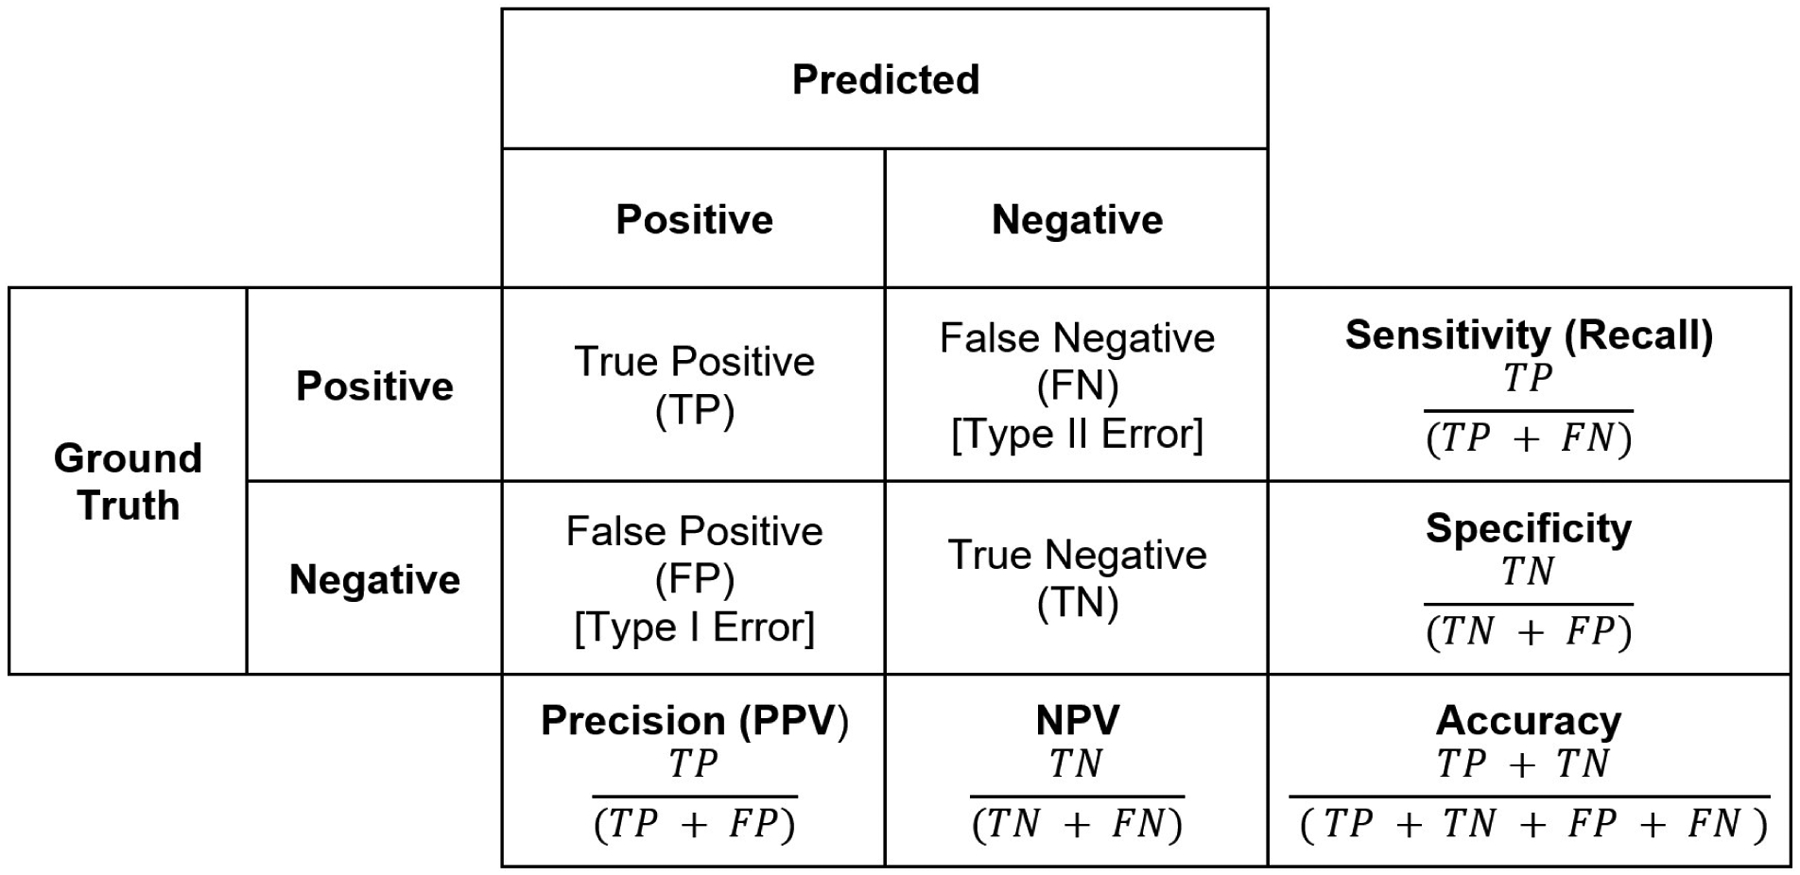
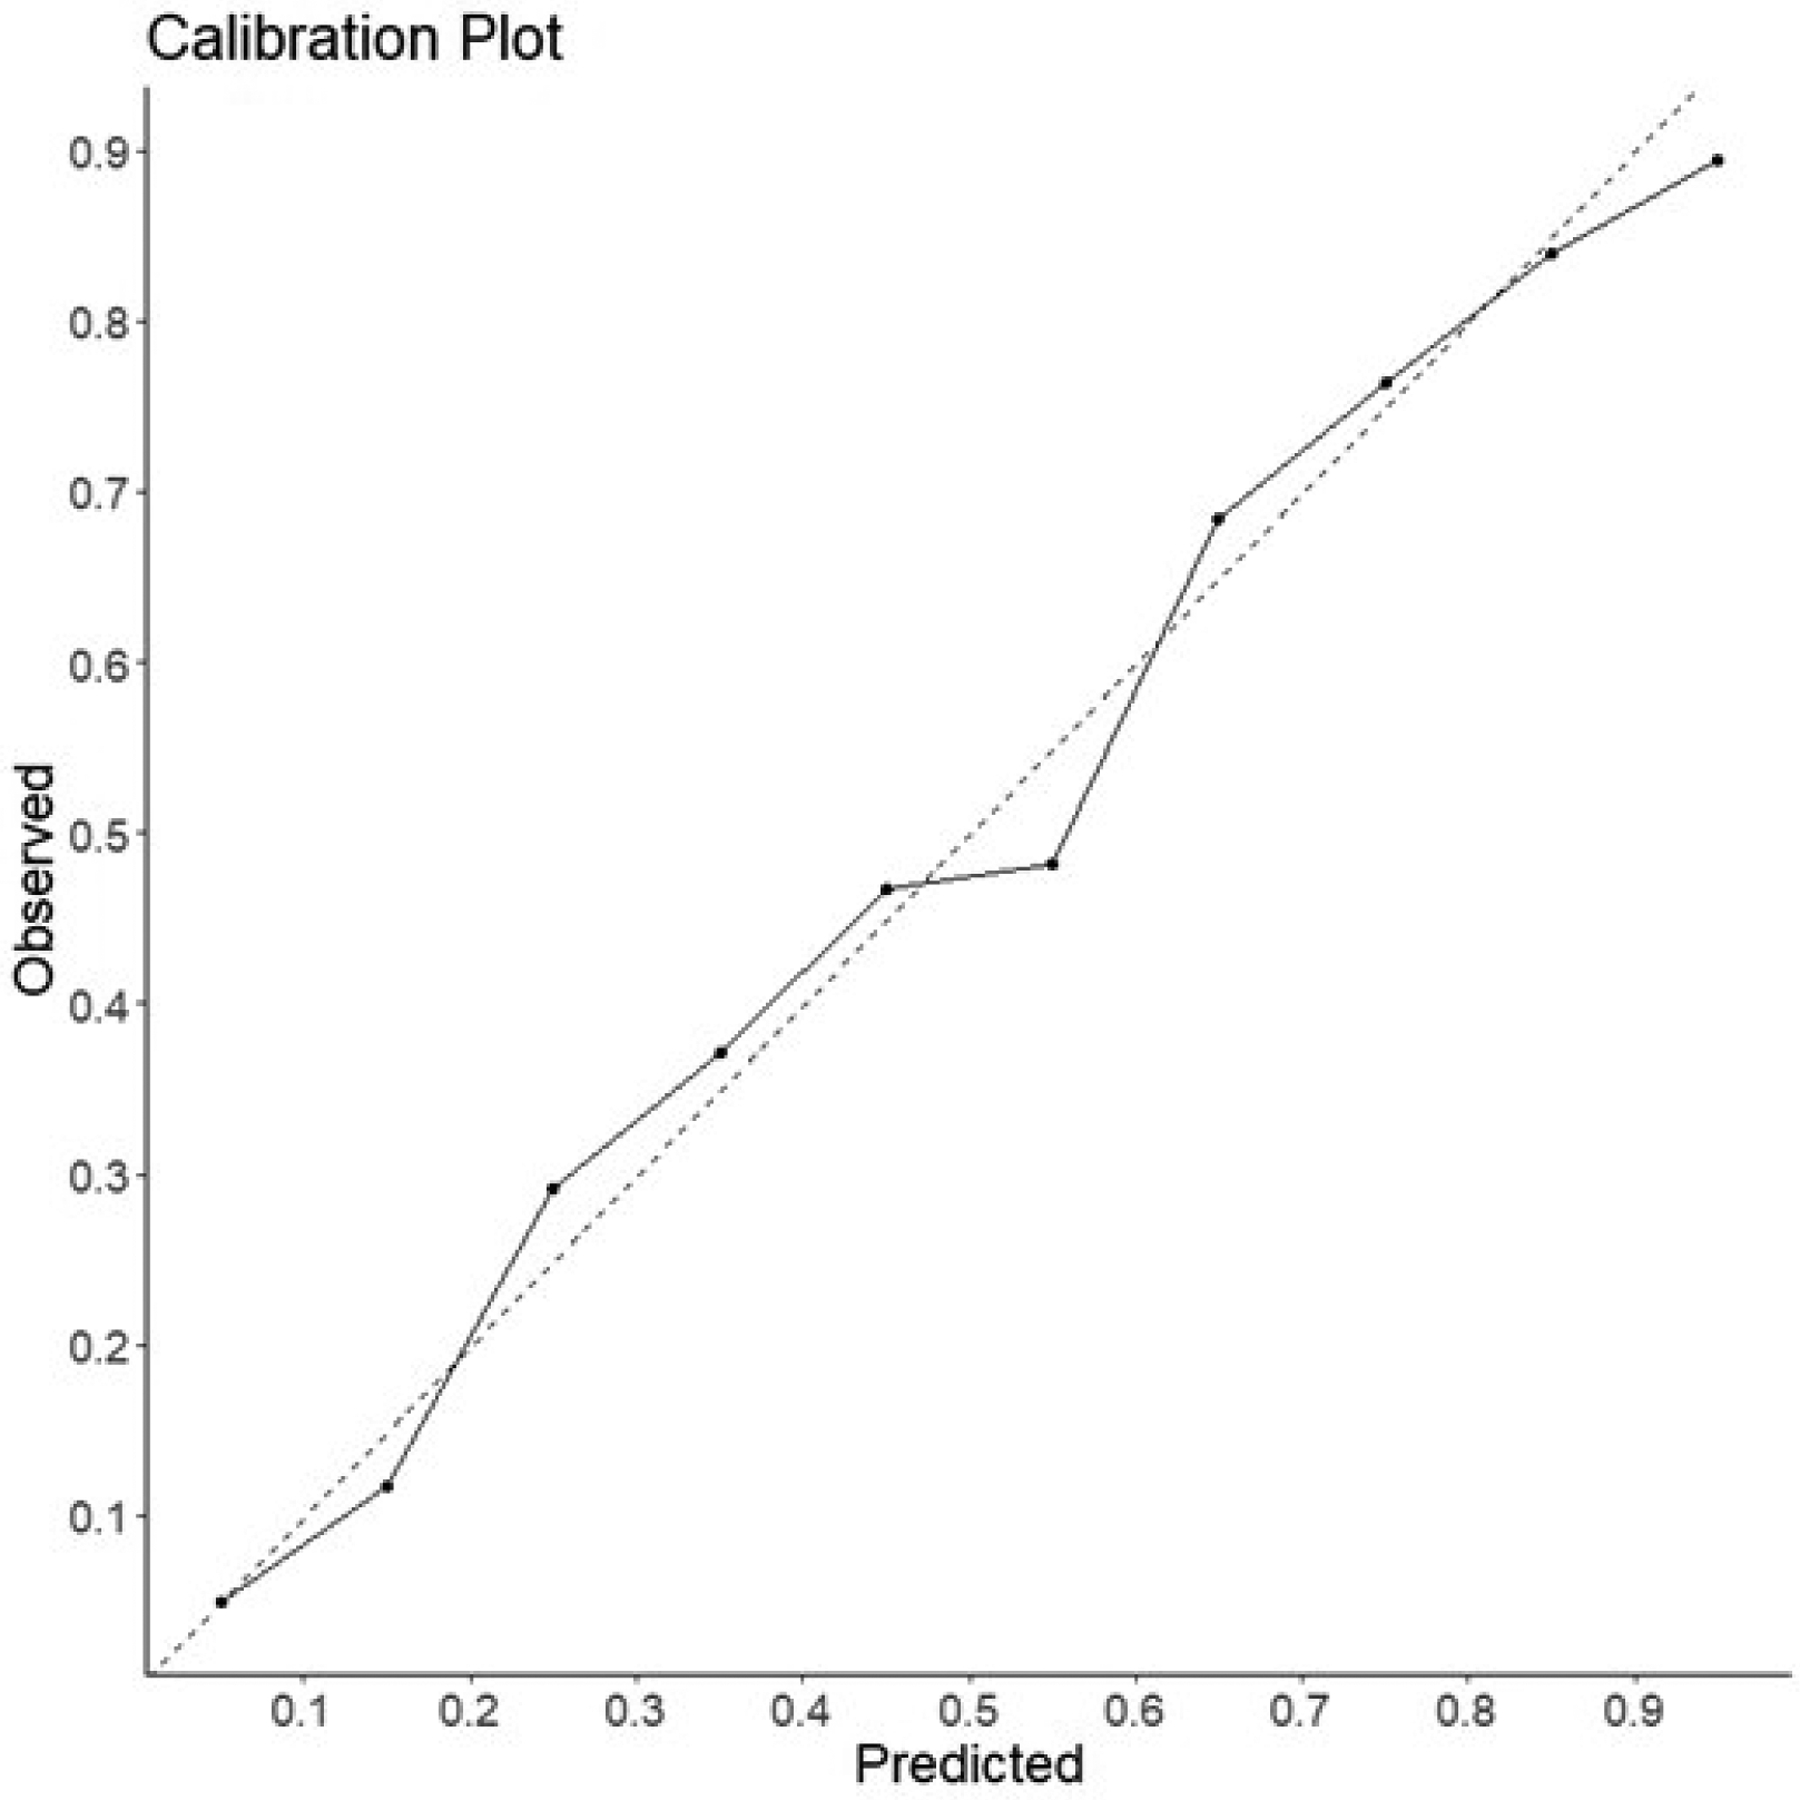
This article highlights important performance metrics to consider when evaluating models developed for supervised classification or regression tasks using clinical data. When evaluating model performance, we detail the basics of confusion matrices, receiver operating characteristic curves, F1 scores, precision-recall curves, mean squared error, and other considerations. In this era, defined by the rapid proliferation of advanced prediction models, familiarity with various performance metrics beyond the area under the receiver operating characteristic curves and the nuances of evaluating model value upon implementation is essential to ensure effective resource allocation and optimal patient care delivery.
Copyright © 2023 Elsevier Inc. All rights reserved.
Conflict of interest statement
Conflicts of Interest/Disclosure:
Authors have no relevant conflicts of interest to disclose.
Figures
References
-
- Ting KM. Confusion Matrix. In: Sammut C, Webb GI, eds. Encyclopedia of Machine Learning. Boston, MA: Springer US; 2010:209–209.
-
- Powers D Evaluation: From Precision, Recall and F-Factor to ROC, Informedness, Markedness & Correlation. Mach Learn Technol. 2008;2.
-
- Boyd K, Eng KH, Page CD. Area under the Precision-Recall Curve: Point Estimates and Confidence Intervals. In: Advanced Information Systems Engineering. Springer Berlin Heidelberg; 2013:451–466.
-
- Kuhn M, Johnson K. Applied Predictive Modeling. New York, NY: Springer New York; 2013.
Publication types
MeSH terms
Grants and funding
LinkOut - more resources
Full Text Sources
Medical
