. 2023 Jul 7;14(1):4017.
doi: 10.1038/s41467-023-39613-z.

Molecular profiling of aromatase inhibitor sensitive and resistant ER+HER2- postmenopausal breast cancers

Affiliations

Molecular profiling of aromatase inhibitor sensitive and resistant ER+HER2- postmenopausal breast cancers

Eugene F Schuster et al. Nat Commun. .

Abstract

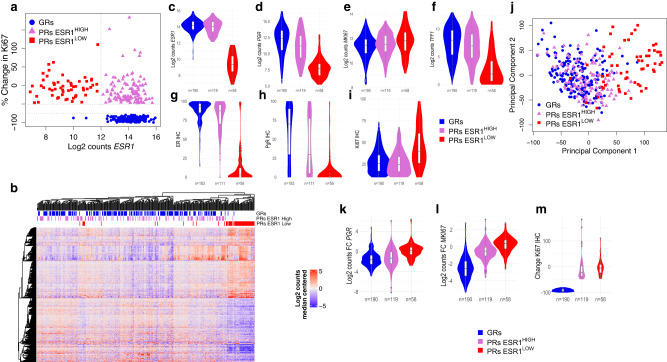
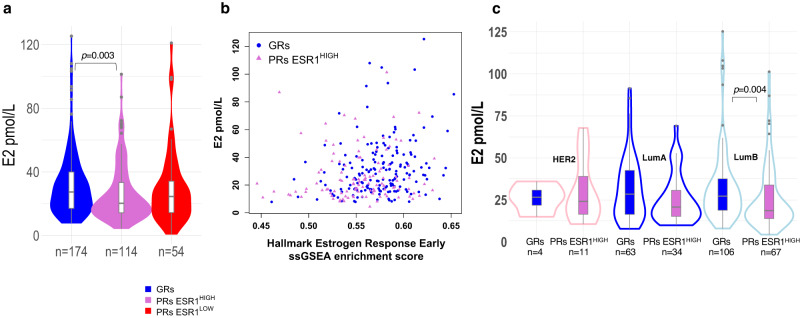
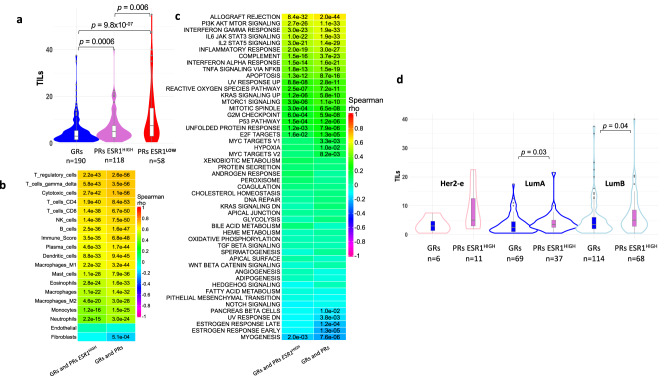
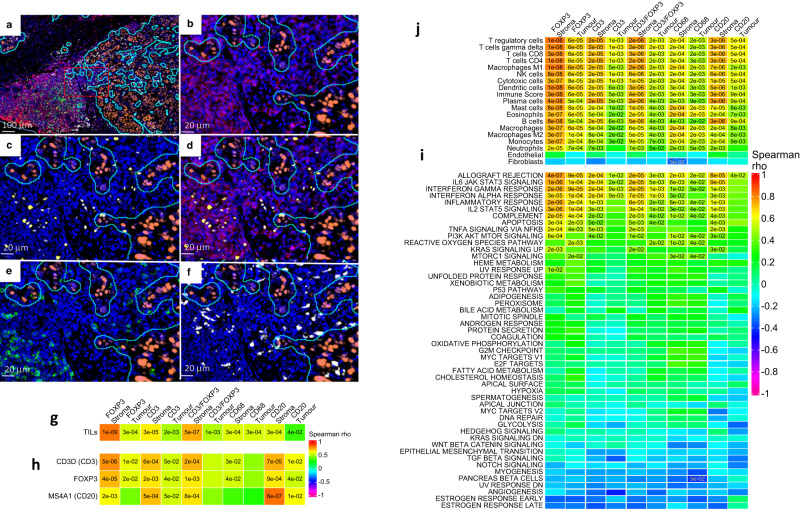
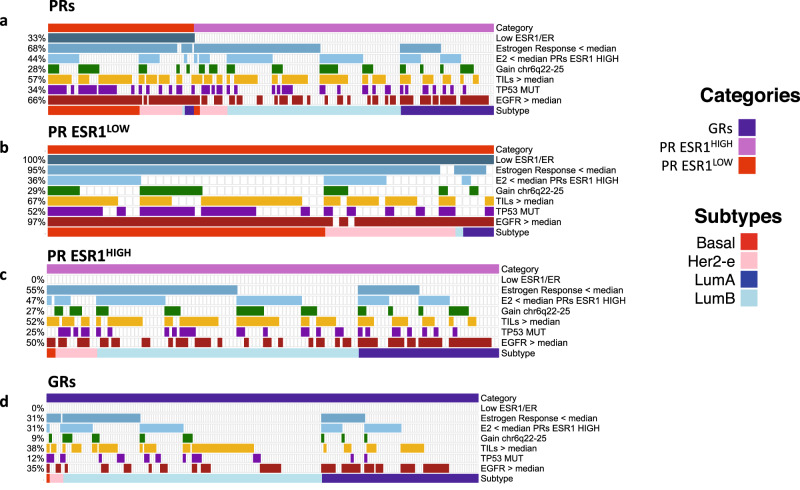
Aromatase inhibitors (AIs) reduce recurrences and mortality in postmenopausal patients with oestrogen receptor positive (ER+) breast cancer (BC), but >20% of patients will eventually relapse. Given the limited understanding of intrinsic resistance in these tumours, here we conduct a large-scale molecular analysis to identify features that impact on the response of ER + HER2- BC to AI. We compare the 15% of poorest responders (PRs, n = 177) as measured by proportional Ki67 changes after 2 weeks of neoadjuvant AI to good responders (GRs, n = 190) selected from the top 50% responders in the POETIC trial and matched for baseline Ki67 categories. In this work, low ESR1 levels are associated with poor response, high proliferation, high expression of growth factor pathways and non-luminal subtypes. PRs having high ESR1 expression have similar proportions of luminal subtypes to GRs but lower plasma estradiol levels, lower expression of estrogen response genes, higher levels of tumor infiltrating lymphocytes and immune markers, and more TP53 mutations.


Conflict of interest statement

M.D. reports consultancy for Astrazeneca, the ICR Rewards for Inventors Scheme for abiraterone. J.M.B. reports grants from Cancer Research UK, during the conduct of the study; grants from Medivation; grants and non-financial support from AstraZeneca, Merck Sharp & Dohme, Puma Biotechnology, Clovis Oncology, Pfizer, Janssen-Cilag, Novartis, and Roche, outside the submitted work. M.S.T. is a scientific advisor to Mindpeak and Sonrai Analytics, and has received honoraria recently from BMS, MSD, Roche, Sanofi and Incyte. He has received grant support from Phillips, Roche, MSD and Akoya. None of these disclosures are related to this work. J.F.R.R. has received consulting fees from, and has performed contracted research on behalf of, AstraZeneca, Bayer, Novartis and Oncimmune; has given expert testimony for AstraZeneca; and holds stock with Oncimmune. M.C.U.C. has a patent for Breast Cancer Classifier: US Patent No. 9,631,239 (Method of classifying a breast cancer instrinsic subtype) with royalties paid and receive research funding from NanoString Technologies and veracyte advisory role. M.D., E.F.S. and M.C.U.C. have patent-pending (PCT/EP2021/07368; Treatment response predictive method) for predictive CDK4/6 inhibitor sensitivity assay. All other authors declare no competing interests.

Figures

Fig. 1
Fig. 1. Gene and protein expression in GRs and PRs.
a Change in Ki67 scores after 2wks AI vs. log2 ESR1 normalised counts from RNA-seq data (red = PRs ESR1LOW; orchid = PRs ESR1HIGH; blue = GRs). b Unsupervised heatmap of median centred log2 gene expression values from median of genes significantly (FDR < 0.05) differentially expressed and log2 fold change (FC) > 2 between GRs and PRs. Violin/Boxplot of log2 normalised counts for ESR1 (c), PGR (d), MKI67 (e), and TFFI (f) genes and baseline ER (g), PgR (h) and Ki67 IHC (i) for GRs, PRs ESR1LOW and PRs ESR1HIGH. j PCA plot based on expression of all genes with GRs, PRs ESR1LOW, and PRs ESR1HIGH. Violin/Boxplot of change in PGR (k), MKI67 (l), and Ki67 IHC (m) after two weeks of AI for GRs, PRs ESR1LOW and PRs ESR1HIGH. Boxplots present 25th, 50th (median), and 75th percentile values. Whiskers extend no larger than ±1.5 times the inter-quartile range with outliers plotted individually beyond this range. The number of independent samples used for comparisons between GRs and PRs is shown. Source data are provided as a Source data file.
Fig. 2
Fig. 2. Intrinsic suptyping of GRs and PRs.
a Percent of PAM50 subtype for GRs, PRs ESR1HIGH and PRs ESR1LOW. b Change in Ki67 scores after 2wks AI vs. log2 ESR1 normalised counts from RNA-seq data marked by PAM50 subtype (LumA = blue; LumB = light blue; HER2-enriched=pink; Basal = red). c Heatmaps of median-centred log2 gene expression values supervised by GRs, PRs ESR1LOW and PRs ESR1HIGH of PAM50-subtyping genes (log2 FC from median) for POETIC data. Labelled with PAM50 subtype (LumA = blue; LumB = light blue; HER2-enriched = pink; Basal = red). Source data are provided as a Source data file.
Fig. 3
Fig. 3. Hallmark GSEA and TME analysis.
a Plot of normalized enrichment score (NES) of Molecular Signature Database (MSD) Hallmark gene sets from Gene Set Enrichment Analysis (GSEA) for all PRs vs GRs, GRs vs PRs ESR1LOW and GRs vs PRs ESR1HIGH and PRs ESR1LOW vs PRs ESR1HIGH comparisons. Hallmarks with FDR < 0.05 in any comparison shown. Hallmark genes sets with FDR < 0.05 are shown (red to blue colouring based on significance; grey if >0.05). Hallmarks are coloured by biological process categories as shown in legend. b Plot of single samples GSEA score correlations between MSD Hallmark gene sets for GRs and PRs ESR1HIGH. Plot of log2 FC PRs ESR1HIGH – GRs for individual genes within MSD Hallmark gene sets that are significantly different between PRs ESR1HIGH and GRs in GSEA (c) and all Consensus Tumour Microenvironment (TME) breast cancer gene sets (d). FDR values from GSEA analysis. Hallmarks are coloured by biological process category. Source data are provided as a Source data file.
Fig. 4
Fig. 4. Estradiol levels and correlations with oestrogen response.
a Violin/Boxplot of estradiol (E2) levels in POETIC patients (red = PRs ESR1LOW; orchid = PRs ESR1HIGH; blue = GRs). b Estradiol levels and single sample Gene Set Enrichment Analysis (ssGSEA) enrichment scores for Molecular Signature Database Hallmark Oestrogen Response Early genes for GRs (blue) and PRs ESR1HIGH (orchid). c Violin/Boxplot of estradiol (E2) levels in GRs (blue boxplots) and PRs ESR1HIGH (orchid boxplots) for HER2-E (pink outlines), LumA (blue outlines) and LumB (light blue outlines). Basal subtypes not shown due to small number of these subtypes. Boxplots present 25th, 50th (median), and 75th percentile values. Whiskers extend no larger than ±1.5 times the inter-quartile range with outliers plotted individually beyond this range. The number of independent samples used for comparisons between GRs and PRs is shown. Significant differences (p < 0.05) determined by two-sided Mann–Whitney tests. Source data are provided as a Source data file.
Fig. 5
Fig. 5. TILs and correlations with Hallmark processes and TME.
a Violin/Boxplot of TILs per AI response group. Spearman correlations of TILs and Consensus Tumour Microenvironment (TME) breast cancer (b) and Molecular Signature Database Hallmark gene sets (c) single sample Gene Set Enrichment Analysis (ssGSEA) scores from only GRs and PRs ESR1HIGH or from all data GRs and PRs combined. Significant correlations (FDR < 0.05) are shown. d Violin/Boxplot of TILs for subtypes within GRs (blue boxplots) and PRs ESR1HIGH (orchid boxplots) for HER2-E (pink outlines), LumA (blue outlines) and LumB (light blue outlines). Basal subtypes not shown due to small number of these subtypes. Boxplots present 25th, 50th (median), and 75th percentile values. Whiskers extend no larger than ±1.5 times the inter-quartile range with outliers plotted individually beyond this range. The number of independent samples used for comparisons between GRs and PRs is shown. Significant differences (p < 0.05) determined by two-sided Mann–Whitney tests. Source data are provided as a Source data file.
Fig. 6
Fig. 6. mIF and correlations with cell markers, hallmarks and TME.
a Representative image of scanned needle core biopsy of breast showing tumour regions outlined in cyan and positive for ER (Opal 620, Orange), and immune active stroma showing CD3 (Opal 690, Red), FOXP3 (Opal 570, Yellow), CD3/FOXP3 (Red + Yellow), CD20 (Opal 520, Green), CD68 (Opal 780, White), and nuclei (DAPI, Blue). Scale bar = 100 µm. Turquoise outline of tumour compartment (ER+ cells) and cells outside tumour compartment are mapped as stroma. Red box indicating section of slide shown in subsequent panels that highlight the immune active stroma: b CD3, c FOXP3, d CD3/FOXP3, e CD20, f CD68. Scale bar in (bf) = 20 µm. For each patient, a single 5 µm section was mounted on a slide, stained and cell density (cells/µm2) quantified. Spearman correlations between density of immune markers for tumour/stroma compartments and expressed genes that encode the immune markers (g), genes encoding the protein markers except CD68 as gene expression values were too low (h), single sample Gene Set Enrichment Analysis (ssGSEA) Molecular Signature Database Hallmark gene set scores (i), Consensus Tumour Microenvironment (TME) breast cancer gene set scores (j). Significant Spearman correlations (FDR < 0.05) are shown. Source data are provided as a Source data file.
Fig. 7
Fig. 7. Oncoplot and barplots of top somatic mutations.
a Oncoplot of top mutated genes (>1%) with all patients in substudy with top barplot showing tumour mutation burden. Barplots of top 10 genes showing differences between % mutated in GRs and PRs ESR1HIGH (b) and mutated in GRs and PRs ESR1Low (c). Ranking of genes, p-values and adjusted p-values based on mafCompare function in maftools. Plots include variant classifications (frame-shift deletions—blue, frame-shift insertions—purple, missense—green, nonsense—red, nonstop—light blue, splice site—orange, in-frame deletion—yellow, in-frame insertion—dark red, and multi-hit—black). Source data are provided as a Source data file.
Fig. 8
Fig. 8. TILs, TP53 mutations and copy number alterations.
a Violin/Boxplot of TILs associated with TP53 status in GRs, PRs ESR1HIGH and PRs ESR1LOW. Boxplots present 25th, 50th (median), and 75th percentile values. Whiskers extend no larger than ±1.5 times the inter-quartile range with outliers plotted individually beyond this range. The number of independent samples used for comparisons between GRs and PRs is shown. Significant differences (p < 0.05) determined by two-sided Mann–Whitney tests. b Barplot of the percent of tumours with TP53 mutations for LumA, LumB and HER2-E subtypes in GRs, PRs ESR1HIGH. c Plots of the percent of GRs (blue) or PRs ESR1HIGH (orchid) with gains or losses at individual chromosomal locations. Purple bars highlight regions with significant differences between GRs and PRs ESR1HIGH (Fisher-exact test with FDR/Benjamini and Hochberg adjustment). d Percent of patients with TP53 mutations and/or loss of copy number. Source data are provided as a Source data file.
Fig. 9
Fig. 9. Top features for GRs and PRs categories.
Oncoplot of top features of AI resistance across PRs (a), PRs ESR1LOW (b), PRs ESR1HIGH (c), and GRs (d). Low oestrogen response (based on Hallmark Oestrogen Response Early ssGSEA scores), low E2 levels, high TILs, and high expression of EGFR determined by median expression of these features across all samples. Source data are provided as a Source data file.

Similar articles

Cited by

References

    1. Smittenaar CR, Petersen KA, Stewart K, Moitt N. Cancer incidence and mortality projections in the UK until 2035. Br. J. Cancer. 2016;115:1147–1155. doi: 10.1038/bjc.2016.304. - DOI - PMC - PubMed
    1. Pan H, et al. 20-Year risks of breast-cancer recurrence after stopping endocrine therapy at 5 years. N. Engl. J. Med. 2017;377:1836–1846. doi: 10.1056/NEJMoa1701830. - DOI - PMC - PubMed
    1. Hanker AB, Sudhan DR, Arteaga CL. Overcoming endocrine resistance in breast cancer. Cancer Cell. 2020;37:496–513. doi: 10.1016/j.ccell.2020.03.009. - DOI - PMC - PubMed
    1. Dubsky P, et al. EndoPredict improves the prognostic classification derived from common clinical guidelines in ER-positive, HER2-negative early breast cancer. Ann. Oncol. 2013;24:640–647. doi: 10.1093/annonc/mds334. - DOI - PMC - PubMed
    1. Paik S, et al. A multigene assay to predict recurrence of tamoxifen-treated, node-negative breast cancer. N. Engl. J. Med. 2004;351:2817–2826. doi: 10.1056/NEJMoa041588. - DOI - PubMed

Publication types