. 2023 Jul 7;14(1):4011.
doi: 10.1038/s41467-023-39745-2.

Porous microneedle patch with sustained delivery of extracellular vesicles mitigates severe spinal cord injury

Affiliations

Porous microneedle patch with sustained delivery of extracellular vesicles mitigates severe spinal cord injury

Ao Fang et al. Nat Commun. .

Erratum in

Abstract

The transplantation of mesenchymal stem cells-derived secretome, particularly extracellular vesicles is a promising therapy to suppress spinal cord injury-triggered neuroinflammation. However, efficient delivery of extracellular vesicles to the injured spinal cord, with minimal damage, remains a challenge. Here we present a device for the delivery of extracellular vesicles to treat spinal cord injury. We show that the device incorporating mesenchymal stem cells and porous microneedles enables the delivery of extracellular vesicles. We demonstrate that topical application to the spinal cord lesion beneath the spinal dura, does not damage the lesion. We evaluate the efficacy of our device in a contusive spinal cord injury model and find that it reduces the cavity and scar tissue formation, promotes angiogenesis, and improves survival of nearby tissues and axons. Importantly, the sustained delivery of extracellular vesicles for at least 7 days results in significant functional recovery. Thus, our device provides an efficient and sustained extracellular vesicles delivery platform for spinal cord injury treatment.


Conflict of interest statement

Zhejiang University has filed a patent application (application number: 2022108442387, applied) related to this work, with X.W., A.F., and B.G. listed as inventors. X.W. is a scientific co-founder of WeQure AI Ltd. All the other authors declare no competing interests.

Figures

Fig. 1
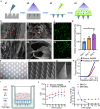
Fig. 1. Schematic illustration of MN-MSC patch implantation at the site of the spinal cord injury.
a Schematic depicting exosomes embedded in GelMA hydrogel. b Schematic of the MN-MSC patch. c Representative microscopy images showing MSCs in the patch. d Representative morphological images of the Microneedle patch. e Representative microscopy images of the MN-MSC patch applied to the spinal cord. f Analysis of hindlimb function including joint angle. g Illustration of hindlimb movement. h Electrophysiological analysis of hindlimb movement.
Fig. 2
Fig. 2. Fabrication and characterization of the MN-MSC patch.
a Schematic of the MN-MSC patch fabrication process by a1) casting, a2) blue light crosslinking, a3) peeling from the PDMS mold and adding GelMA solution with MSCs, and a4) blue light crosslinking. b SEM image of the b1) interstructure of traditional and b2) porous GelMA hydrogels. Scale bars of images (b1, b2) indicate 300 µm, and scale bars of images (b3, b4) indicate 100 µm. The experiment was repeated 3 times independently with similar results. c Calcein AM (live)/EthD (dead) staining revealed the morphology and viability of MSCs encapsulated in GelMA hydrogel on c1) day 3 and c2) day 5. Scale bars: 200 μm. d Quantitative viability analysis of MSCs encapsulated in GelMA hydrogel on days 1, 3 and 5. Data are presented as the means ± SEM (n = 4 independent GelMA hydrogels with MSCs). Statistical analysis was performed using one-way ANOVA followed by Tukey’s multiple comparisons test and two-tailed paired t tests were used for comparisons between two groups. Total: F = 6.808, p = 0.0158. Day 1 vs Day 3, p = 0.2211; Day 1 vs Day 5, p = 0.0125; Day 3 vs Day 5, p = 0.1994. * indicates p < 0.05. e Representative optical microscopy images and (f, g) SEM images of MNs. Scale bars for images (f) indicate 500 µm, and scale bars for images (g) indicate 50 µm. The experiment was repeated 3 times independently with similar results. h The mechanical strength of MNs. i Schematic showing the study design used to test the release profile of exosomes from the MN-MSC patch. j The daily proteins release curves of MN-MSC patches fabricated with porous and normal GelMA hydrogels. Data are presented as the means ± SEM (n = 3 independent patches for each group). k The daily exosome release curves of MN-MSC and MN-EV patches. Data are presented as the means ± SEM (n = 3 independent patches for each group).
Fig. 3
Fig. 3. Sustained MSC-EV delivery by MN-MSC patch treatment alleviates neuroinflammation triggered by SCI.
a Schematic illustration of MN-MSC patch implantation on the injury site of the spinal cord. b In vivo distribution of exosomes (DiI labeled, red) in the injured spinal cord tissues after MN-EV patch implantation, blue (DAPI). Scale bar: 1 mm. The injury region of the spinal cord is marked with yellow dotted lines. c Heatmaps of exosome distribution in the injured spinal cord tissues after MN-EV patch implantation; red: the highest numbers of exosomes, blue: the lowest, and white: background. The injury region of the spinal cord is marked with yellow dotted lines. b1, b2, c1, c2) Enlarged images to show the details. Scale bar: 100 μm. d HE staining of the injured spinal cord with MN-MSC patch implantation; scale bar: 1 mm. The experiment was repeated 3 times independently with similar results. The experiment was repeated 3 times independently with similar results. e Representative images of immunohistochemical staining for MN-MSC patches on the injured spinal cord on day 7 after SCI. Green (GFAP), blue (DAPI), red (GAPDH), scale bar: 1 mm. The experiment was repeated 3 times independently with similar results. f High-magnification images of the boxed area, scale bar: 50 µm. The experiment was repeated 3 times independently with similar results.
Fig. 4
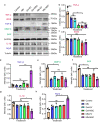
Fig. 4. Genetic expression analysis of the injured spinal cord tissues.
a Representative immunoblots showing expression of TNF-α, iNOS, MMP-9, TGF-β, BAX, IL-1β, and Arg-2 in the injury site 1 week after SCI (red font represents proinflammatory markers, blue font represents anti-inflammatory markers, and green font represents anti-apoptotic/inflammatory markers; GAPDH and Tubulin were used as loading controls). The experiment was repeated 3 times independently with similar results. bh Quantitative analyses of the genetic expression levels of TNF-α (b), iNOS (c), TGF-β (d), MMP-9 (e), BAX (f), IL-1β (g), and Arg-2 (h) in the injury site. n = 3 animals chosen randomly from each group. Data are presented as the mean ± SEM. Statistical analysis was performed using one-way ANOVA followed by Tukey’s multiple comparisons test and two-tailed paired t tests were used for comparisons between two groups. ANOVA for TNF-α: Total: F = 24.27, p < 0.0001, Control vs MN, p = 0.0164, Gel-EV vs MN-MSC, p = 0.0493. ANOVA for iNOS: Total: F = 3.178, p = 0.0468. ANOVA for TGF-β: Total: F = 43.96, p < 0.0001. MN-EV vs. MN-MSC, p = <0.0001. ANOVA for MMP-9: Total: F = 17.14, p < 0.0001. Control vs MN-MSC, p < 0.0001. ANOVA for BAX: Total: F = 11.18, p = 0.0003. Control vs MN-EV, p = 0.0391. MN-EV vs MN-MSC, p = 0.0373. ANOVA for IL-1β: Total: F = 6.960, p = 0.0029. MN-EV vs MN-MSC, p = 0.0178. ANOVA for Arg-2: Total: F = 9.560, p = 0.0007. MN-EV vs MN-MSC, p = 0.0388. *p < 0.05, **p < 0.01, ***p < 0.001.
Fig. 5
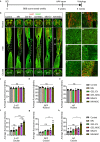
Fig. 5. Protection of spared axons with MN-MSC patch treatment after SCI.
a Schematic diagram of the experimental design. The MN or MN-MSC patch was implanted 3 h after SCI, the AAV tracer for axons was injected at 6 weeks after injury, and the histological study was performed at 8 weeks after injury. b Representative images of spinal sections stained with GFAP (green) and 5-HT (red) of rats in the six groups at 8 weeks after SCI. Solid lines indicate the boundary of the cavities. Scale bars for rostral and caudal indicate 500 µm and inter indicate 1 mm. b1–b8 show the details of the black boundary area, and the scale bars are 100 µm. Representative images of propriospinal axons (RFP labeled, Fig. S6) and NF axons (Fig. S7) in SCI rats with different treatments are shown in supplementary figures. ch Quantification of the average fluorescence intensity of 5-HT (c), RFP (d), and NF (e) immunoreactivity on the rostral and caudal sides of the six groups with 5-HT (f), RFP (g), and NF (h) staining. Data are shown as the mean ± SEM. Statistical analysis was performed using one-way ANOVA followed by Tukey’s multiple comparisons test and two-tailed paired t tests were used for comparisons between two groups. Control: n5-HT = 4, nRFP = 4, nNF = 4. MN: n5-HT = 3, nRFP = 3, nNF = 4. Gel-EV: n5-HT = 3, nRFP = 3, nNF = 3. Gel-MN: n5-HT = 3, nRFP = 3, nNF = 3. MN-EV: n5-HT = 4, nRFP = 4, nNF = 4. MN-MSC: n5-HT = 5, nRFP = 4, nNF = 4. These animals chosen randomly from each group. ANOVA for 5-HT of rostral: Total: F = 0.2836, p = 0.9152. ANOVA for 5-HT of caudal: Total: F = 47.76, p < 0.0001, Control vs MN-MSC, p < 0.0001, GEL-MSC vs MN-MSC, p < 0.0001, MN-EV vs MN-MSC, p = 0.0134. ANOVA for RFP of rostral: Total: F = 1.243, p = 0.3380. ANOVA for RFP of caudal: Total: F = 12.13, p < 0.0001, MN-EV vs MN-MSC, p = 0.0013. ANOVA for NF of rostral: Total: F = 1.167, p = 0.3675. ANOVA for NF of caudal: Total: F = 9.322, p = 0.0003, MN-EV vs MN-MSC, p = 0.01. *p < 0.05, **p < 0.01, ***p < 0.001.
Fig. 6
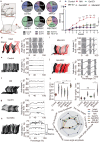
Fig. 6. The hindlimb locomotor functional recovery of rats that underwent MN-MSC patch treatment after SCI.
a Schematic illustration of hindlimb locomotor joint. b Distribution of BBB scores of rats in six treatment groups at 8 weeks after SCI. c Comparison of weekly BBB scores among rats in the six treatment groups at 8 weeks after SCI. Data are shown as the mean + SEM. Two-way ANOVA with Tukey’s post-hoc test was used for comparisons among multiple groups, and two-tailed paired t tests were used for comparisons between two groups. Control: n = 9, MN: n = 8, Gel-EV: n = 9, Gel-MSC: n = 10, MN-EV: n = 10, MN-MSC: n = 11 independent animals. Total: F = 2.928, p < 0.0001. 4 weeks: MN-EV vs MN-MSC, p < 0.0001. 5 weeks: MN-EV vs MN-MSC, p < 0.0001. 4 weeks: MN-EV vs MN-MSC, p < 0.0001. 5 weeks: MN-EV vs MN-MSC, p = 0.0001. 6 weeks: MN-EV vs MN-MSC, p < 0.0001. 7 weeks: MN-EV vs MN-MSC, p < 0.0001. 8 weeks: MN-EV vs MN-MSC, p < 0.0001. *p < 0.05, **p < 0.01, ***p < 0.001. dj Color-coded stick views and angle degree curves from intact (d), control (e), MN (f), Gel-EV (g), Gel-MSC (h), MN-EV (i), and MN-MSC (j) groups. k, l Quantitative analysis of body strike length (k) and weight support (l). One-way ANOVA followed by Tukey’s post-hoc test was used for comparisons among multiple groups and two-tailed paired t tests were used for comparisons between two groups. n = 3 independent animals. ANOVA for body strike length, Total: F = 9.771, p = 0.0007. Control vs MN, p = 0.0142, MN-EV vs MN-MSC, p = 0.0028. ANOVA for weight support, Total: F = 20.31, p < 0.0001, MN-EV vs MN-MSC, p = 0.0013. *p < 0.05, **p < 0.01, ***p < 0.001. The violin plot center indicates the median in all planes. Violin range covers 97.5th and 2.5th percentiles; extending whiskers show data distribution and probability density. Violin areas remain constant. Boxplot centerlines signify medians; boxes show first and third quartiles (Q1, Q3); whiskers extend from Q1 − 1.5xIQR to Q3 + 1.5xIQR; outliers lie outside whiskers. m Radar graph quantification of seven behavioral features of rats in the six treatment groups. For more details, see Fig. S10.
Fig. 7
Fig. 7. Electrophysiological recording experiments revealed the superior muscle control of rats treated with the MN-MSC patch.
a Schematic diagram of the experimental design. b Schematic illustration of SEEP and EMG experiments. c Representative relative SSEPs of each group (N trial = 150) are illustrated as the mean (solid line) and 95% confidence interval (shadow enveloped by a dashed line), and the time of electric stimulation was set to zero ms. d, e The representative TA(d) and GS(e) muscle EMG for rats of different groups. f Peak-to-peak potential was analyzed with one-way ANOVA followed by Tukey’s post-hoc test. Two-tailed paired t tests were used for comparisons between two groups. Data are shown as the mean ± SEM. n = 3 animals chosen randomly from each group. Total: F = 46.59, p < 0.0001, MN vs MN-EV, p = 0.0221, Intact vs MN-MSC, p = 0.0092, MN vs MN-MSC, p < 0.0001, Gel-MSC vs MN-MSC, p = 0.0003, MN-EV vs MN-MSC, p = 0.0054. *p < 0.05, **p < 0.01, ***p < 0.001. g, h Quantitative analysis of signal amplitudes from TA(g) and GS(h) muscles for rats in different groups. One-way ANOVA with Tukey’s post-hoc test for comparisons among multiple groups (*) and two-tailed paired t tests were used for comparisons within groups (#) for the data shown in the violin plot. The violin plot center indicates the median in all planes. Violin range covers 97.5th and 2.5th percentiles; extending whiskers show data distribution and probability density. Violin areas remain constant. Boxplot centerlines signify medians; boxes show first and third quartiles (Q1, Q3); whiskers extend from Q1 − 1.5xIQR to Q3 + 1.5xIQR; outliers lie outside whiskers. Intact: nTA = 41, nGS = 41, control: nTA = 6, nGS = 6, MN: nTA = 6, nGS = 5, Gel-EV: nTA = 9, nGS = 5, Gel-MSC: nTA = 9, nGS = 8, MN-EV: nTA = 35, nGS = 27, and MN-MSC: nTA = 13, nGS = 6 trials for each group. ANOVA for TA: Total: F = 78.441794, p = 8.507914 × 10−38, Intact vs MN-EV, p < 0.0001. MN-EV vs MN-MSC, p = 9.853309 × 10⁻⁹. ANOVA for GS: Total: F = 13.718067, p = 4.86509 × 10⁻¹¹. Intact vs MN-EV, p = 8.533763 × 10⁻⁴. MN vs MN-EV, p = 4.474681 × 10⁻³. MN-EV vs MN-MSC, p = 4.238509 × 10⁻⁵. ***p (or ###p) <0.001, **p (or ##p) <0.01, *p (or #p) < 0.05.

References

    1. Collaborators G. N. Global, regional, and national burden of neurological disorders, 1990–2016: a systematic analysis for the Global Burden of Disease Study 2016. Lancet Neurol.18, 459–480 (2019). - PMC - PubMed
    1. Liu Z, et al. High-dose methylprednisolone for acute traumatic spinal cord injury: a meta-analysis. Neurology. 2019;93:e841–e850. doi: 10.1212/WNL.0000000000007998. - DOI - PubMed
    1. Inglis T, et al. In-hospital mortality for the elderly with acute traumatic spinal cord injury. J. Neurotrauma. 2020;37:2332–2342. doi: 10.1089/neu.2019.6912. - DOI - PMC - PubMed
    1. Ahuja CS, et al. Traumatic spinal cord injury. Nat. Rev. Dis. Prim. 2017;3:1–21. - PubMed
    1. Bains M, Hall ED. Antioxidant therapies in traumatic brain and spinal cord injury. Biochim. Biophys. Acta. 2012;1822:675–684. doi: 10.1016/j.bbadis.2011.10.017. - DOI - PMC - PubMed

Publication types