. 2023 Jul 7;14(1):4022.
doi: 10.1038/s41467-023-39515-0.

Plakoglobin is a mechanoresponsive regulator of naive pluripotency

Affiliations

Plakoglobin is a mechanoresponsive regulator of naive pluripotency

Timo N Kohler et al. Nat Commun. .

Abstract

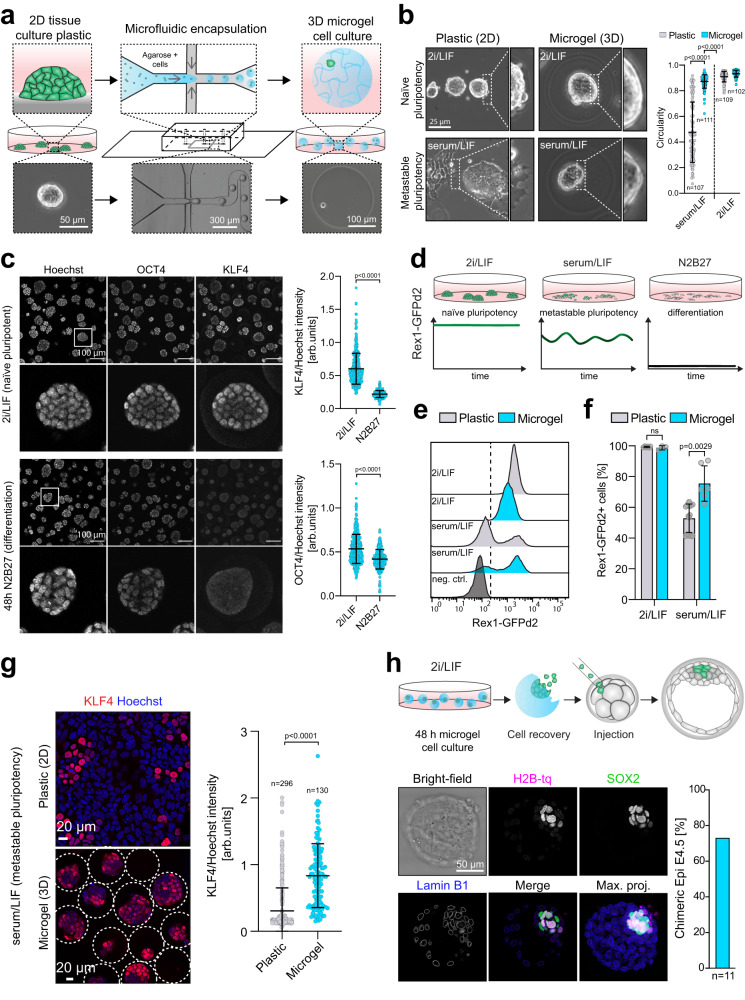
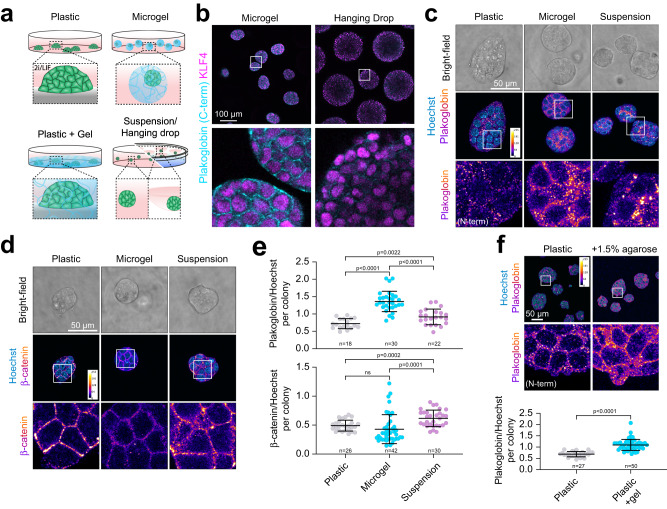
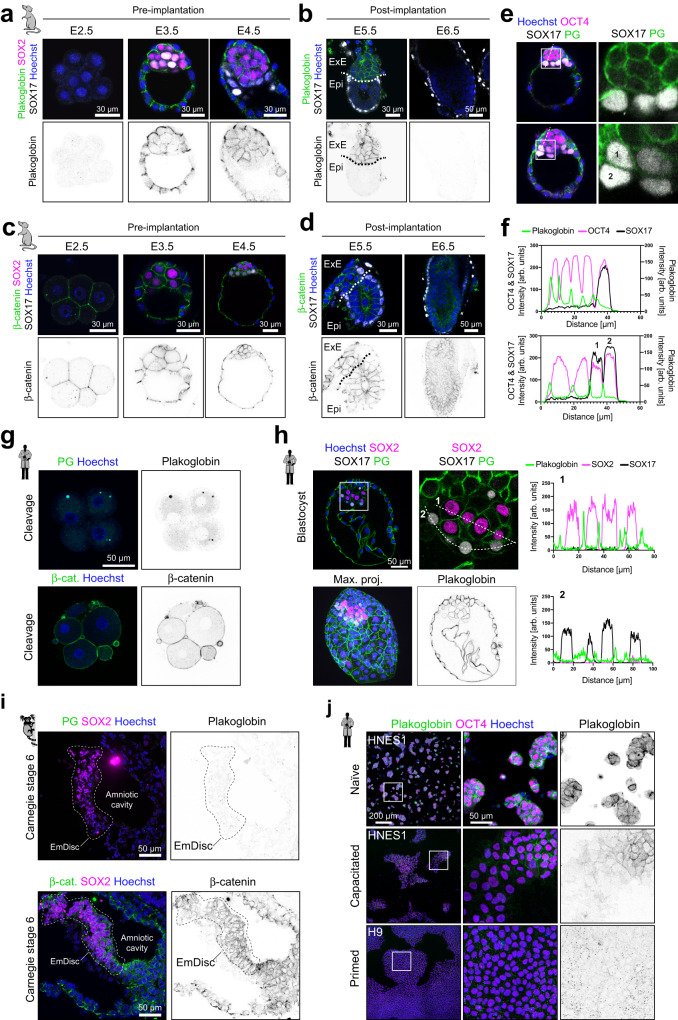
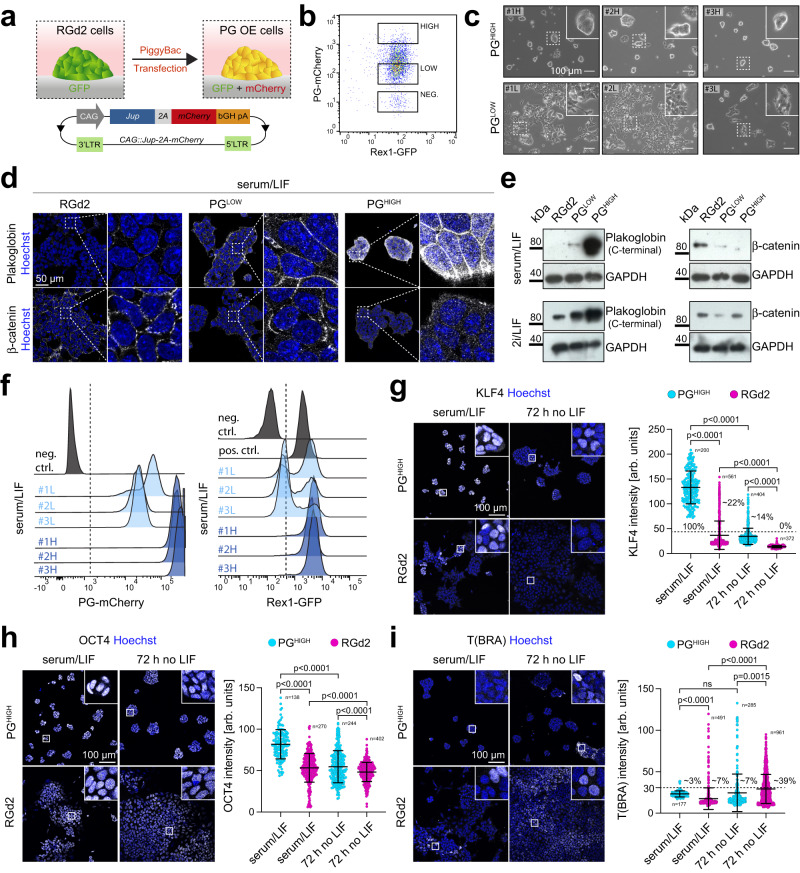
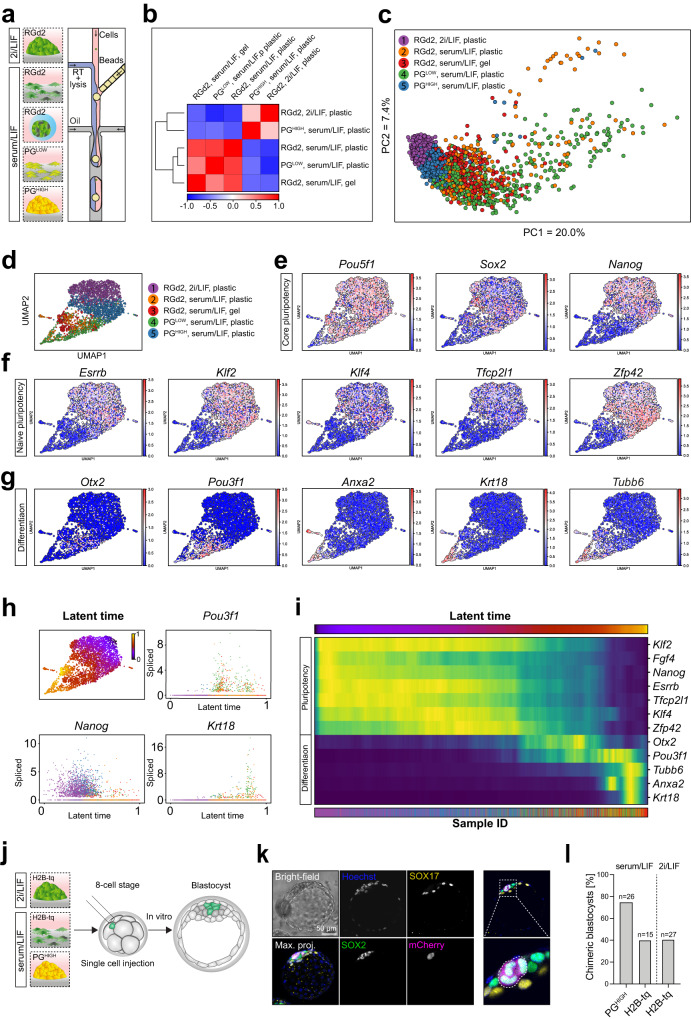
Biomechanical cues are instrumental in guiding embryonic development and cell differentiation. Understanding how these physical stimuli translate into transcriptional programs will provide insight into mechanisms underlying mammalian pre-implantation development. Here, we explore this type of regulation by exerting microenvironmental control over mouse embryonic stem cells. Microfluidic encapsulation of mouse embryonic stem cells in agarose microgels stabilizes the naive pluripotency network and specifically induces expression of Plakoglobin (Jup), a vertebrate homolog of β-catenin. Overexpression of Plakoglobin is sufficient to fully re-establish the naive pluripotency gene regulatory network under metastable pluripotency conditions, as confirmed by single-cell transcriptome profiling. Finally, we find that, in the epiblast, Plakoglobin was exclusively expressed at the blastocyst stage in human and mouse embryos - further strengthening the link between Plakoglobin and naive pluripotency in vivo. Our work reveals Plakoglobin as a mechanosensitive regulator of naive pluripotency and provides a paradigm to interrogate the effects of volumetric confinement on cell-fate transitions.


Conflict of interest statement

The authors declare no competing interests.

Figures

Fig. 1
Fig. 1. Agarose microgel encapsulation of mouse ESCs supports naive pluripotency.
a Schematic illustration of the microfluidic cell encapsulation process. Tissue culture plastic (2D) mouse ESCs were single cell separated and microfluidically compartmentalized into agarose-in-oil microdroplets. Cell-laden agarose microgels (3D) were cultured in a static suspension culture in low adhesion tissue culture plates. b Phase contrast images of mESCs cultured on tissue culture plastic or encapsulated in microgels in naive pluripotent (2i/LIF) or metastable pluripotent (serum/LIF) conditions. Circularity of mESC colonies was measured using Fiji. The p-values were calculated using a two-tailed unpaired t-test with Welch’s correction; 3 independent experiments. Error bars indicate the mean and standard deviations. c Confocal immunofluorescence images of microgel-encapsulated mESCs stained for the general pluripotency marker OCT4 and the naive pluripotency marker KLF4 after being cultured for 48 h in 2i/LIF (naive pluripotent) or N2B27 (differentiation). KLF4 and OCT4 intensities (as shown on the right) were normalized to Hoechst. Error bars indicate the mean and standard deviations. n = 400 (2i/LIF), n = 285 (N2B27). The p-values were calculated using a two-tailed unpaired t-test with Welch’s correction; 3 independent experiments. d The Rex1::GFPd2 (RGd2) reporter system allows near real-time analysis of pluripotency (destabilized GFP with a half-life of 2 h). Homogenous expression (naive in 2i/LIF), heterogeneous expression (metastable in serum/LIF), and loss of expression upon exit from pluripotency (N2B27). e, f Flow cytometric analysis of RGd2 mESCs cultured on plastic compared to microgels. Negative control: wild-type mESCs. Error bars indicate the mean and standard deviations. The p-values were calculated using a two-tailed unpaired t-test with Welch’s correction. N = 6 (plastic 2i/LIF), N = 3 (microgel 2i/LIF), N = 16 (plastic serum/LIF), N = 6 (microgel serum/LIF). g Confocal immunofluorescence images of serum/LIF cultured (microgel and plastic) mESCs stained for KLF4. KLF4 intensities (as shown on the right) were normalized to Hoechst. Error bars indicate the mean and standard deviations. The p-values were calculated using a two-tailed unpaired t-test with Welch’s correction. n = 296 (plastic), n = 130 (microgel), 3 independent experiments. h Injection of microgel-cultured naive mESCs (nuclear H2B-tq reporter) into 8-cell stage embryos led to ~73% (N = 8/11) blastocysts chimeras 48 h after in vitro culture. Injected cells were identified via the H2B-tq reporter. Cells were stained for Lamin B1 (outlines all nuclei) and SOX2 (epiblast).
Fig. 2
Fig. 2. Transcriptomic analysis of microgel-encapsulated mESCs reveals upregulation of Plakoglobin.
a, b Bulk RNA-seq analysis of general (a) and naive (b) pluripotency-associated genes for mESCs cultured on plastic (2D, gray) or encapsulated in microgels (3D, blue) under 2i/LIF culture conditions. Error bars indicate the mean and standard deviations. 3 independent experiments; statistical significance levels are Bonferroni-adjusted p-values computed via two-tailed differential gene expression analysis using the DESeq2 tool. c Volcano plot representing the list of differentially expressed genes between mESCs cultured on tissue culture plastic (negative log2 fold changes in gene expression) or in agarose microgels (positive log2 fold changes in gene expression) in 2i/LIF. Log2 fold change cut-off was |log2 fold change| > 1 and Bonferroni-adjusted p-values cut-off was 10−7. NS stands for not-significant (gray), Log2 FC (green color) indicates gene that passed the log2 fold change cut-off, P (blue) indicates genes that passed p-value cut-off, P&Log2 FC (red) indicates genes that passed log2 FC and p-value cut-offs (see full list of differentially expressed genes in Supplementary Data 1). d 3D microgel culture led to a significant upregulation at gene expression level of Plakoglobin (Jup) and p120 (Ctnnd1) compared to 2D plastic culture conditions. Error bars indicate the mean and standard deviations. 3 independent experiments; statistical significance levels are Bonferroni-adjusted p-values computed via two-tailed differential gene expression analysis using the DESeq2 tool. e Confocal immunofluorescence images of naive pluripotent (2i/LIF) mESCs cultured on plastic and encapsulated in microgels stained for Plakoglobin. Plakoglobin levels were quantified for colonies grown on plastic (n = 23) and in microgels (n = 25). Error bars indicate the mean and standard deviations. The p-values were calculated using a two-tailed unpaired t-test with Welch’s correction; 3 independent experiments. f Confocal immunofluorescence images of naive pluripotent (2i/LIF) mESCs culture on plastic and encapsulated in microgels stained for β-catenin. β-catenin levels were quantified for colonies grown on plastic (n = 21) and in microgels (n = 26). Error bars indicate the mean and standard deviations. The p-values were calculated using a two-tailed unpaired t-test with Welch’s correction; 3 independent experiments.
Fig. 3
Fig. 3. Microgel-mediated volumetric confinement induces mechanoresponsive Plakoglobin expression in mESCs.
a Schematic cell culture formats: conventional 2D-tissue culture plastic, agarose microgel encapsulation, 2D-tissue culture plastic overlaid with a bulk agarose gel and suspension/hanging drop culture. b Confocal immunofluorescence images of naive pluripotent (2i/LIF) mESCs cultured as hanging drops or microgel-encapsulated. Cells were stained for Plakoglobin (C-term) and KLF4 (naive pluripotency marker) after 48 h in culture. Representative of 3 independent experiments. c, d Confocal immunofluorescence images of naive pluripotent (2i/LIF) mESCs on tissue culture plastic (2D), in microgels (3D confined) or as suspension culture (3D unconfined) after 48 h. Cells were stained for (c) Plakoglobin and (d) β-catenin. e Quantification of Plakoglobin and β-catenin intensities per colony normalized by Hoechst. Error bars indicate the mean and standard deviations. p-values were determined by a two-tailed unpaired t-test with Welch’s correction; 3 independent experiments. f mESCs were cultured for 48 h on tissue culture plastic or on plastic overlaid with 1.5% agarose. Immunofluorescence analysis of Plakoglobin (N-term) showed an increase upon gel-mediated confinement in 2D. Error bars indicate the mean and standard deviations. n = 27 (Plastic), n = 50 (Plastic + 1.5% agarose). The p-values were calculated using a two-tailed unpaired t-test with Welch’s correction; 3 independent experiments.
Fig. 4
Fig. 4. Plakoglobin expression is evolutionarily conserved and associated with pre-implantation pluripotency.
a Confocal immunofluorescence images of pre-implantation embryos (E2.5, E3.5, and E4.5) stained for Plakoglobin, SOX2 (epiblast marker) and SOX17 (primitive endoderm marker, pre-implantation). Plakoglobin expression in the epiblast coincides with the emergence of naive pluripotency in the pre-implantation epiblast. Scale bar: 30 µm. Representative of n ≥ 3 embryos. b Confocal immunofluorescence images of post-implantation embryos (E5.5 and E6.5) stained for Plakoglobin and SOX17 (visceral endoderm marker, post-implantation). In the post-implantation embryo Plakoglobin expression was restricted to the extraembryonic ectoderm (ExE) and completely absent in the epiblast (Epi) at E5.5. Scale bar: 30 µm. Representative of n ≥ 3 embryos. c Confocal immunofluorescence images of pre-implantation embryos (E2.5, E3.5, and E4.5) stained for β-catenin, SOX2 (epiblast marker) and SOX17 (primitive endoderm marker, pre-implantation). β-catenin was detected in all cell lineages throughout pre-implantation development. Scale bar: 30 µm. Representative of n ≥ 3 embryos. d Confocal immunofluorescence images of post-implantation embryos (E5.5 and E6.5) stained for β-catenin and SOX17 (visceral endoderm marker, post-implantation). β-catenin remained detectable in the post-implantation epiblast (Epi) and extraembryonic ectoderm (ExE). Scale bar: 30 µm. Representative of n ≥ 3 embryos. e, f Confocal immunofluorescence images of blastocysts (~E4.25) stained for Plakoglobin, OCT4 (epiblast marker), and SOX17 (primitive endoderm marker). Fluorophore intensities were quantified along the white line marked in the merged image and are shown in (f). Primitive endoderm cells lost Plakoglobin expression once sorted to the inner cell mass’ surface. Scale bar: 30 µm. Representative of n ≥ 3 embryos. g Representative confocal immunofluorescence images of human cleavage stage embryos stained for Plakoglobin (N = 3) and β-catenin (N = 2). Scale bar: 50 µm. h Confocal immunofluorescence images of a human blastocyst (day 7, N = 4) stained for SOX2 (epiblast marker), SOX17 (hypoblast marker) and Plakoglobin. Fluorophore intensities were quantified along the white line and are shown on the right. Scale bar: 50 µm. i Confocal immunofluorescence images of Carnegie stage 6 (CS6) post-implantation marmoset embryos stained for Plakoglobin (PG), β-catenin, and SOX2 (epiblast marker). Scale bar: 50 µm. j Confocal immunofluorescence images of human pluripotent stem cells. Naive HNES1 cells, capacitated HNES1 cells, and primed H9 cells were stained for Plakoglobin and OCT4. Representative of 3 independent experiments.
Fig. 5
Fig. 5. Plakoglobin expression promotes naive pluripotency in metastable culture conditions.
a Schematic of the generation of Plakoglobin overexpressing RGd2 mESCs (PG OE). Jup (Plakoglobin) expression was placed under the control of a constitutively active CAG promoter and coupled to an mCherry fluorophore via a 2A self-cleaving peptide (CAG::Jup-2A-mCherry). This cell line simultaneously allowed monitoring of pluripotency via the Rex1-GFPd2 reporter and indicated the level of Plakoglobin via the mCherry signal. bGH pA: bovine growth hormone polyadenylation signal, LTR: long terminal repeats. b Flow cytometric analysis of PG OE mESCs. Single cells were sorted to generate clonal populations of mESCs with high (PGHIGH) or low (PGLOW) levels of Plakoglobin overexpression. c Phase contrast images of clonally expanded PGLOW (#1L, #2L, #3L) and PGHIGH (#1H, #2H, #3H) cells cultured in serum/LIF. Scale bar: 100 µm. Representative images for more than 10 passages. d Confocal immunofluorescence images of RGd2, PGLOW#2, and PGHIGH#3 cells stained for Plakoglobin (PG) and β-catenin. Scale bar: 50 µm. Representative of 3 independent experiments. e Western blot analysis for Plakoglobin and β-catenin in RGd2, PGLOW, and PGHIGH cells in serum/LIF and 2i/LIF. GAPDH was used as loading control. Representative of 3 independent experiments. f Flow cytometric analysis of the established clonal cell lines PGLOW (#1L, #2L, #3L) and PGHIGH (#1H, #2H, #3H) when cultured in serum/LIF. All PGHIGH clones displayed a homogeneous Rex1-GFPd2 signal indicating acquisition of naive-like pluripotent state. gi Confocal immunofluorescence images of RGd2 and PGHIGH cells cultured in metastable pluripotent (serum/LIF) conditions and after 72 h of LIF withdrawal stained for the naive pluripotency marker KLF4 (g), the general pluripotency marker OCT4 (h), and the mesoderm marker T(BRA) (i). Scale bar: 100 µm. Bottom: Nuclear fluorophore intensity quantification. For KLF4 and T (BRA), positive cells (KLF4 threshold: 45 arb. units; T (BRA) threshold: 30 arb. units) are indicated in [%]. Error bars indicate the mean and standard deviations. p-values were determined by a two-tailed unpaired t-test with Welch’s correction; 3 independent experiments.
Fig. 6
Fig. 6. Single-cell sequencing elucidates plakoglobin-induced re-establishment of naive pluripotency.
a Schematic of the different samples (RGd2 in serum/LIF in microgels and on plastic, PGlow and PGhigh cells in serum/LIF on plastic and naive control RGd2 cells in 2i/LIF on plastic) subjected to scRNA-seq analysis using the inDrop workflow. (RT: reverse transcriptase). b Pearson correlation heatmap of samples listed in (a). c Principal component (PC) analysis of samples listed in (a). d Uniform Manifold Approximation and Projection (UMAP) dimensional reduction plot of the scRNA-seq samples, for the maps of individual markers (in eg). e Gene-expression values projected on the UMAP plot for core pluripotency markers (Pou5f1, Sox2, and Nanog). f Gene-expression values projected on the UMAP plot for naive pluripotency markers (Esrrb, Klf2, Klf4, Tfcp2l1, and Zfp42). g Gene-expression values projected on the UMAP plot for peri-implantation (Otx2 and Pou3f1) and serum-induced differentiation markers (Anxa2, Krt18, and Tubb6). h (top left) Latent time computation generated using scVelo and projected on the UMAP underlining the continuum between naive pluripotency (latent time = 0) and differentiation (latent time = 1). (top right) Single-cell spliced read counts arranged across the computed latent time for Pou3f1 (top right), Nanog (bottom left), and Krt18 (bottom right). i Heatmap representing the changes in gene expression across all cells arranged by latent time progression. j Schematic of single-cell injection into 8-cell stage embryos with subsequent in vitro culture until the blastocyst stage. k Confocal immunofluorescence image of a chimeric blastocyst that was injected at the 8-cell stage with a single serum/LIF cultured PGHIGH mESC. Blastocysts were stained for SOX2 (epiblast marker) and SOX17 (primitive endoderm marker). PGHIGH cells were identified by the PG-mCherry signal as shown in the merged image and highlighted by the white dotted line. Scale bar: 50 µm. l Chimeric blastocyst contribution efficiency of PGHIGH cells in serum/LIF (N = 26 embryos) and control H2B-tq cells in naive (2i/LIF; N = 27 embryos) and metastable pluripotent (serum/LIF; N = 15 embryos) conditions. Single cells were injected at the 8-cell stage followed by in vitro culture until blastocyst stage.
Fig. 7
Fig. 7. Plakoglobin sustains pluripotency independently of β-catenin.
a Experimental layout of culture conditions to assess Plakoglobin’s potential to maintain naive pluripotency. PD (MEK inhibitor) CH (WNT agonist). bd Flow cytometric analysis of the Rex1-GFPd2 reporter in the PGHIGH (clone #1 and #3), PGLOW, and RGd2 cell lines. Cells were cultured up to 16 days with the sole supplementation of PD (b), LIF (c), or CH (d). The error bars show the standard deviations of 3 independent experiments. e Flow cytometric analysis of the Rex1-GFPd2 reporter in the surviving cell lines (established from bd) after treatment with the WNT-signaling antagonist XAV. f Confocal immunofluorescence images of PGHIGH, PGHIGH Ctnnb1 KO (clone #2, #10, and #12) and wild type control cells in 2i/LIF stained for β-catenin and Plakoglobin. Scale bar: 10 µm. Representative of 3 independent experiments. g Phase contrast images of PGHIGH Ctnnb1 KO (clone #2, #10, and #12) cells cultured in 2i/LIF or with the single supplementation of LIF, PD for 30 days. Scale bar: 500 µm. h Flow cytometric analysis of the Rex1-GFPd2 reporter in PGHIGH Ctnnb1 KO (clone #2, #10, and #12) cells when cultured with the sole supplementation of LIF, PD, or CH. Cells were analyzed every 48 h for up to 30 days. The error bars show the standard deviations of 3 independent experiments. i Confocal immunofluorescence images of RGd2 and PGHIGH Ctnnb1 KO (clone #2, #10, and #12) cells cultured in 2i/LIF, LIF-only, and PD-only stained for the naive pluripotency marker KLF4. Scale bar: 50 µm. Representative of 3 independent experiments. j Representative confocal immunofluorescence images of mouse embryo chimeras. 8-cell embryos were aggregated with 3–5 control (N = 19 embryos) or PGHIGH Ctnnb1 KO#12 (N = 24 embryos) cells and cultured in vitro until a post-implantation-like state (see “Methods”) and stained for NANOG and OTX2. Scale bar 50 µm.

Similar articles

Cited by

References

    1. Rheinlaender J, et al. Cortical cell stiffness is independent of substrate mechanics. Nat. Mater. 2020;19:1019–1025. doi: 10.1038/s41563-020-0684-x. - DOI - PMC - PubMed
    1. De Belly H, et al. Membrane tension gates ERK-mediated regulation of pluripotent cell fate. Cell Stem Cell. 2021;28:273–284 e276. doi: 10.1016/j.stem.2020.10.018. - DOI - PMC - PubMed
    1. Bergert M, et al. Cell surface mechanics gate embryonic stem cell differentiation. Cell Stem Cell. 2021;28:209–216 e204. doi: 10.1016/j.stem.2020.10.017. - DOI - PMC - PubMed
    1. Li YW, et al. Volumetric compression induces intracellular crowding to control intestinal organoid growth via Wnt/beta-catenin signaling. Cell Stem Cell. 2021;28:170–172. doi: 10.1016/j.stem.2020.12.003. - DOI - PubMed
    1. Chan CJ, Heisenberg CP, Hiiragi T. Coordination of morphogenesis and cell-fate specification in development. Curr. Biol. 2017;27:R1024–R1035. doi: 10.1016/j.cub.2017.07.010. - DOI - PubMed

Publication types