. 2023 Jul 7;14(1):4029.
doi: 10.1038/s41467-023-39752-3.

Endothelial cell CD36 regulates membrane ceramide formation, exosome fatty acid transfer and circulating fatty acid levels

Affiliations

Endothelial cell CD36 regulates membrane ceramide formation, exosome fatty acid transfer and circulating fatty acid levels

V S Peche et al. Nat Commun. .

Abstract

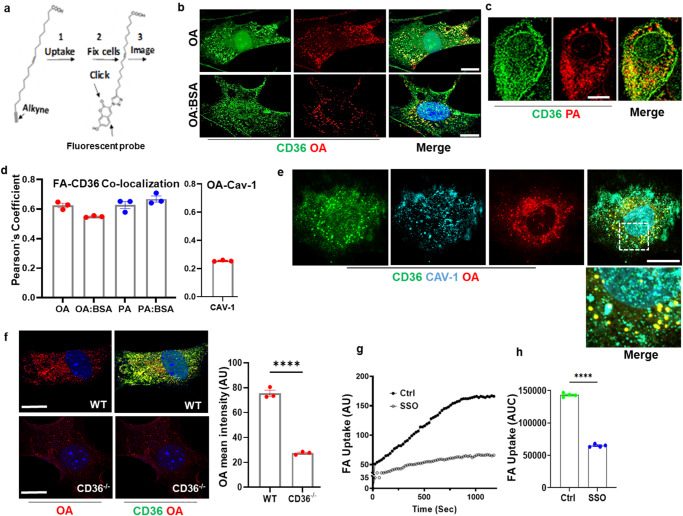
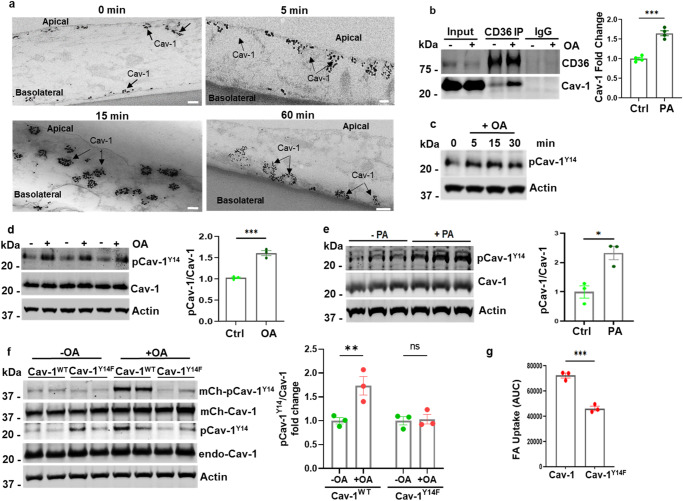
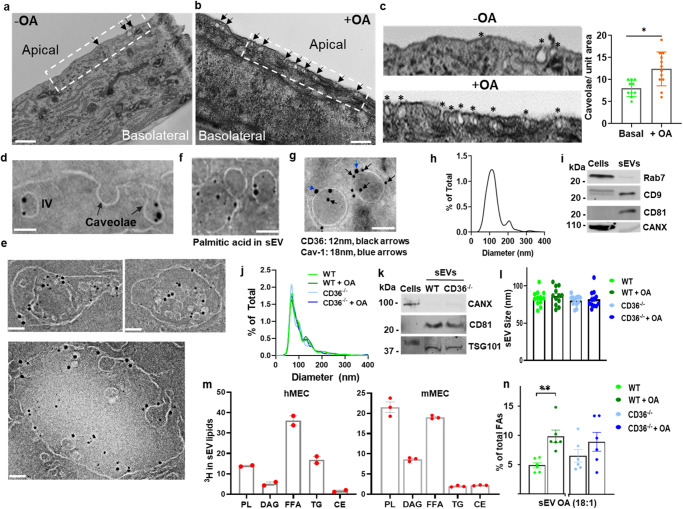
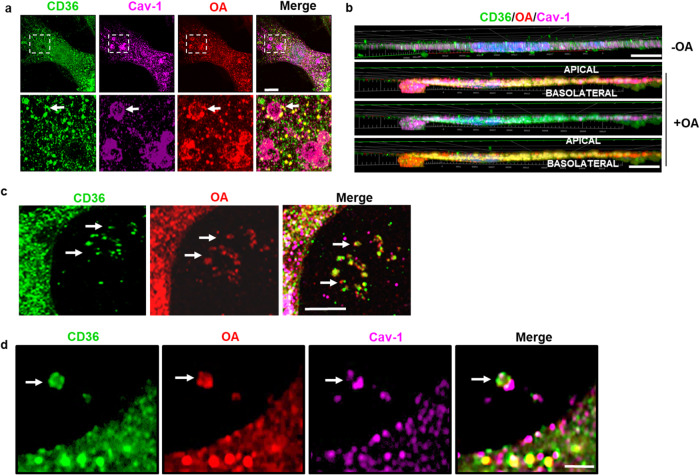
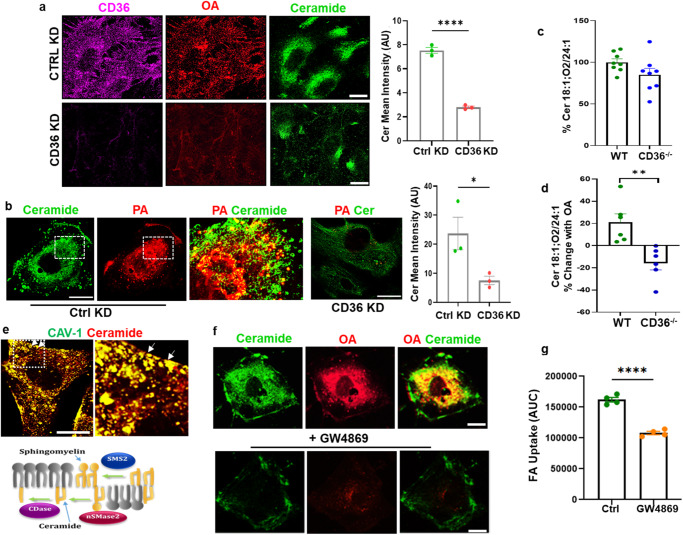
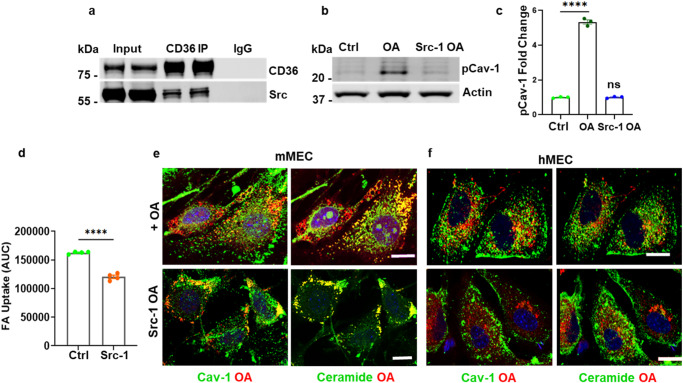
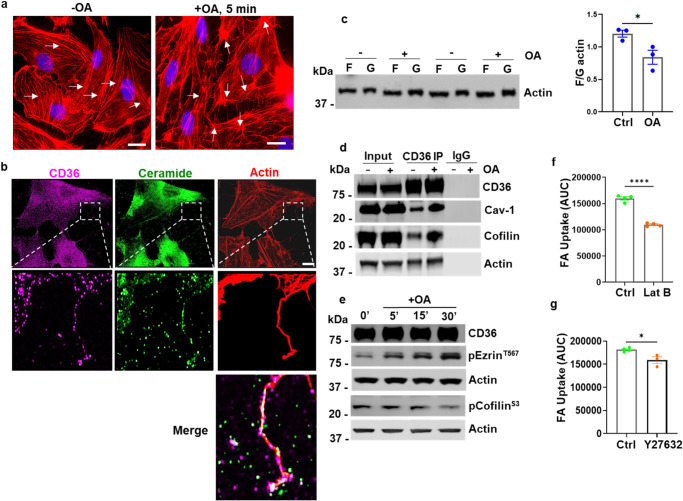
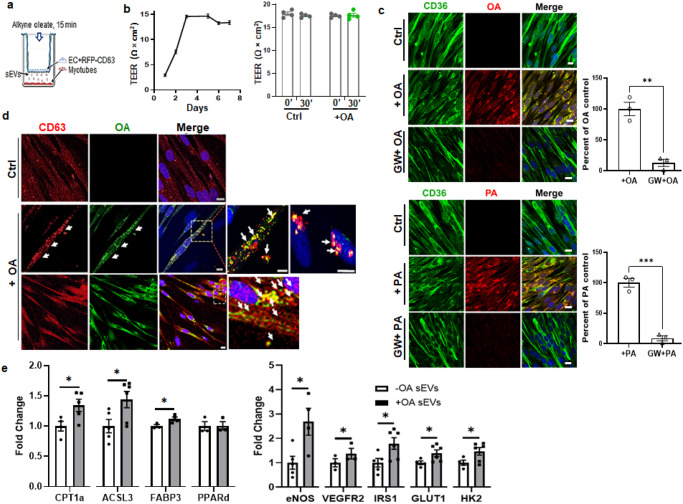
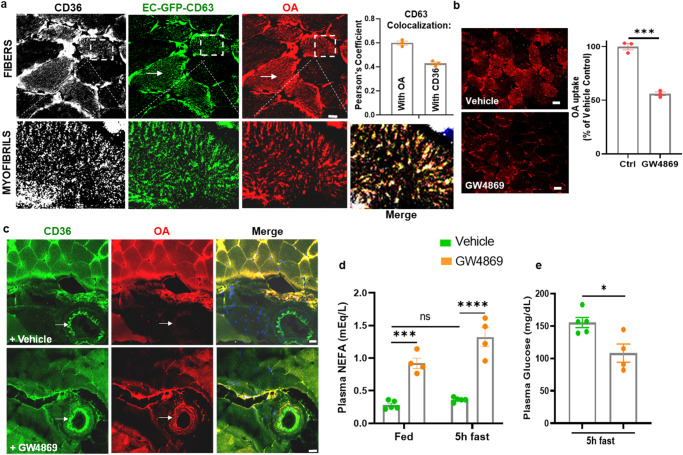
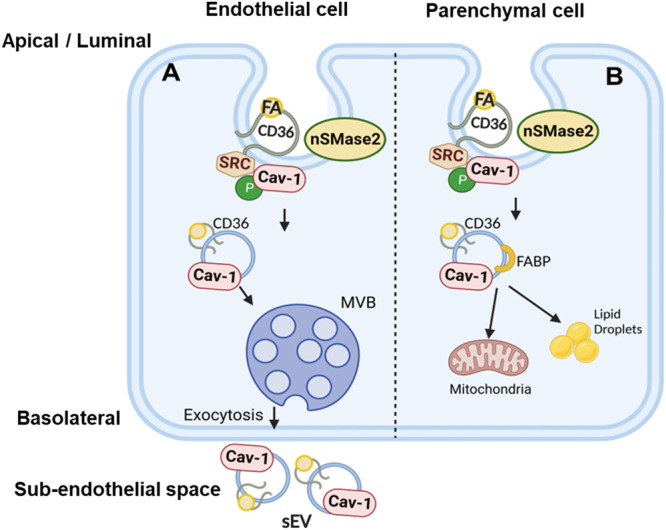
Endothelial cell (EC) CD36 controls tissue fatty acid (FA) uptake. Here we examine how ECs transfer FAs. FA interaction with apical membrane CD36 induces Src phosphorylation of caveolin-1 tyrosine-14 (Cav-1Y14) and ceramide generation in caveolae. Ensuing fission of caveolae yields vesicles containing FAs, CD36 and ceramide that are secreted basolaterally as small (80-100 nm) exosome-like extracellular vesicles (sEVs). We visualize in transwells EC transfer of FAs in sEVs to underlying myotubes. In mice with EC-expression of the exosome marker emeraldGFP-CD63, muscle fibers accumulate circulating FAs in emGFP-labeled puncta. The FA-sEV pathway is mapped through its suppression by CD36 depletion, blocking actin-remodeling, Src inhibition, Cav-1Y14 mutation, and neutral sphingomyelinase 2 inhibition. Suppression of sEV formation in mice reduces muscle FA uptake, raises circulating FAs, which remain in blood vessels, and lowers glucose, mimicking prominent Cd36-/- mice phenotypes. The findings show that FA uptake influences membrane ceramide, endocytosis, and EC communication with parenchymal cells.


Conflict of interest statement

The authors declare no competing interests.

Figures

Fig. 1
Fig. 1. Visualization of oleic acid (OA) and palmitic acid (PA) uptake by microvascular endothelial cells (MECs).
a Workflow for FA visualization using alkyne FA: Cells were treated with alkyne FAs for the indicated times then fixed and the FAs conjugated to azide coupled with Alexa Fluor via copper-catalyzed click chemistry. b, c FA internalization in complex with CD36: b Primary human-derived microvascular cells (hMECs) were treated with alkyne oleic acid (OA) (15 µM, 10 min) without BSA, upper panel, or with BSA (0.2%), lower panel. c Cells treated with PA (15 µM, 0.2% BSA, 10 min). Post uptake, cells were click reacted Alexa Fluor 555 (red), co-stained for CD36, and visualized with anti-goat secondary antibody coupled to Alexa Fluor 488 (green). The visible yellow puncta are positive for OA or PA and CD36. Scale bar: 10 µm. d Pearson’s correlation coefficient for FA co-localization with CD36 or Cav-1. Coefficients are high for CD36 and relatively low for Cav-1. n = 3 independent experiments, 15–25 cells counted in each set. p > 0.05 by two-way ANOVA adjusted for multiple comparisons for FA-CD36 co-localization with/without BSA, left panel. Data are means +/− SEM). e Cav-1 is in proximity of intracellular OA/CD36 puncta: mMECs from WT mice were treated 10 min with alkyne OA and co-stained for CD36 and Cav-1. OA (red, Alexa Fluor 555), CD36 (green, Alexa Fluor 488), and Cav-1 (cyan, Alexa Fluor 647). Merge shows Cav-1 (cyan) that associated with CD36-OA yellow puncta, and also unassociated Cav-1. Scale bar: 10 µm. Data are representative of at least three separate experiments. f. FA accumulation is reduced in Cd36−/− ECs: Primary mouse lung MECs (mMECs) from WT and Cd36−/− mice were treated with alkyne OA (15 µM, 10 min). The reduced uptake is quantified in the adjoining graph. n = 3 independent experiments, p < 0.0001 by unpaired t test, 17–20 cells counted per experiment, Data are means +/− SEM. Scale bar: 10 µm. g Real-time FA uptake. Real-time FA uptake in hMECs treated with vehicle (DMSO) or SSO to inhibit CD36, quantified in (h) as area under the curve. n = 4 independent experiments, ****p < 0.0001 by unpaired t test. Data are means +/− SEM.
Fig. 2
Fig. 2. Oleate enhances Caveolin-1 transcytosis and phosphorylation at tyrosine 14.
a hMECs were serum starved for 4 h and treated with OA (OA-albumin: 100 µM–50 µM) at indicated times, followed by fixation and processing for Cav-1 immune electron microscopy. Scale bars: 100 nm. b Serum-starved hMECs (4 h) were treated with OA for 30 min, CD36 was immunoprecipitated (IP) from equal protein lysate and IPs probed for CD36 and Cav-1. Quantification of the increase in CD36/Cav-1 interaction after OA. n = 4 independent experiments, ***p < 0.001 by unpaired t test. Data are means +/− SEM. ce hMEC were treated as in b with OA (c, d) or PA (e) for 30 min except in (c) for the indicated times. Lysates from (d) and (e) were probed for Cav-1, pCav-1Y14, and actin. Graphs quantify ratio of pCav-1Y14/total Cav-1 in the presence or absence of FA. n = 3 independent experiments for OA or PA, ***p < 0.001 for OA, *p < 0.05 for PA by unpaired t test. Data are means +/− SEM. f mCherry-Cav-1Y14F dominant-negative mutant on OA-dependent endogenous Cav-1 phosphorylation. mCherry-Cav-1WT or mutant mCherry-Cav-1Y14F were expressed in hMECs and stimulated with OA. Western blot showing the expressed proteins and their OA-induced phosphorylation at the Y14 residue. Actin was the loading control. Graph quantifies phosphorylation of endogenous Cav-1 (pCav-1Y14/Cav-1) in cells expressing WT or mutated Cav-1. n = 3 independent experiments, Cav-1WT, **p < 0.01; Cav-1Y14F, ns by unpaired t test. Data are means +/− SEM. g Real-time FA uptake. AUC of FA uptake for cells expressing mCherry-Cav-1WT or mCherry-Cav-1Y14F. n = 3 independent experiments, ***p < 0.001 by unpaired t test. Data are means +/− SEM.
Fig. 3
Fig. 3. Fatty acid addition enhances caveolae dynamics and induces secretion of small FA-containing extracellular vesicles (sEVs).
a, b Higher number of caveolae at the apical membrane of OA-treated ECs. Serum-starved (4 h) hMEC were treated (10 min) with OA-BSA (100 µM–50 µM), fixed, and examined by transmission electron microscopy (TEM). Scale bar: 500 nm. c Magnification of A and B and quantification of caveolae per unit area in OA-treated and control cells. *p < 0.05 by unpaired t test, 10–13 cells analyzed per group. Data are means +/− SEM. d, e Nanogold palmitic acid (PA) treatment identifies FA in caveolae and multivesicular bodies, MVBs. d hMECs treated 10 min with 10 µM nanogold PA (1.14 nm), fixed and processed for EM, show nanogold PA in internalized caveolae and in caveolae undergoing internalization. Scale bar: 100 nm. e Nanogold PA identified in the lumen of late endosomes/MVBs. Scale bar: 100 nm. f Exosome-like sEVs from ECs incubated with nanogold PA. Scale bar: 100 nm. g Immuno EM of sEVs for CD36 and Cav-1: sEVs isolated from hMECs treated with OA:BSA, 100 µM:50 µM, were processed for immune-EM; CD36 12 nm and Cav-1 18 nm. h, i Size distribution and biochemical markers of exosome-like sEVs secreted by FA-treated MECs: Cells (hMECs) were treated 1 h with OA:BSA, 100 µM:50 µM, and media collected over 24 h and 48 h pooled. The isolated sEVs were analyzed for size distribution (h) and probed for exosome markers (i) membrane CD9 and CD81, and for exclusion of Rab7, a marker of late endosomes/lysosomes, and CANX an ER marker. Data representative of 3 experiments. jl Characteristics of sEVs secreted by WT and CD36−/− mMECs in absence or presence of OA. j Size distribution, k sEV markers. l sEV average particle size. n = 12 preparations. Data are means +/− SEM. m OA distribution (% of total) in sEV lipids from mMECs and hMECS. Cells were incubated 24 h with 50 µM oleic acid containing [3H]-oleic acid (22,000 cpm/nmol OA) in culture media supplemented with EV-free FBS. PL, phospholipids; DAG, diacylglycerol, FFA, free fatty acids; TG, triacylglycerol, CE, cholesterol esters. n = 2 preparations for hMEC, 3 preparations for mMEC. Data are means +/− SEM. n OA is increased in sEVs isolated from wild-type MECs but not in Cd36−/− MECs. FA content of sEV by LC/MS lipidomics analysis. n = 6 preparations, **p < 0.01 for WT vs WT + OA by one-way ANOVA adjusted for multiple comparisons. Data are means +/− SEM.
Fig. 4
Fig. 4. Imaging of endothelial cell basolateral membrane after OA treatment.
a MVB-like structures at the basolateral EC side, positive for OA, CD36, and Cav-1. hMEC grown to confluence on filters were treated with alkyne OA (15 µM, 10 min). Confocal microscopy identified rosette-like vesicular clusters positive for OA (Alexa 555, red), CD36 (Alexa 488, green), and Cav-1 (Alexa 647, magenta). Scale bar: 10 µm. b MVB budding from the EC basolateral side. Three-dimensional rendering of confocal stacks of hMEC images with XZ projections show MVB budding from the membrane at the basolateral side of an OA-treated EC. Scale bar: 10 µm. c, d Confocal microscopy of sEVs, positive for CD36 (green), OA (red), and Cav-1 (magenta). Scale bars: 1 µm for (c), 500 nm for (d). Data representative of at least 3 independent experiments.
Fig. 5
Fig. 5. Fatty acids induce ceramide generation in caveolae.
ad Ceramide generation mediates FA-induced caveolae endocytosis. a hMECs, treated with either control siRNA or CD36-specific siRNA, were serum-starved (4 h) and supplemented with alkyne OA (15 µM, 10 min). After the click reaction, cells were immunostained for CD36 and ceramide using secondary antibodies conjugated to Alexa Fluor 647 and 488, respectively. Lower panel, CD36 knockdown (KD) suppresses OA uptake and ceramide formation in hMECs. Adjoining graph, Ceramide mean intensity in control and CD36KD cells. n = 3 independent preparations, number of cells counted per preparation: 15–25, ****p < 0.0001 by unpaired t test. Data are means +/− SEM. Scale bars: 10 µm. b Alkyne PA treated control or CD36KD hMECs, were immunostained for ceramide. Co-localization of alkyne PA with ceramides is shown. Adjacent graph shows ceramide mean intensity in control and CD36KD cells. n = 3 independent experiments, *p < 0.05 by unpaired t test number of cells counted/experiment 10–25. Data are means +/− SEM. Scale bars: 10 µm. c, d High-performance LC/MS lipidomics analysis on sEVs isolated from mMEC treated with 200 µM OA. c Ceramide Cer 18:1;O2/24:1 content in sEVs from WT and CD36−/− cells was similar. d Ceramide Cer 18:1;O2/24:1 content increased with oleic acid treatment in sEVs from CD36+/+ cells and decreased in sEV from CD36−/−cells, n = 6 independent preparations, **p < 0.01 by unpaired t test. Data are mean values +/− SEM. e Ceramide generation in caveolae. Co-localization of ceramide and Cav-1 in OA-treated hMECs: Cav-1 and ceramide are shown to colocalize in plasma membrane caveolae (arrows) and in intracellular vesicles. Scale bar 10 µm. Lower panel in (e) shows a cartoon summary of plasma membrane sphingomyelin-ceramide turnover: Neutral sphingomyelinase 2 (nSMase2) localizes to the inner leaflet of caveolae and upon activation generates ceramide, which can be hydrolyzed by ceramidase to sphingosine. Scale bar: 10 µm. f The nSMase2 inhibitor GW4869 reduces ceramide formation and OA uptake: hMECs were pre-incubated 10 min with vehicle (DMSO) or GW4869 (10 µM) before adding alkyne OA (15 µM, 10 min). Scale bars: 10 µm. g Ceramide formation is critical for FA uptake. Real-time FA uptake (AUC) in hMECs treated with either vehicle or GW4869. n = 4 independent experiments, ****p < 0.0001 by unpaired t test. Data are means +/− SEM.
Fig. 6
Fig. 6. Src Kinase is critical for FA internalization.
a CD36 interacts with Src in hMECs. CD36 IP shows association of CD36 and Src. b Src is critical for OA-induced Cav-1Y14 phosphorylation. hMECs were pretreated with Src inhibitor-1 prior to OA addition and lysates were probed for p-Cav-1Y14. c Quantification of (b), n = 3 independent experiments, ****p < 0.0001 by one-way ANOVA adjusted for multiple comparison, Data are means +/− SEM. d Real-time FA uptake (AUC) by hMEC controls or pretreated with Src inhibitor-1. n = 4 independent experiments, ****p < 0.0001 by unpaired t test. Data are means +/− SEM. e, f Src inhibition sequesters oleic acid and ceramide at the cell membrane of mMECs (e) or hMECs (f). Alkyne OA (15 µM, 10 min) was added to ECs without or with pretreatment with Src inhibitor-1 (10 µM, 2 h) before processing for Cav-1 and ceramide immunostaining. Data representative of 3 experiments. Note: Pseudo colors were used to visualize co-localization between OA, Cav-1, or ceramide. Scale bars: 10 µm.
Fig. 7
Fig. 7. Oleic acid induces rapid actin remodeling in MECs.
a Changes in actin stress fibers in cells exposed to OA: hMECs, were treated with oleic acid (OA:BSA, 100 µM:50 µM) for 5 min, fixed and F-actin visualized with TRITC-Phalloidin. Scale bars: 10 µm. b OA induces cellular actin extensions. hMECs processed as above were immunostained for CD36, ceramide, and F-actin. Lower panel magnification shows cellular extensions containing actin that are decorated with ceramide and CD36-positive sEVs, as shown in the merge. Scale bar: 10 µm. c Reduced F/G actin ratio in OA-treated hMECs: Samples from G- and F-actin fractionation of cells treated as in (a), resolved on SDS-PAGE and immunoblotted for β-actin, quantified in adjoining graph. n = 3 independent experiments, p < 0.05 by unpaired t test. d Enhanced interaction of CD36 with cofilin, actin, and Cav-1 in OA-treated hMECs: Cells were treated with OA:BSA, 100 µM:50 µM, for 30 min. CD36 IP from equal lysate protein (input) were immunoblotted and probed for CD36, Cav-1, cofilin, and actin. e Altered phosphorylation of actin-binding proteins ezrin (T567) and cofilin (S3) after OA addition. f, g Actin remodeling is critical for FA uptake. FA uptake (AUC) in cells treated with actin disrupting Latrunculin B (f) versus the ROCK1/2 inhibitor (Y27632) (g). n = 4 experiments for (f), ****p < 0.0001 by unpaired t test. n = 3–4 independent experiments for (g), *p < 0.05 by unpaired t test. All data are means +/− SEM.
Fig. 8
Fig. 8. Endothelial cells transfer FA to myotubes via sEVs.
a Cartoon depicting the transwell setup. ECs were grown on filters to a confluent monolayer in the upper chamber while myotubes were grown in the lower chamber. Akyne FA was added to the upper chamber. FA transfer to myotubes was visualized by fixing the cells and performing Click chemistry. b Barrier integrity of hMECs grown on transwells until 3 days post confluence. Barrier integrity was assessed using TEER measurement. The TEER plateau indicates that the barrier is fully formed (left panel, n = 3 experiments). The TEER plateau was unaffected by OA addition, right panel. n = 4 independent experiments, p > 0.05 by unpaired t test. Data are means +/− SEM. c hMEC transfer OA and PA to myotubes through sEVs. Human myoblasts were grown on coverslips and differentiated into myotubes. The hMECs were grown on filters in transwells until 3–4 days post confluence. The myotubes on coverslips were placed in the bottom wells of the transwells. c Alkyne OA (upper panels) or PA (lower panels) was added (25 µM, 30 min) in presence or absence of the nSMase2 inhibitor GW4869 (GW, 10 µM, 10 min). Myotubes were clicked and processed for CD36 immunostaining and confocal microscopy. The percent GW4869 inhibition of OA and PA flux to myotubes is shown in adjacent graphs. n = 3 independent experiments, **p < 0.01 for OA, ***p < 0.001 for PA by unpaired t test. Data are means +/− SEM. Scale bar: 10 µm. d Alkyne OA transfers with the exosome marker CD63 when hMECs express RFP-CD63 (red). Alkyne OA was added to the hMECs and 30 min later myotubes were processed to visualize OA and CD63. Top control panel: Myotubes under control hMEC (no OA added) showed low diffuse red CD63 signal. Panels + OA: Myotubes cultured below OA-treated hMECs showed bright intracellular red CD63 puncta that were also positive for OA (green azide Alexa Fluor-488). Note green OA signal was used to distinguish it from the red RFP-CD63 In the middle +OA panel, arrows point to puncta positive for CD63 and OA. Inset: Myotubes at higher magnification showing OA/CD63 vesicles inside and outside the cell (arrows) and an additional higher magnification highlights OA/CD63 vesicles with perinuclear localization. Bottom panel shows an experiment similar to that in the middle panel to further illustrate the yellow merge of hMEC-transferred OA (green) with CD63 (red) inside myotubes. Scale bars: 10 µm. e hMEC FA-sEVs alter gene expression in myotubes. qPCR analysis of myotubes treated 2 h with sEVs from ECs with and without OA treatment. CPT1a: carnitine palmitoyl transferase a, ACSL3: Acyl-CoA synthase long chain 3, FABP3: FA binding protein 3, PPARδ: Peroxisome proliferator activating receptor delta, eNOS: endothelial nitric oxide synthase, VEGFR2: Vascular endothelial growth factor receptor 2, IRS1: Insulin receptor substrate 1, Glut1: Glucose transporter 1, HK2: hexokinase 2. n = 3–6 independent preparations, *p < 0.05 by unpaired t test. Data are means +/− SEM.
Fig. 9
Fig. 9. EC secreted sEVs transfer FAs to muscle in vivo.
a Visualization of OA uptake in reporter mice with EC-expression of emGFP-CD63. Mice were given alkyne OA (25 µM) retro-orbitally, euthanized 30 min later, and skeletal muscle fixed, clicked, and immunostained for CD36. Top panel shows cross sections of muscle fibers with arrows pointing to myofibrils inside the fibers. Higher magnification insets in the bottom panel show association of CD36/OA/CD63 staining with the myofibrils inside fibers. Adjoining graph shows Pearson’s co-localization coefficient for CD63/OA and CD36/CD63 (n = 3 animals, 8–10 individual muscle fibers/animal). b OA uptake by muscle fibers is suppressed by GW4869. Mice were injected with vehicle (DMSO) or GW4869 (2.5 µg/g intraperitoneally for 4 days) then given alkyne OA (25uM) retro-orbitally. GW4869 reduced OA uptake by muscle fibers as quantified in adjoining graph. n = 3 mice per group for vehicle and GW4869 treatment, 10–15 individual muscle fibers/mouse ***p < 0.001, unpaired t test. Data are means +/− SEM. Scale bar, 10 µm. c GW4869 induced reduction in OA uptake by muscle fibers associates with trapping of the OA in blood vessels. Skeletal muscle from a vehicle-treated mouse (upper panel) shows strong OA uptake into fibers and OA absence from a nearby CD36-expressing vessel (arrows). Muscle from a GW4869-treated mouse (lower panel) showed reduced uptake into fibers, and OA retention in a nearby CD36-expressing vessel (arrows) can be seen. Scale bar 20 µm. d GW4869 increases blood levels of non-esterified FAs (NEFAs). Mice were treated with GW4869 or vehicle, as in (c) at end of the dark period (fed) or after a 5 h fast. NEFAs were measured in tail vein blood. n = 4–5 mice/group, ****p < 0.0001, ***p = 0.0002 by two-way ANOVA adjusted for multiple comparisons. Data are means +/− SEM. e GW4869 reduces blood glucose. Mice (vehicle or GW4869 treated) were fasted for 5 h and blood glucose measured in tail vein blood. *p < 0.05 by unpaired t test, data representative of two cohorts n = 4–5 mice per/group. Data are means +/− SEM. Note: Blood glucose in C57bl6 mice (fed or fasted) are normally higher as compared to levels in other commonly used strains, .
Fig. 10
Fig. 10. Schematic of the EC FA export pathway.
A The polarized ECs control tissue FA uptake by transcytosis of circulating FAs and their export in small extracellular vesicles (sEVs) to parenchymal cells. FA binding to CD36 recruits Src to phosphorylate Cav-1 at tyrosine14, which disrupts the caveolae coat. Associated activation of nSMase2 generates the destabilizing ceramides in the caveolae. Both events initiate caveolae fission from the membrane. The caveolae internalize into small ceramide-rich intracellular vesicles (IVs) that are then sorted into the lumen of multivesicular bodies (MVBs). The MVBs fuse with the basolateral membrane to release exosome-like small sEVs in the sub-endothelial space. The sEVs export FA and other cargo to parenchymal cells. B Possible alternate fate of endocytosed vesicles in parenchymal cells. The IVs generated in response to FA are likely to be heterogenous and a subset possibly less enriched in specific ceramides might during traffic or sorting associate with proteins such as FABPs that help target the IVs to cellular organelles instead of for secretion as sEVs. This latter fate might predominate in myocytes, cardiomyocytes, and adipocytes where most FAs are kept for local use or storage.

Similar articles

Cited by

References

    1. Ghosh-Choudhary S, Liu J, Finkel T. Metabolic regulation of cell fate and function. Trends Cell Biol. 2020;30:201–212. doi: 10.1016/j.tcb.2019.12.005. - DOI - PMC - PubMed
    1. Hubert M, et al. Lipid accumulation controls the balance between surface connection and scission of caveolae. Elife. 2020;9:e55038. doi: 10.7554/eLife.55038. - DOI - PMC - PubMed
    1. Jacome-Sosa M, et al. CD36 maintains the gastric mucosa and associates with gastric disease. Commun. Biol. 2021;4:1247. doi: 10.1038/s42003-021-02765-z. - DOI - PMC - PubMed
    1. Stern JH, Rutkowski JM, Scherer PE. Adiponectin, leptin, and fatty acids in the maintenance of metabolic homeostasis through adipose tissue crosstalk. Cell Metab. 2016;23:770–784. doi: 10.1016/j.cmet.2016.04.011. - DOI - PMC - PubMed
    1. Goodpaster BH, Sparks LM. Metabolic flexibility in health and disease. Cell Metab. 2017;25:1027–1036. doi: 10.1016/j.cmet.2017.04.015. - DOI - PMC - PubMed

Publication types