

Opportunistic detection of type 2 diabetes using deep learning from frontal chest radiographs
- PMID: 37419921
- PMCID: PMC10328953
- DOI: 10.1038/s41467-023-39631-x
Opportunistic detection of type 2 diabetes using deep learning from frontal chest radiographs
Erratum in
-
Author Correction: Opportunistic detection of type 2 diabetes using deep learning from frontal chest radiographs.Nat Commun. 2024 Jun 6;15(1):4817. doi: 10.1038/s41467-024-49184-2. Nat Commun. 2024. PMID: 38844459 Free PMC article. No abstract available.
Abstract
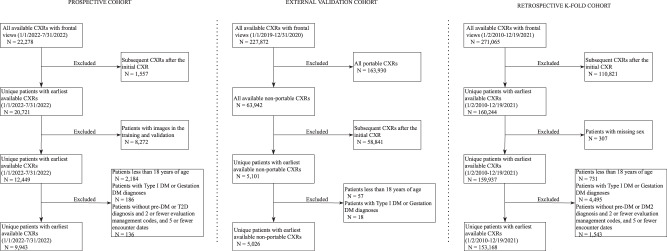
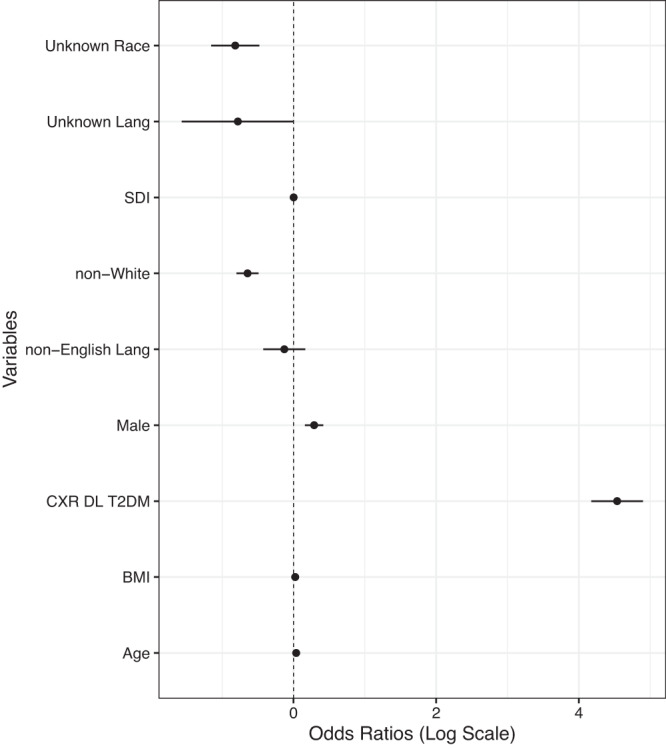
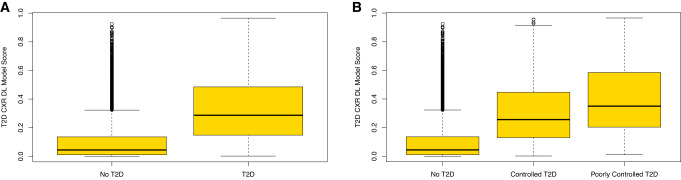
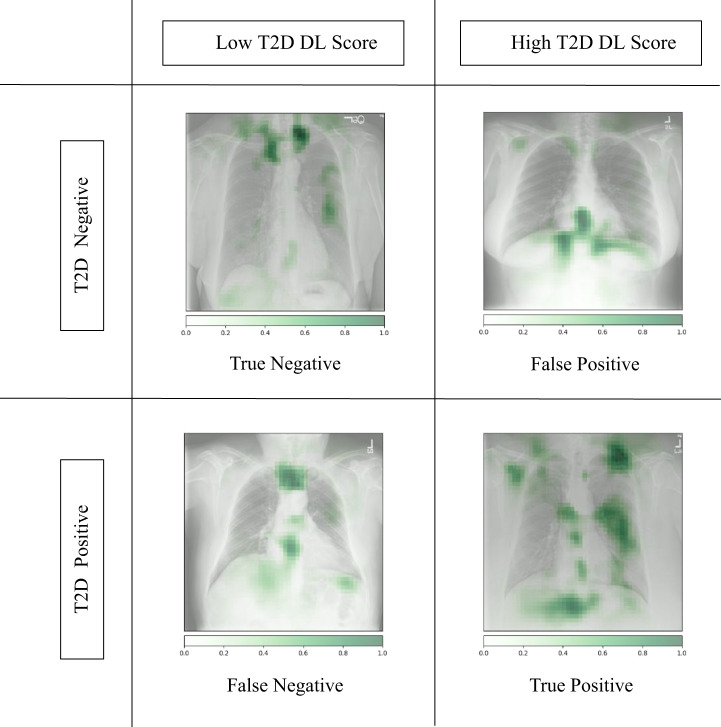
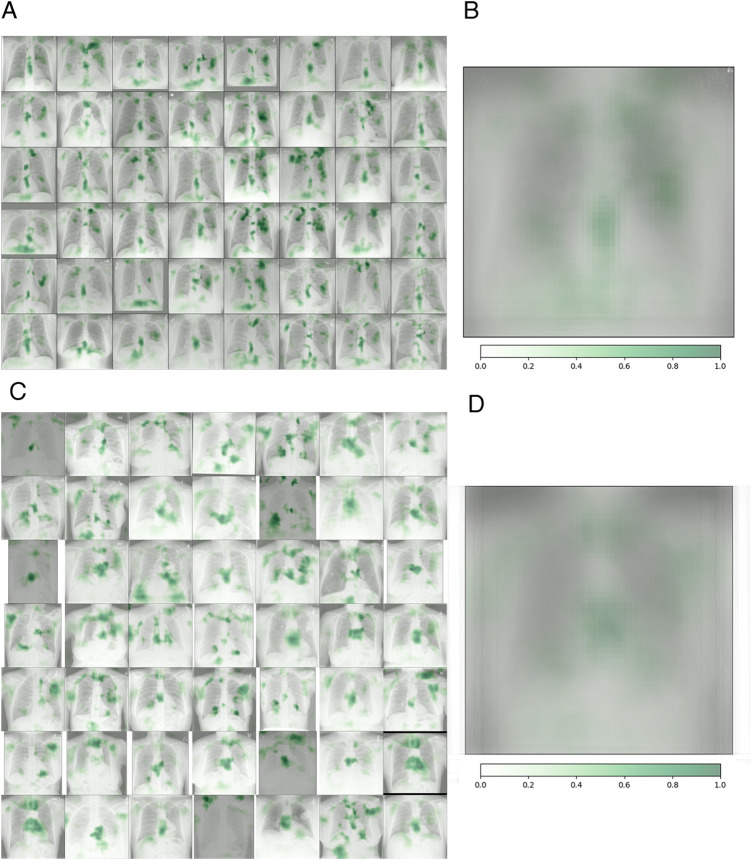
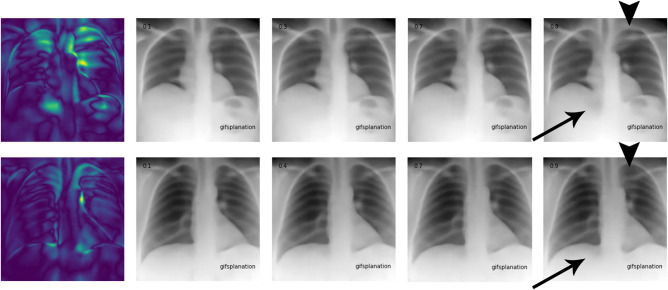
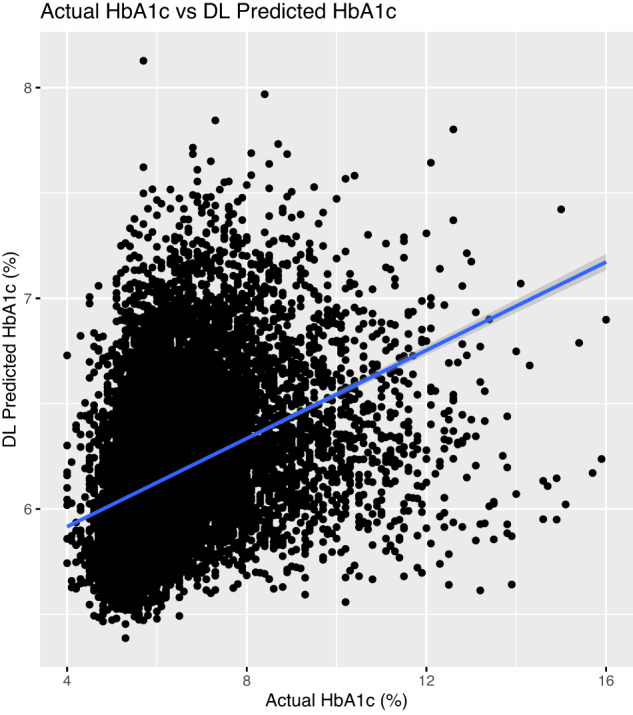
Deep learning (DL) models can harness electronic health records (EHRs) to predict diseases and extract radiologic findings for diagnosis. With ambulatory chest radiographs (CXRs) frequently ordered, we investigated detecting type 2 diabetes (T2D) by combining radiographic and EHR data using a DL model. Our model, developed from 271,065 CXRs and 160,244 patients, was tested on a prospective dataset of 9,943 CXRs. Here we show the model effectively detected T2D with a ROC AUC of 0.84 and a 16% prevalence. The algorithm flagged 1,381 cases (14%) as suspicious for T2D. External validation at a distinct institution yielded a ROC AUC of 0.77, with 5% of patients subsequently diagnosed with T2D. Explainable AI techniques revealed correlations between specific adiposity measures and high predictivity, suggesting CXRs' potential for enhanced T2D screening.
© 2023. The Author(s).
Conflict of interest statement
A.P., S.K., N.S. are co-inventors of the patent “comorbidity prediction from radiology images,” which protects the potential uses of comorbidity prediction from radiographs in value-based healthcare (applicants: DuPage Medical Group, University of Illinois, inventors: Oluwasanmi Koyejo, Andrew Chen, Patrick Cole, Nasir Siddiqui, Ayis Pyrros, U.S. Patent Application No. 17/861,347). A.P. is an advisor to Brainnet and Inference Analytics. M.P.L. is employed by Microsoft. N.K. is employed by BunkerHill Health. R.M. is an operating advisor at Ares Private Equity and CEO of Brainnet. P.P. is an advisor to Nanox-X, Bracco, and GE Healthcare. The remaining authors declare no competing interests.
Figures
Similar articles
-
A deep learning-based algorithm for pulmonary tuberculosis detection in chest radiography.Sci Rep. 2024 Jun 28;14(1):14917. doi: 10.1038/s41598-024-65703-z. Sci Rep. 2024. PMID: 38942819 Free PMC article.
-
Multimodal deep learning for predicting in-hospital mortality in heart failure patients using longitudinal chest X-rays and electronic health records.Int J Cardiovasc Imaging. 2025 Mar;41(3):427-440. doi: 10.1007/s10554-025-03322-z. Epub 2025 Jan 9. Int J Cardiovasc Imaging. 2025. PMID: 39786626
-
Deep Learning Method for Automated Classification of Anteroposterior and Posteroanterior Chest Radiographs.J Digit Imaging. 2019 Dec;32(6):925-930. doi: 10.1007/s10278-019-00208-0. J Digit Imaging. 2019. PMID: 30972585 Free PMC article.
-
Detecting Racial/Ethnic Health Disparities Using Deep Learning From Frontal Chest Radiography.J Am Coll Radiol. 2022 Jan;19(1 Pt B):184-191. doi: 10.1016/j.jacr.2021.09.010. J Am Coll Radiol. 2022. PMID: 35033309 Free PMC article.
-
A review on lung boundary detection in chest X-rays.Int J Comput Assist Radiol Surg. 2019 Apr;14(4):563-576. doi: 10.1007/s11548-019-01917-1. Epub 2019 Feb 7. Int J Comput Assist Radiol Surg. 2019. PMID: 30730032 Free PMC article. Review.
Cited by
-
Review: Machine learning in precision pharmacotherapy of type 2 diabetes-A promising future or a glimpse of hope?Digit Health. 2023 Sep 29;9:20552076231203879. doi: 10.1177/20552076231203879. eCollection 2023 Jan-Dec. Digit Health. 2023. PMID: 37786401 Free PMC article. Review.
-
Correlation of HbA1c levels with CT-based body composition biomarkers in diabetes mellitus and metabolic syndrome.Sci Rep. 2024 Sep 19;14(1):21875. doi: 10.1038/s41598-024-72702-7. Sci Rep. 2024. PMID: 39300115 Free PMC article.
-
Identifying sex from pharyngeal images using deep learning algorithm.Sci Rep. 2024 Aug 2;14(1):17954. doi: 10.1038/s41598-024-68817-6. Sci Rep. 2024. PMID: 39095416 Free PMC article.
-
Digital Health in Diabetes and Cardiovascular Disease.Endocr Res. 2024 Feb-May;49(3):124-136. doi: 10.1080/07435800.2024.2341146. Epub 2024 Apr 11. Endocr Res. 2024. PMID: 38605594 Free PMC article. Review.
-
Diabetes and artificial intelligence beyond the closed loop: a review of the landscape, promise and challenges.Diabetologia. 2024 Feb;67(2):223-235. doi: 10.1007/s00125-023-06038-8. Epub 2023 Nov 18. Diabetologia. 2024. PMID: 37979006 Free PMC article. Review.
References
Publication types
MeSH terms
Grants and funding
LinkOut - more resources
Full Text Sources
Medical
