. 2023 Jul 7;14(1):4023.
doi: 10.1038/s41467-023-38930-7.

Optimal strategies for learning multi-ancestry polygenic scores vary across traits

Affiliations

Optimal strategies for learning multi-ancestry polygenic scores vary across traits

Brieuc Lehmann et al. Nat Commun. .

Abstract

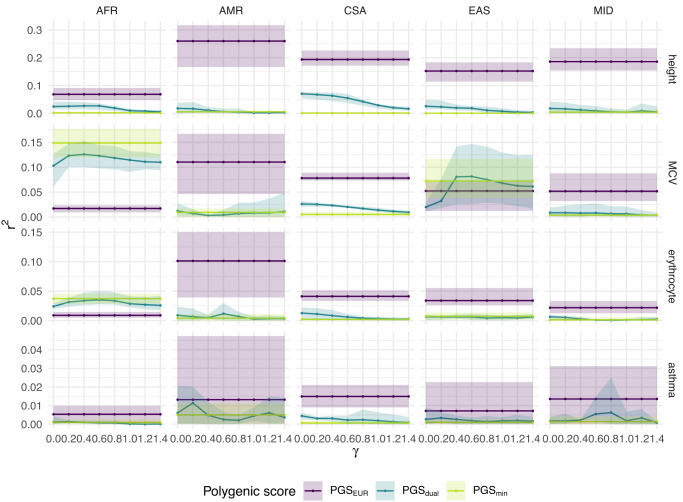
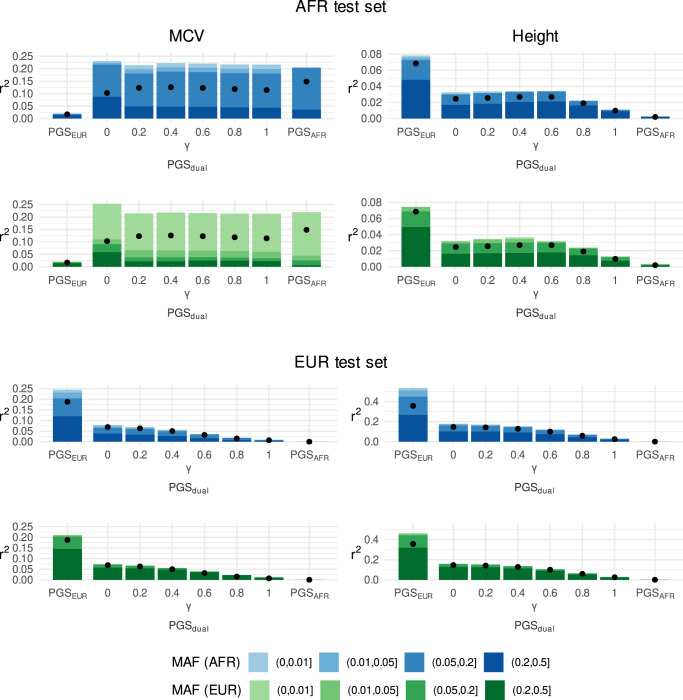
Polygenic scores (PGSs) are individual-level measures that aggregate the genome-wide genetic predisposition to a given trait. As PGS have predominantly been developed using European-ancestry samples, trait prediction using such European ancestry-derived PGS is less accurate in non-European ancestry individuals. Although there has been recent progress in combining multiple PGS trained on distinct populations, the problem of how to maximize performance given a multiple-ancestry cohort is largely unexplored. Here, we investigate the effect of sample size and ancestry composition on PGS performance for fifteen traits in UK Biobank. For some traits, PGS estimated using a relatively small African-ancestry training set outperformed, on an African-ancestry test set, PGS estimated using a much larger European-ancestry only training set. We observe similar, but not identical, results when considering other minority-ancestry groups within UK Biobank. Our results emphasise the importance of targeted data collection from underrepresented groups in order to address existing disparities in PGS performance.


Conflict of interest statement

G.M. is a director of and shareholder in Genomics PLC, and is a partner in Peptide Groove LLP. M.M. is a Programme Lead for the Diverse Data initiative at Genomics England Ltd. B.L. and C.H. declare no competing interests.

Figures

Fig. 1
Fig. 1. Overview of methods.
A To evaluate the different PGSs, we performed various splits of the available data. Firstly, we held out test sets of 20% of individuals in each ancestry group. From the remaining 80%, we constructed three types of training sets: a single-ancestry set consisting only of European-ancestry individuals (purple block), a single-ancestry set consisting of non-European-ancestry individuals (yellow block), and a dual-ancestry set consisting of both European-ancestry and non-European-ancestry individuals (blue block). For each training set, we used another 20% of the data to select the regularisation parameter in the LASSO. B For the dual-ancestry training set, we used an importance weighted LASSO, assigning higher weights to individuals in the minority-ancestry group. See Methods for full details.
Fig. 2
Fig. 2. Simulation study: predictive gap against number of African-ancestry individuals in training set.
Each panel corresponds to a different number of African-ancestry training set individuals from nAFR = 2000 to nAFR = 18,000. The training sets for PGSdual (blue lines) consisted of the corresponding African-ancestry training set for PGSAFR (yellow lines), along with nEUR = 18,000 European-ancestry individuals. Each line represents the mean predictive gap across 50 repetitions. The horizontal dashed lines correspond to the predictive gap for European-ancestry (EUR) test sets based on an unweighted LASSO, while the solid lines correspond to the predictive gap for African-ancestry (AFR) test sets. The parameter γ corresponds to the degree of reweighting used in the reweighted LASSO for PGSdual. The correlation of genetic effects between ancestries ρ was varied from 0.5 (lighter lines) to 1 (darker lines).
Fig. 3
Fig. 3. Predictive performance for African-ancestry individuals against sample size for 15 traits in UK Biobank.
a We fixed the number of European-ancestry (EUR) individuals in the training set at ~50,000 (26,388 for female genital prolapse (FGP)) and varied the number of African-ancestry (AFR) individuals from 0 to ~4700 (2900). The predictive performance, evaluated in terms of partial r2, on African-ancestry individuals increased markedly for mean corpuscular volume (MCV) and platelet crit; and stayed largely stable (or increased slightly) for the remainder. b Here, we instead fixed the number of African-ancestry individuals in the training set at ~4700 (2900 for FGP) for each trait and varied the number of European-ancestry individuals so that the proportion of European-ancestry individuals in the training set ranged from 0% to 90%. The effect on performance on African-ancestry individuals again varied by trait, showing a clear improvement for MPV and height, and a moderate decrease for MCV. Error bars correspond to the range across five cross-validation rounds of training set construction and PGS estimation. Phenotype acronyms: mean platelet volume (MPV), mean corpuscular volume (MCV), body mass index (BMI), atrial fibrillation (AFib), diverticular disease of the intestine (DDI), female genital prolapse (FGP).
Fig. 4
Fig. 4. Partial r2 for PGSEUR, PGSdual, and PGSAFR on 15 traits in UK Biobank.
Predictive performance on an African-ancestry (AFR) test set is shown by the solid lines. The dashed lines correspond to predictive performance on a European-ancestry (EUR) test set using PGSEUR. The single-ancestry scores were estimated using a standard, unweighted LASSO. The dual-ancestry scores were constructed using an importance weighted LASSO with various degrees of reweighting γ. Traits are ordered according to partial r2 of PGSEUR on the European-ancestry test set (note the varying y-axes). Error bars correspond to the range across five cross-validation rounds of training set construction and PGS estimation. Phenotype acronyms: mean platelet volume (MPV), mean corpuscular volume (MCV), body mass index (BMI), atrial fibrillation (AFib), diverticular disease of the intestine (DDI), female genital prolapse (FGP).
Fig. 5
Fig. 5. Partial r2 for PGSEUR, PGSdual, and PGSmin on four traits in UK Biobank for five minority-ancestry groups.
The single-ancestry scores were estimated using a standard, unweighted LASSO. The dual-ancestry scores were constructed using an importance weighted LASSO with various degrees of reweighting γ. Error bars correspond to the range across five cross-validation rounds of training set construction and PGS estimation. The four traits considered are height, MCV, asthma, and erythrocyte distribution width. We used inferred genetic ancestry labels from Pan-UKBB, with participants divided into six groups: European ancestry (EUR), African ancestry (AFR), Admixed American ancestry (AMR), Central/South Asian ancestry (CSA), East Asian ancestry (EAS), and Middle Eastern ancestry (MID).
Fig. 6
Fig. 6. Allele frequency composition of variance explained by single- and dual-ancestry PGS.
Results shown for mean corpuscular volume (left) and height (right) in a African-ancestry test set (AFR; top) and a European-ancestry test set (EUR; bottom). The black dots represent partial r2 for all the variants, i.e. the entire polygenic score. Variants were grouped according to their minor allele frequency (MAF) in African-ancestry individuals (blue palette) or in European-ancestry individuals (green palette). Each bar represents the sum of the partial r2 values for each subset of variants in a given polygenic score. Note that the bars are stacked, and the height of the bar is generally higher than corresponding dot due to LD between variants. The parameter γ corresponds to the degree of reweighting used in the reweighted LASSO for PGSdual.

Similar articles

Cited by

References

    1. Chatterjee N, Shi J, García-Closas M. Developing and evaluating polygenic risk prediction models for stratified disease prevention. Nat. Rev. Genet. 2016;17:392–406. doi: 10.1038/nrg.2016.27. - DOI - PMC - PubMed
    1. Torkamani Ali, Wineinger NE, Topol EJ. The personal and clinical utility of polygenic risk scores. Nat. Rev. Genet. 2018;19:581–590. doi: 10.1038/s41576-018-0018-x. - DOI - PubMed
    1. Khera AV, et al. Genome-wide polygenic scores for common diseases identify individuals with risk equivalent to monogenic mutations. Nat. Genet. 2018;50:1219–1224. doi: 10.1038/s41588-018-0183-z. - DOI - PMC - PubMed
    1. Knowles JW, Ashley EA. Cardiovascular disease: The rise of the genetic risk score. PLoS Med. 2018;15:1–7. doi: 10.1371/journal.pmed.1002546. - DOI - PMC - PubMed
    1. Maas P, et al. Breast cancer risk from modifiable and nonmodifiable risk factors among white women in the United States. JAMA Oncol. 2016;2:1295–1302. doi: 10.1001/jamaoncol.2016.1025. - DOI - PMC - PubMed

Publication types