. 2023 Jul 7;13(1):10993.
doi: 10.1038/s41598-023-38011-1.

Ceramide releases exosomes with a specific miRNA signature for cell differentiation

Affiliations

Ceramide releases exosomes with a specific miRNA signature for cell differentiation

Federico Fiorani et al. Sci Rep. .

Abstract

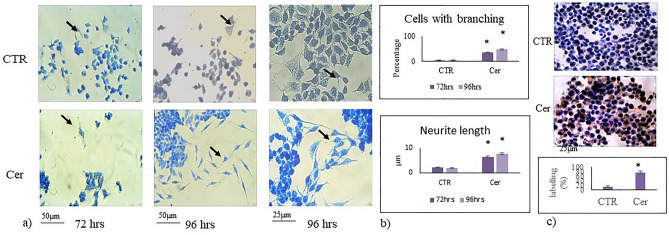
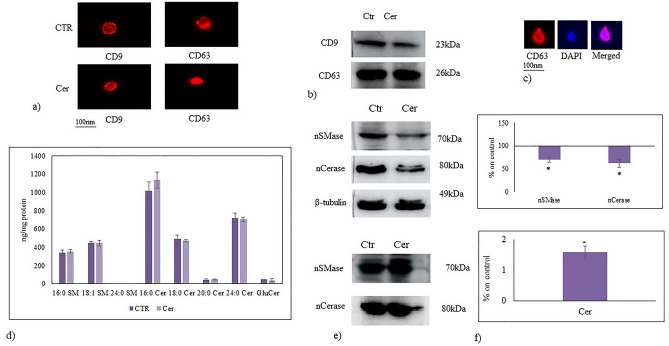
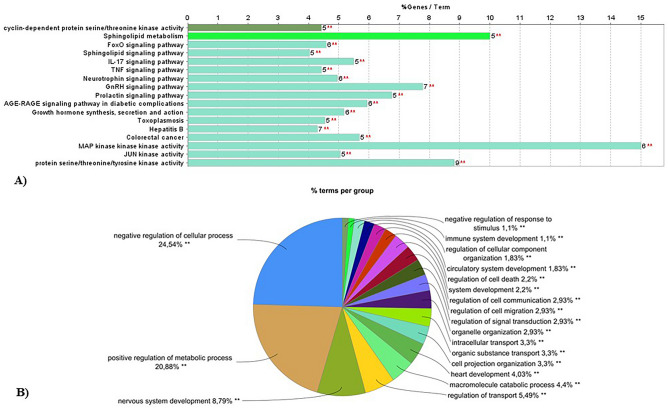
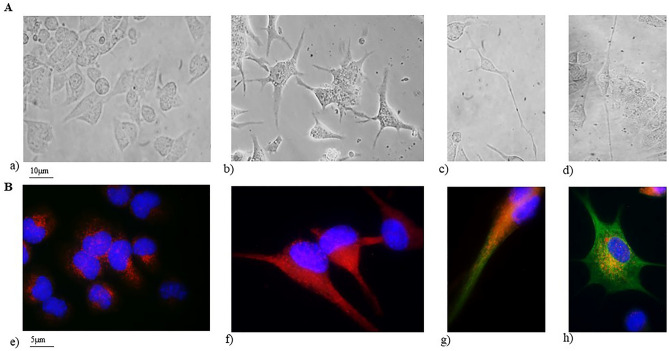
Exosomes are well established effectors of cell-cell communication. Their role on maturation of embryonic cells located in hippocampus, seat of memory, is unknown. Here we show that ceramide facilitates release of exosomes from HN9.10e cells extending information for cell differentiation to neighboring cells. We found only 38 miRNAs differentially expressed in exosomes derived from ceramide-treated cells in comparison with control cells (including 10 up-regulated and 28 down-regulated). Some overexpressed miRNAs (mmu-let-7f-1-3p, mmu-let-7a-1-3p, mmu-let-7b-3p, mmu-let-7b-5p, mmu-miR-330-3p) regulate genes encoding for protein involved in biological, homeostatic, biosynthetic and small molecule metabolic processes, embryo development and cell differentiation, all phenomena relevant for HN9.10e cell differentiation. Notably, the overexpressed mmu-let-7b-5p miRNA appears to be important for our study based on its ability to regulate thirty-five gene targets involved in many processes including sphingolipid metabolism, sphingolipid-related stimulation of cellular functions and neuronal development. Furthermore, we showed that by incubating embryonic cells with exosomes released under ceramide treatment, some cells acquired an astrocytic phenotype and others a neuronal phenotype. We anticipate our study to be a start point for innovative therapeutic strategies to regulate the release of exosomes useful to stimulate delayed brain development in the newborn and to improve the cognitive decline in neurodegenerative disorders.


Conflict of interest statement

The authors declare no competing interests.

Figures

Figure 1
Figure 1
Effect of ceramide on HN9.10e cells. HN9.10e cells were cultured without (CTR) or with 100 nM Ceramide (Cer). (a) morphologic analysis after 72 and 96 h of cell culture. The observations were performed by using inverted microscopy EUROMEX FE 2935 (ED Amhem, Netherlands) equipped with a CMEX 5000 camera system; on the left and in the center 20 × magnification, on the right 40 × magnification. Arrows point to differentiated cells with soma modification and the presence of neurites. (b) The morphometric analysis was performed by using ImageFocus software.c) immunocytochemical analysis of Neurofilament 200 kDa (NF200) expression in HN9.10e cells. The observations were performed as above reported. Above pictures (40 × magnification) and below the percentage of total cells stained in brown (positive cells). Data were expressed as mean ± SD of three independent experiments performed in duplicate. Significance versus the control sample, *p < 0.01.
Figure 2
Figure 2
Characteristics of exosomes released from HN9.10e cells. Exosomes released from control cells (CTR) and ceramide treated cells (Cer). (a) Immunofluorescence of CD9 and CD63 as exosomal markers; (b) Western blotting of CD9 and CD63; (c) immunofluorescence of CD63, in red, counterstained with DAPI (in blue). Images were microscopically evaluated at 100 × magnification with immersion oil (DMRB Leika epi-fluorescent microscope equipped with a digital camera) and magnified with Photoshop programme; (d) UFLC MS/MS analysis of exosomes released under Ceramide treatment. Sphingomyelin (SM), ceramide (Cer) and glucosyl-ceramide (GluCer) species in exosomes released from control cells (CTR) and ceramide treated cells (Cer). Data are expressed as ng lipid/mg protein and represent the mean ± SD of three independent experiments performed in duplicate. Significance versus the control sample *p < 0.01; (e) Neutral sphingomyelinase and neutral ceramidase expression by western blotting: in top panel, cells cultured without (CTR) or with 100 nM Ceramide (Cer), β-tubulin was used as loading control and; in below panel, exosomes released from CTR and Cer cells. CD63 was used as loading control; (f) Quantification of area density by Chemidoc Imagequant LAS500 by specific IQ program, Data were expressed as mean ± SD of three independent experiments performed in duplicate. Significance versus the control sample, *p < 0.01. The values were first normalized with β-tubulin band (nuclei) or CD63 band (exosomes) and then calculated as percentage of CTR sample.
Figure 3
Figure 3
Exosomal miRNA profiling of HN9.10e cells treated with ceramide. Heatmap showing the statistically significant differentially expressed miRNAs in HN9.10e cells treated with ceramide. Globally, thirty-eight transcripts (n = 10 up-regulated, n = 28 down-regulated) were differentially expressed in the exosomes of HN9.10e cells treated with ceramide, compared to controls (abs(logFC) ≥ 0.6, q-value ≤ 0.05). Hierarchical clustering of transcripts and samples using the Euclidean distance and the complete agglomeration method; expression data was vst-transformed, scaled and centered. When not available, the miRBase accession number was replaced by the ENSEMBL GeneID. The heatmap was generated using the DESeq2 R package (v.1.0.12).
Figure 4
Figure 4
Functional enrichment analysis of differentially expressed miRNAs. Heatmaps showing the association of up-regulated miRNAs with: (a) “Gene Ontology-Biological Process” terms (“Categories Union” method) and, (b) with “KEGG Pathways” (“Pathways Union” method),. The significance of each association is described by the color key. Heatmaps were generated using the DIANA-MirPath v.3 web server (last accessed July 22, 2022).
Figure 5
Figure 5
Functional enrichment analysis of mmu-let-7b-5p validated targets. The Cytoscape plugin ClueGO was used to identify the significantly enriched functional terms associated with a subset (n = 35) of in vitro validated targets (A), as well as the whole set of DIANA-TarBase v7.0 defined validated targets (Min Number of Genes n = 100, Min Percentage = 6.0) (B). Functionally enriched terms (Benjamini–Hochberg adjusted p ≤ 0.05) were identified querying the KEGG and the GO_BiologicalProcess databases,. The bar length (A) represents the percentage of genes associated with each enriched term that is found in the examines dataset, while the exact number of genes is indicated on the right of each bar. Pie chart colors (B) match the enriched functional clusters; the most significant terms were used as cluster representatives and identifiers comparison.
Figure 6
Figure 6
Effect of exosomes on HN9.10e cell differentiation. Cells were cultured for 96 h with exosomes released from Ceramide (Cer) treated cells and were analyzed as reported in the “Materials and methods”. (A) cell morphology of: (a) control and, (b–d) exosome treated sample. Observations were performed by using Olympus IX51 Inverted Microscope (40 × magnification) equipped with a digital camera; (B) immunofluorescence of GFAP and tubulin III. Observations were performed by using DMRB Leika epi-fluorescent microscope equipped with a digital camera (100 × magnification). (e) control sample, the image shows low levels of GFAP expression (in red) and absence of βIII-tubulin expression (in green), characteristic of stem cells. The immunolabelling is counterstained with DAPI (in blue); (f) exosome treated sample, the image represents the merged signal of strong GFAP immunolabelling (in red) counterstained with DAPI (in blue), no βIII-tubulin signal (in green) is present, indicating cells differentiated towards the astrocytic phenotype; (g) exosome treated sample, the image shows the strong positive immunolabelling of βIII-tubulin (in green) with still weak stem cell GFAP labeling counterstained with DAPI (in blue). The cells are differentiating towards a unipolar cell neuronal phenotype; (h) as above reported (g) but the cells are differentiating towards a multipolar cell neuronal phenotype.

Similar articles

Cited by

References

    1. Fahy E, et al. A comprehensive classification system for lipids. J. Lipid. Res. 2005;46:839–861. doi: 10.1194/jlr.E400004-JLR200. - DOI - PubMed
    1. Hannun YA, Obeid LM. Many ceramides. J. Biol. Chem. 2011;286:27855–27862. doi: 10.1074/jbc.R111.254359. - DOI - PMC - PubMed
    1. Pal P, Atilla-Gokcumen GE, Frasor J. Emerging roles of ceramides in breast cancer biology and therapy. Int. J. Mol. Sci. 2022;23:11178. doi: 10.3390/ijms231911178. - DOI - PMC - PubMed
    1. Hanada K, et al. Molecular machinery for non-vesicular trafcking of ceramide. Nature. 2003;426:803–809. doi: 10.1038/nature02188. - DOI - PubMed
    1. Sot J, Goni FM, Alonso A. Molecular associations and surface-active properties of short- and long-N-acyl chain ceramides. Biochim. Biophys. Acta. 2005;19:1711–1712. - PubMed