. 2023 Oct;30(10):1330-1345.
doi: 10.1038/s41417-023-00640-z. Epub 2023 Jul 7.

A multi-omics integrative approach unravels novel genes and pathways associated with senescence escape after targeted therapy in NRAS mutant melanoma

Affiliations

A multi-omics integrative approach unravels novel genes and pathways associated with senescence escape after targeted therapy in NRAS mutant melanoma

Vincent Gureghian et al. Cancer Gene Ther. 2023 Oct.

Abstract

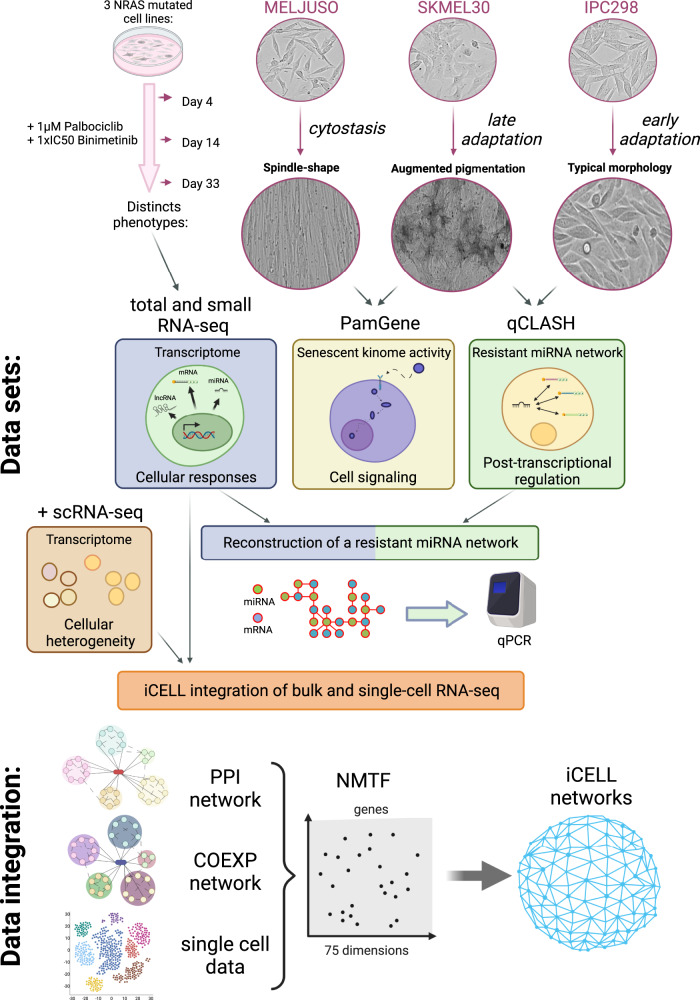
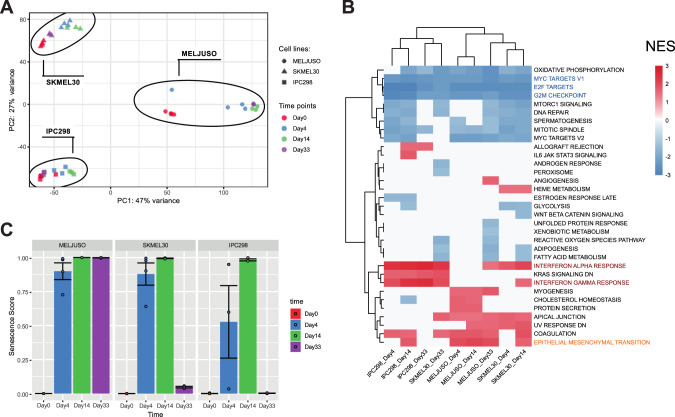
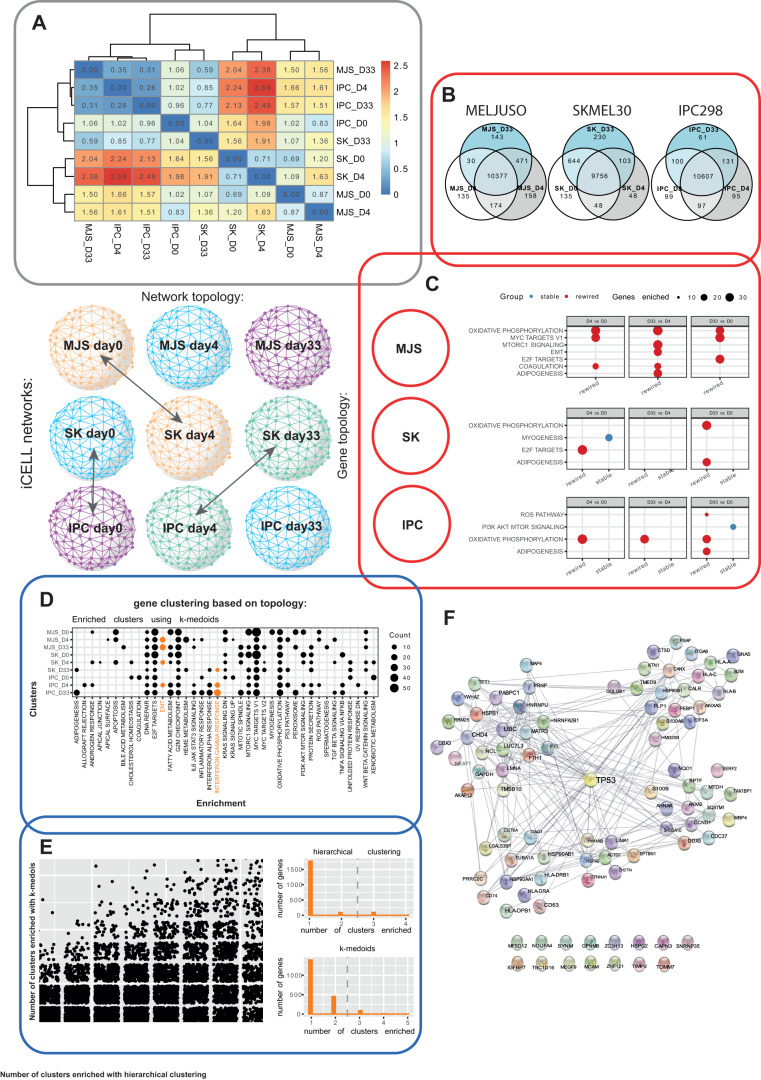
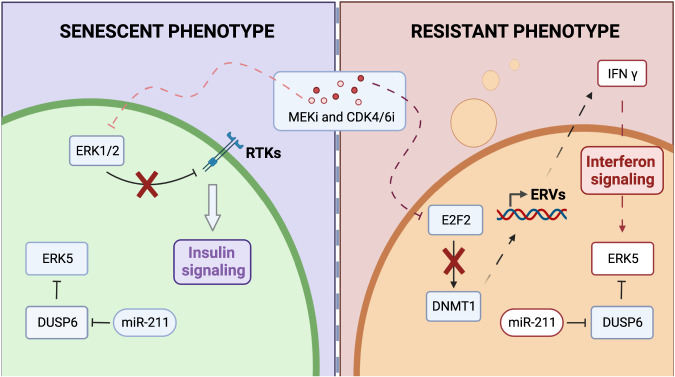
Therapy Induced Senescence (TIS) leads to sustained growth arrest of cancer cells. The associated cytostasis has been shown to be reversible and cells escaping senescence further enhance the aggressiveness of cancers. Chemicals specifically targeting senescent cells, so-called senolytics, constitute a promising avenue for improved cancer treatment in combination with targeted therapies. Understanding how cancer cells evade senescence is needed to optimise the clinical benefits of this therapeutic approach. Here we characterised the response of three different NRAS mutant melanoma cell lines to a combination of CDK4/6 and MEK inhibitors over 33 days. Transcriptomic data show that all cell lines trigger a senescence programme coupled with strong induction of interferons. Kinome profiling revealed the activation of Receptor Tyrosine Kinases (RTKs) and enriched downstream signaling of neurotrophin, ErbB and insulin pathways. Characterisation of the miRNA interactome associates miR-211-5p with resistant phenotypes. Finally, iCell-based integration of bulk and single-cell RNA-seq data identifies biological processes perturbed during senescence and predicts 90 new genes involved in its escape. Overall, our data associate insulin signaling with persistence of a senescent phenotype and suggest a new role for interferon gamma in senescence escape through the induction of EMT and the activation of ERK5 signaling.


Conflict of interest statement

The authors declare no competing interests.

Figures

Fig. 1
Fig. 1. Experimental setup, cellular phenotypes and omics characterization.
IPC298, MELJUSO and SKMEL30 cell lines display different phenotypes upon CDK4/6i and MEKi. We characterised those using RNA-seq, kinome profiling and qCLASH method. RNA-seq and qCLASH data were further combined to construct a resistant miRNA network. Bulk and single-cell RNA-seq were finally integrated into “iCell” networks.
Fig. 2
Fig. 2. NRAS mutant melanoma trigger IFN and EMT responses upon MEKi and CDK4/6i.
A Principal component analysis clusters cell lines separately reflecting distinct observed phenotypes. B Gene Set Enrichment Analysis using the hallmarks gene sets from MSigDB. Color legends represent Normalised Enrichment Score (NES). All cell lines display an enrichment in interferons responses and at day 14 in EMT. C Senescence scores predicted by Cancer SENESCopedia. SENESCopedia webtool (https://ccb.nki.nl/publications/cancer-senescence) uses a gene expression classifier to predict senescence in cancer cell samples [18].
Fig. 3
Fig. 3. MEKi and CDK4/6i lead to RTKs reactivation.
A Summary of significantly deregulated kinases. B Kinase activities after MEKi and CDK4/6i. ERK1/2 inhibition leads to RTKs activation. Rreceptors names are colored according to the enriched pathways. C Phylogenetic tree for SKMEL30 on day 1. The size of the leafs represents the “Median Final Score”, a score greater than 1.2 indicates a significant change between conditions. The color of the branches and leaves shows the “Median Kinase Statistic”, which is the difference in kinase activity. Circles highlight RTKs contributing to enriched pathways. D, E Activity of ERK5 in the senescent and adaptative cell lines. D Zoom on the MAPK pathway showing the deregulation of ERK5 (MAPK7) in MELJUSO cell line. E same for the SKMEL30 cell line.
Fig. 4
Fig. 4. miRNA-mRNA interactions potentially contributing to resistance.
A Summary of the interactions detected through the qCLASH method. B Top part, correlations between hybrid counts (qCLASH) and miRNA/mRNA counts (RNA-seq). Bottom part, summing hybrid counts per mRNA or miRNA (qCLASH) further strengthen the correlations with the RNA-seq. C To select candidates, we considered the interactions detected in three technical replicates (colored circles). Then for the two cell lines, interactions present in the resistant state but absent in the sensitive state were considered. Finally, interactions common to the two cell lines IPC298 and SKMEL30 were used. D RNA-seq data for SKMEL30 cell line as log fold changes overlayed onto the resistant miRNA network. Selected interactions for further validation by qPCR are represented with thick lines and the corresponding mRNAs and miRNAs with bolded borders. E Relative expression of LGALS3BP, TXNIP and TYRP1 mRNAs assessed by qPCR across three NRAS and two BRAF mutant melanoma cell lines. F Relative expression of miR-211-5p across the same cell lines as determined by qPCR. G Expression of miR-211-5p in the small RNA-seq.
Fig. 5
Fig. 5. “iCell” integration of bulk and single-cell RNA-seq.
A Comparison of iCell networks topology using Graphlet Correlation Distances (GCD). iCELL networks recapitulate phenotypic observations and early adaptation of IPC298. B Venn diagrams representing genes overlap between conditions. C Comparison of gene local topology using Graphlet Degree Signature Similarity (GDSS). Within all cell lines, the different time points were compared. ORA was performed on the top 10% most “stable” or “perturbated” genes. D Genes were clustered according to their Graphlets Degree Signatures. ORA was performed to associate gene clusters with biological function. E Left panel: number of enriched clusters detected for each gene across all conditions. Right panel, Number of detected clusters for the EMT and iFN gamma pathways (related to senescence escape) for the two algorithms. F Protein-protein interactions (BioGRID) between P53 and the genes associated with EMT and IFN gamma.
Fig. 6
Fig. 6. Graphical summary.
The phenotypes observed across three different NRAS mutant melanoma cell lines can be summarised as “senescent” (left) and “resistant” (right). Insulin signalling is associated with the “senescent” phenotype and can be explained by the mechanism of action of MEKi, which downregulates ERK1/2, suppressing negative feedback on RTKs. Interferon signaling can be explained by CDK4/6i, which downregulates DNMT1 leading and lead to hypomethylation of the genome and expression of Endogenous Retroviruses (ERVs). Induced expression of intracellular ERVs trigger an innate immune response and production of interferons. IFN γ can activate ERK5, inducing EMT. This phenotype is moreover associated with upregulation of miR-211-5p, which indirectly regulates ERK5.

References

    1. Hayflick L, Moorhead PS. The serial cultivation of human diploid cell strains. Exp Cell Res. 1961;25:585–21. doi: 10.1016/0014-4827(61)90192-6. - DOI - PubMed
    1. Kumari R, Jat P. Mechanisms of cellular senescence: cell cycle arrest and senescence associated secretory phenotype. Front Cell Dev Biol. 2021;9:645593. doi: 10.3389/fcell.2021.645593. - DOI - PMC - PubMed
    1. Ou HL, Hoffmann R, González‐López C, Doherty GJ, Korkola JE, Muñoz‐Espín D. Cellular senescence in cancer: From mechanisms to detection. Mol Oncol. 2021;15:2634–71. doi: 10.1002/1878-0261.12807. - DOI - PMC - PubMed
    1. Liao C, Xiao Y, Liu L. The dynamic process and its dual effects on tumors of therapy-induced senescence. Cancer Manag Res. 2020;12:13553. doi: 10.2147/CMAR.S285083. - DOI - PMC - PubMed
    1. Wang L, Lankhorst L, Bernards R. Exploiting senescence for the treatment of cancer. Nature Rev Cancer. 2022;22:340–55. doi: 10.1038/s41568-022-00450-9. - DOI - PubMed

Publication types

MeSH terms