

Genetic associations vary across the spectrum of fasting serum insulin: results from the European IDEFICS/I.Family children's cohort
- PMID: 37420130
- PMCID: PMC10473990
- DOI: 10.1007/s00125-023-05957-w
Genetic associations vary across the spectrum of fasting serum insulin: results from the European IDEFICS/I.Family children's cohort
Abstract
Aims/hypothesis: There is increasing evidence for the existence of shared genetic predictors of metabolic traits and neurodegenerative disease. We previously observed a U-shaped association between fasting insulin in middle-aged women and dementia up to 34 years later. In the present study, we performed genome-wide association (GWA) analyses for fasting serum insulin in European children with a focus on variants associated with the tails of the insulin distribution.
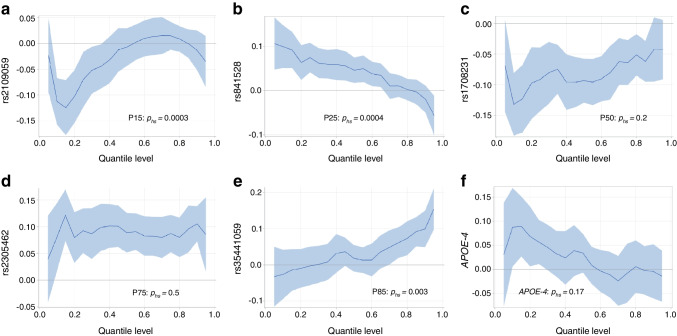
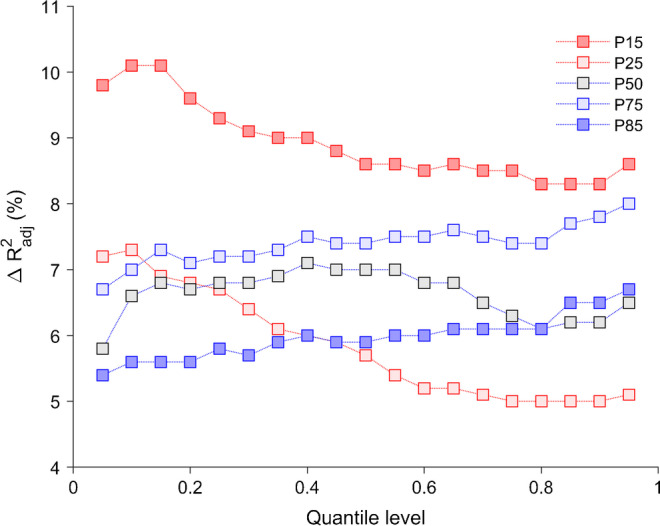
Methods: Genotyping was successful in 2825 children aged 2-14 years at the time of insulin measurement. Because insulin levels vary during childhood, GWA analyses were based on age- and sex-specific z scores. Five percentile ranks of z-insulin were selected and modelled using logistic regression, i.e. the 15th, 25th, 50th, 75th and 85th percentile ranks (P15-P85). Additive genetic models were adjusted for age, sex, BMI, survey year, survey country and principal components derived from genetic data to account for ethnic heterogeneity. Quantile regression was used to determine whether associations with variants identified by GWA analyses differed across quantiles of log-insulin.
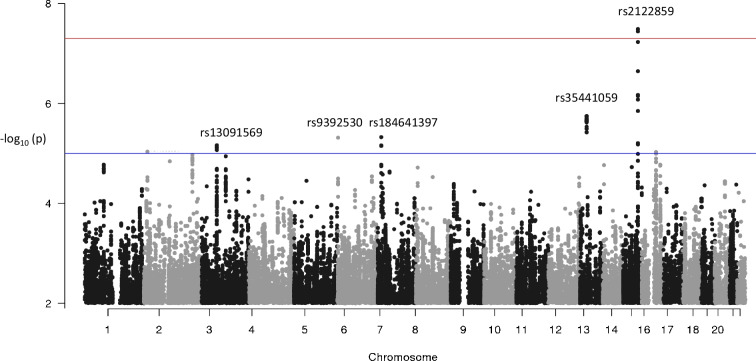
Results: A variant in the SLC28A1 gene (rs2122859) was associated with the 85th percentile rank of the insulin z score (P85, p value=3×10⁻⁸). Two variants associated with low z-insulin (P15, p value <5×10⁻⁶) were located on the RBFOX1 and SH3RF3 genes. These genes have previously been associated with both metabolic traits and dementia phenotypes. While variants associated with P50 showed stable associations across the insulin spectrum, we found that associations with variants identified through GWA analyses of P15 and P85 varied across quantiles of log-insulin.
Conclusions/interpretation: The above results support the notion of a shared genetic architecture for dementia and metabolic traits. Our approach identified genetic variants that were associated with the tails of the insulin spectrum only. Because traditional heritability estimates assume that genetic effects are constant throughout the phenotype distribution, the new findings may have implications for understanding the discrepancy in heritability estimates from GWA and family studies and for the study of U-shaped biomarker-disease associations.
Keywords: BMI; Biomarkers; Dementia; Genetics; Genome-wide association analysis; Insulin; Metabolic traits; Obesity; Quantile regression; SNP; Type 2 diabetes.
© 2023. The Author(s).
Figures
Similar articles
-
Identification of female-specific genetic variants for metabolic syndrome and its component traits to improve the prediction of metabolic syndrome in females.BMC Med Genet. 2019 Jun 6;20(1):99. doi: 10.1186/s12881-019-0830-y. BMC Med Genet. 2019. PMID: 31170924 Free PMC article.
-
The effectiveness of web-based programs on the reduction of childhood obesity in school-aged children: A systematic review.JBI Libr Syst Rev. 2012;10(42 Suppl):1-14. doi: 10.11124/jbisrir-2012-248. JBI Libr Syst Rev. 2012. PMID: 27820152
-
Implications of central obesity-related variants in LYPLAL1, NRXN3, MSRA, and TFAP2B on quantitative metabolic traits in adult Danes.PLoS One. 2011;6(6):e20640. doi: 10.1371/journal.pone.0020640. Epub 2011 Jun 2. PLoS One. 2011. PMID: 21674055 Free PMC article.
-
Association of common genetic variants with diabetes and metabolic syndrome related traits in the Arizona Insulin Resistance registry: a focus on Mexican American families in the Southwest.Hum Hered. 2014;78(1):47-58. doi: 10.1159/000363411. Epub 2014 Jul 8. Hum Hered. 2014. PMID: 25060389 Free PMC article.
-
Replication of 13 genome-wide association (GWA)-validated risk variants for type 2 diabetes in Pakistani populations.Diabetologia. 2011 Jun;54(6):1368-74. doi: 10.1007/s00125-011-2063-2. Epub 2011 Feb 25. Diabetologia. 2011. PMID: 21350842
Cited by
-
The metabolic advantage of being young and male in obesity treatment outcomes in mice.NPJ Metab Health Dis. 2025 Aug 1;3(1):32. doi: 10.1038/s44324-025-00065-2. NPJ Metab Health Dis. 2025. PMID: 40751023 Free PMC article.
References
Publication types
MeSH terms
Substances
LinkOut - more resources
Full Text Sources
Medical
Research Materials
