

Temporal and spatial analysis of Plasmodium falciparum genomics reveals patterns of parasite connectivity in a low-transmission district in Southern Province, Zambia
- PMID: 37420265
- PMCID: PMC10327325
- DOI: 10.1186/s12936-023-04637-9
Temporal and spatial analysis of Plasmodium falciparum genomics reveals patterns of parasite connectivity in a low-transmission district in Southern Province, Zambia
Abstract
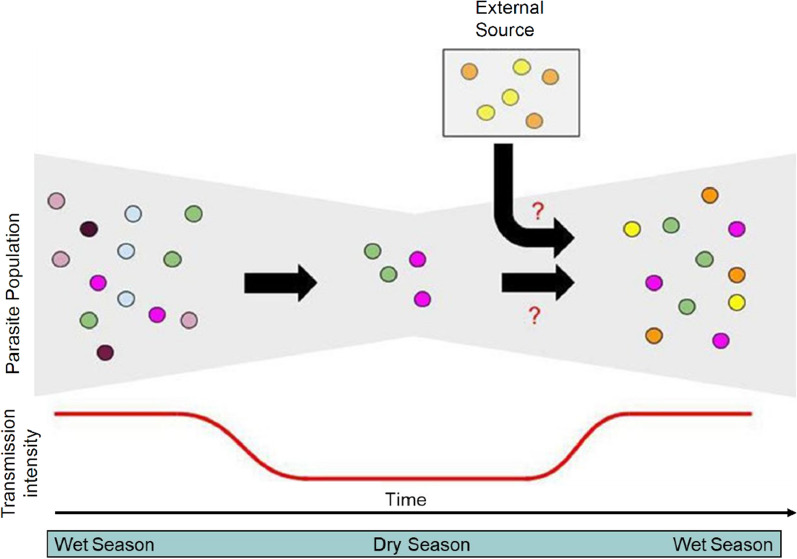
Background: Understanding temporal and spatial dynamics of malaria transmission will help to inform effective interventions and strategies in regions approaching elimination. Parasite genomics are increasingly used to monitor epidemiologic trends, including assessing residual transmission across seasons and importation of malaria into these regions.
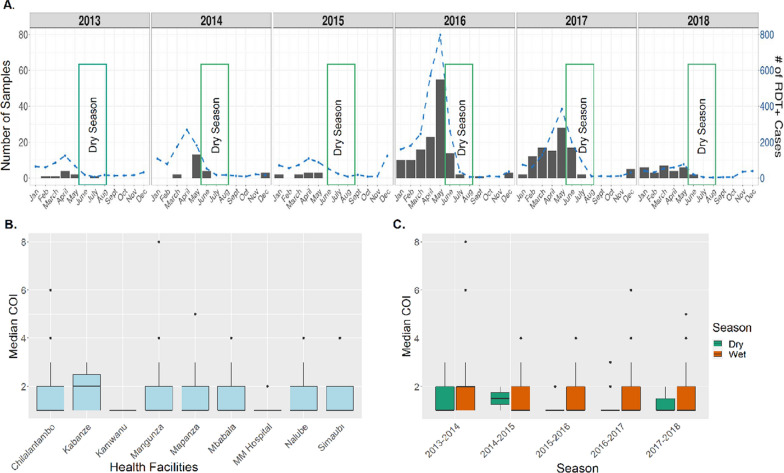
Methods: In a low and seasonal transmission setting of southern Zambia, a total of 441 Plasmodium falciparum samples collected from 8 neighbouring health centres between 2012 and 2018 were genotyped using molecular inversion probes (MIPs n = 1793) targeting a total of 1832 neutral and geographically informative SNPs distributed across the parasite genome. After filtering for quality and missingness, 302 samples and 1410 SNPs were retained and used for downstream population genomic analyses.
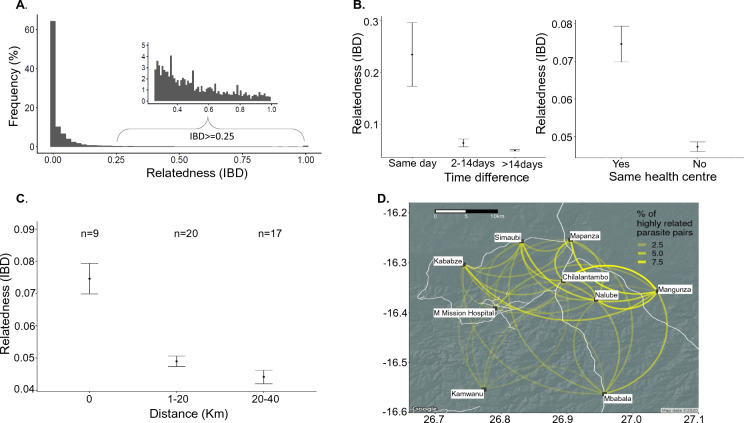
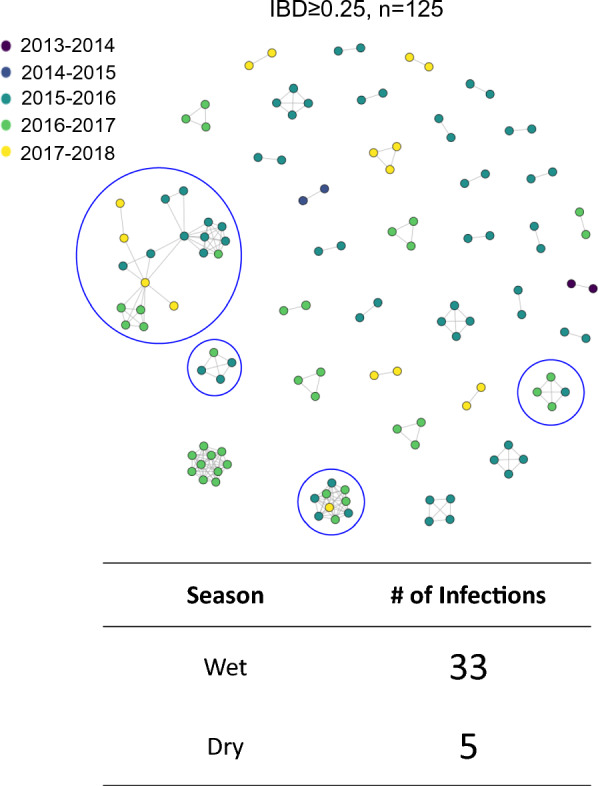
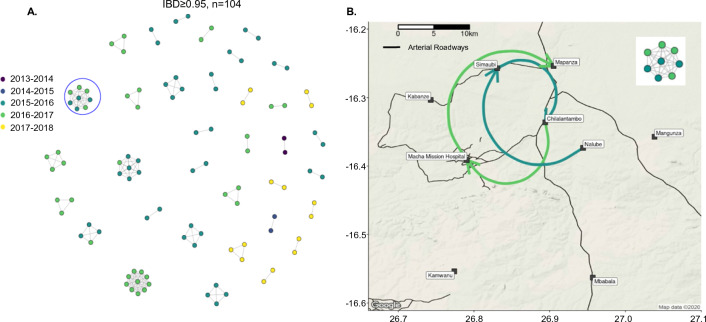
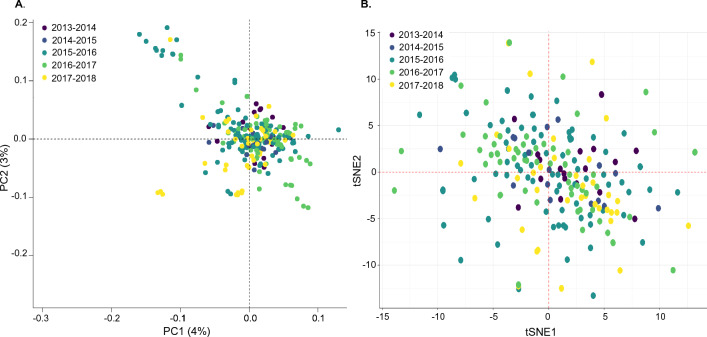
Results: The analyses revealed most (67%, n = 202) infections harboured one clone (monogenomic) with some variation at local level suggesting low, but heterogenous malaria transmission. Relatedness identity-by-descent (IBD) analysis revealed variable distribution of IBD segments across the genome and 6% of pairs were highly-related (IBD ≥ 0.25). Some of the highly-related parasite populations persisted across multiple seasons, suggesting that persistence of malaria in this low-transmission region is fueled by parasites "seeding" across the dry season. For recent years, clusters of clonal parasites were identified that were dissimilar to the general parasite population, suggesting parasite populations were increasingly fragmented at small spatial scales due to intensified control efforts. Clustering analysis using PCA and t-SNE showed a lack of substantial parasite population structure.
Conclusion: Leveraging both genomic and epidemiological data provided comprehensive picture of fluctuations in parasite populations in this pre-elimination setting of southern Zambia over 7 years.
Keywords: Genomics; Plasmodium falciparum; Transmission; Zambia.
© 2023. This is a U.S. Government work and not under copyright protection in the US; foreign copyright protection may apply.
Conflict of interest statement
None of the authors have a relevant competing interests to report.
Figures
Similar articles
-
Household clustering and seasonal genetic variation of Plasmodium falciparum at the community-level in The Gambia.Elife. 2025 May 27;13:RP103047. doi: 10.7554/eLife.103047. Elife. 2025. PMID: 40424190 Free PMC article.
-
Distinct parasite populations infect individuals identified through passive and active case detection in a region of declining malaria transmission in southern Zambia.Malar J. 2017 Apr 19;16(1):154. doi: 10.1186/s12936-017-1810-3. Malar J. 2017. PMID: 28420399 Free PMC article.
-
Genomics reveals heterogeneous Plasmodium falciparum transmission and selection signals in Zambia.Commun Med (Lond). 2024 Apr 6;4(1):67. doi: 10.1038/s43856-024-00498-8. Commun Med (Lond). 2024. PMID: 38582941 Free PMC article.
-
Applying next-generation sequencing to track falciparum malaria in sub-Saharan Africa.Malar J. 2019 Sep 3;18(1):268. doi: 10.1186/s12936-019-2880-1. Malar J. 2019. PMID: 31477139 Free PMC article. Review.
-
Out of Africa: origins and evolution of the human malaria parasites Plasmodium falciparum and Plasmodium vivax.Int J Parasitol. 2017 Feb;47(2-3):87-97. doi: 10.1016/j.ijpara.2016.05.008. Epub 2016 Jul 2. Int J Parasitol. 2017. PMID: 27381764 Free PMC article. Review.
Cited by
-
Sensitive and modular amplicon sequencing of Plasmodium falciparum diversity and resistance for research and public health.Sci Rep. 2025 Mar 28;15(1):10737. doi: 10.1038/s41598-025-94716-5. Sci Rep. 2025. PMID: 40155691 Free PMC article.
-
Strong isolation by distance and evidence of population microstructure reflect ongoing Plasmodium falciparum transmission in Zanzibar.Elife. 2024 Jun 27;12:RP90173. doi: 10.7554/eLife.90173. Elife. 2024. PMID: 38935423 Free PMC article.
-
Scientific Findings of the Southern and Central Africa International Center of Excellence for Malaria Research: Ten Years of Malaria Control Impact Assessments in Hypo-, Meso-, and Holoendemic Transmission Zones in Zambia and Zimbabwe.Am J Trop Med Hyg. 2022 Oct 11;107(4_Suppl):55-67. doi: 10.4269/ajtmh.21-1287. Print 2022 Oct 11. Am J Trop Med Hyg. 2022. PMID: 36228903 Free PMC article.
-
Household clustering and seasonal genetic variation of Plasmodium falciparum at the community-level in The Gambia.Elife. 2025 May 27;13:RP103047. doi: 10.7554/eLife.103047. Elife. 2025. PMID: 40424190 Free PMC article.
-
Genetic surveillance reveals low, sustained malaria transmission with clonal replacement in Sao Tome and Principe.medRxiv [Preprint]. 2024 Jul 16:2024.07.15.24309968. doi: 10.1101/2024.07.15.24309968. medRxiv. 2024. Update in: Commun Med (Lond). 2025 May 27;5(1):199. doi: 10.1038/s43856-025-00905-8. PMID: 39072035 Free PMC article. Updated. Preprint.
References
-
- Fola AA, Nate E, Abby Harrison GL, Barnadas C, Hetzel MW, Iga J, et al. Nationwide genetic surveillance of Plasmodium vivax in Papua New Guinea reveals heterogeneous transmission dynamics and routes of migration amongst subdivided populations. Infect Genet Evol. 2018;58:83–95. doi: 10.1016/j.meegid.2017.11.028. - DOI - PubMed
-
- Ruybal-Pesántez S, Sáenz FE, Deed S, Johnson EK, Larremore DB, Vera-Arias CA, et al. Clinical malaria incidence following an outbreak in Ecuador was predominantly associated with Plasmodium falciparum with recombinant variant antigen gene repertoires. MedRxiv. 2021 doi: 10.1101/2021.04.12.21255093v1.full. - DOI
MeSH terms
Grants and funding
LinkOut - more resources
Full Text Sources
Medical
