

S-531011, a Novel Anti-Human CCR8 Antibody, Induces Potent Antitumor Responses through Depletion of Tumor-Infiltrating CCR8-Expressing Regulatory T Cells
- PMID: 37420296
- PMCID: PMC10477828
- DOI: 10.1158/1535-7163.MCT-22-0570
S-531011, a Novel Anti-Human CCR8 Antibody, Induces Potent Antitumor Responses through Depletion of Tumor-Infiltrating CCR8-Expressing Regulatory T Cells
Abstract
Although regulatory T cells (Treg) are inhibitory immune cells that are essential for maintaining immune homeostasis, Tregs that infiltrate tumor tissue promote tumor growth by suppressing antitumor immunity. Selective reduction of tumor-infiltrating Tregs is, therefore, expected to activate antitumor immunity without affecting immune homeostasis. We previously reported that selective Treg depletion targeted by a C-C motif chemokine receptor 8 (CCR8) resulted in induction of strong antitumor immunity without any obvious autoimmunity in mouse models. Thus, herein, we developed a novel humanized anti-CCR8 monoclonal antibody, S-531011, aimed as a cancer immunotherapy strategy for patients with cancer. S-531011 exclusively recognized human CCR8 among all chemokine receptors and showed potent antibody-dependent cell-mediated cytotoxicity activity toward CCR8+ cells and neutralization activity against CCR8-mediated signaling. We observed that S-531011 reduced tumor-infiltrating CCR8+ Tregs and induced potent antitumor activity in a tumor-bearing human-CCR8 knock-in mouse model. Moreover, combination therapy with S-531011 and anti-mouse programmed cell death 1 (PD-1) antibody strongly suppressed tumor growth compared with anti-PD-1 antibody alone with no observable adverse effects. S-531011 also depleted human tumor-infiltrating Tregs, but not Tregs derived from human peripheral blood mononuclear cells. These results suggest that S-531011 is a promising drug for inducing antitumor immunity without severe side effects in the clinical setting.
©2023 The Authors; Published by the American Association for Cancer Research.
Figures
![Figure 1. In vitro biological profiles of S-531011. Representative histogram of binding of S-531011 to tumor-infiltrating CD45+CD3+CD4+Foxp3−CD25− cells (A) and CD45+CD3+CD4+Foxp3+CD25+ cells (B), and representative figures of ADCC (C), neutralization (D), and CDC (E). In C, data were expressed as corrected RFU (RFU in S-531011 – RFU in human IgG1 isotype control antibody). In D, the percentage RFU of effectivity was calculated using the following formula: % RFU = [1 − {S-531011 – Control (+)} / {Control (−) – Control (+)}] × 100. Control (−) represents the average RFU value in the absence of S-531011 and Control (+) represents the average RFU value in the presence of 4.4 μg/mL (maximum concentration) S-531011. In E, dead cell (%) was calculated as DAPI-positive cells/target cells × 100.](https://cdn.ncbi.nlm.nih.gov/pmc/blobs/64a6/10477828/382e77c141fe/1063fig1.jpg)
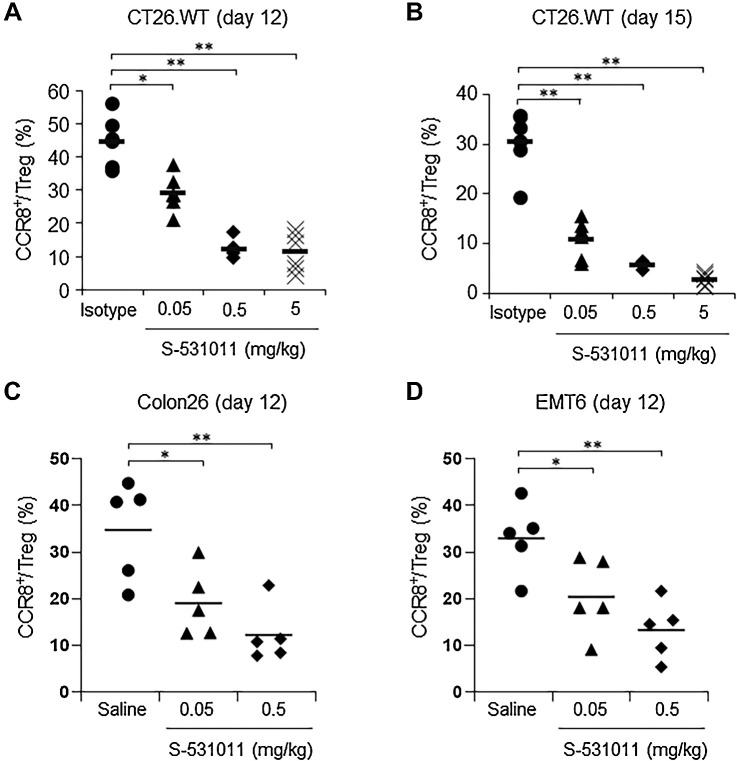
![Figure 3. In vivo antitumor activity of S-531011 in a CT26.WT or EMT6 tumor-bearing mouse model. CT26.WT cells (A, C, and D) or EMT6 cells (B) were subcutaneously implanted into the back of hCCR8 KI mice. A, S-531011 or 15 mg/kg isotype IgG1 antibody was administered intravenously on days 4 and 11. B, S-531011 or anti-mouse PD-1 antibody or vehicle was administered intravenously on days 5 and 12. C and D, S-531011 and/or anti-mouse PD-1 antibody or isotype IgG1 antibody was intravenously administered on day 5. Tumor volume (A–C) and body weight of mice (D) were measured. Tumor volume (cm3) was calculated using the following formula: [(Length × Width × Breadth) ÷ 2]. Each point and bar showed the mean and SE of tumor volume, respectively (A, n = 10; B, n = 10; C, n = 9). A: *, P < 0.05; **, P < 0.001 (vs. isotype IgG1 group on day 19; Dunnett multiple comparison test). B: *, P < 0.05; ***, P < 0.0001 (vs. control group at 28 days after implantation, Dunnett multiple comparison test); #, P < 0.05 (vs. anti–PD-1 antibody-treated group at day 28, Mann–Whitney U test); C: *, P < 0.05; ***, P < 0.0001 (vs. isotype IgG1-treated group at day 21, Dunnett multiple comparison test); #, P < 0.05 (vs. S-531011-treated group at day 21, Mann–Whitney U test). Tumor growth curves for each individual mouse in each group are shown in Supplementary Fig. S5.](https://cdn.ncbi.nlm.nih.gov/pmc/blobs/64a6/10477828/4f8ea2a6f1a9/1063fig3.jpg)
References
-
- Ribas A, Hamid O, Daud A, Hodi FS, Wolchok JD, Kefford R, et al. Association of pembrolizumab with tumour response and survival among patients with advanced melanoma. JAMA 2016;315:1600–9. - PubMed
-
- Kim J, Lahl K, Hori S, Loddenkemper C, Chaudhry A, deRoos P, et al. Cutting edge: depletion of Foxp3+ cells leads to induction of autoimmunity by specific ablation of regulatory T cells in genetically targeted mice. J Immunol 2009;183:7631–4. - PubMed
-
- Bennet CL, Christie J, Ramsdell F, Brunkow ME, Ferguson PJ, Whitesell L, et al. The immune dysregulation, polyendocrinopathy, enteropathy, X-linked syndrome (IPEX) is caused by mutations of FOXP3. Nat Genet 2001;27:20–1. - PubMed
Publication types
MeSH terms
Substances
LinkOut - more resources
Full Text Sources
Medical
Research Materials
