. 2023 Jul 7;11(1):110.
doi: 10.1186/s40478-023-01604-y.

Compensatory cross-talk between autophagy and glycolysis regulates senescence and stemness in heterogeneous glioblastoma tumor subpopulations

Affiliations

Compensatory cross-talk between autophagy and glycolysis regulates senescence and stemness in heterogeneous glioblastoma tumor subpopulations

Emma Martell et al. Acta Neuropathol Commun. .

Abstract

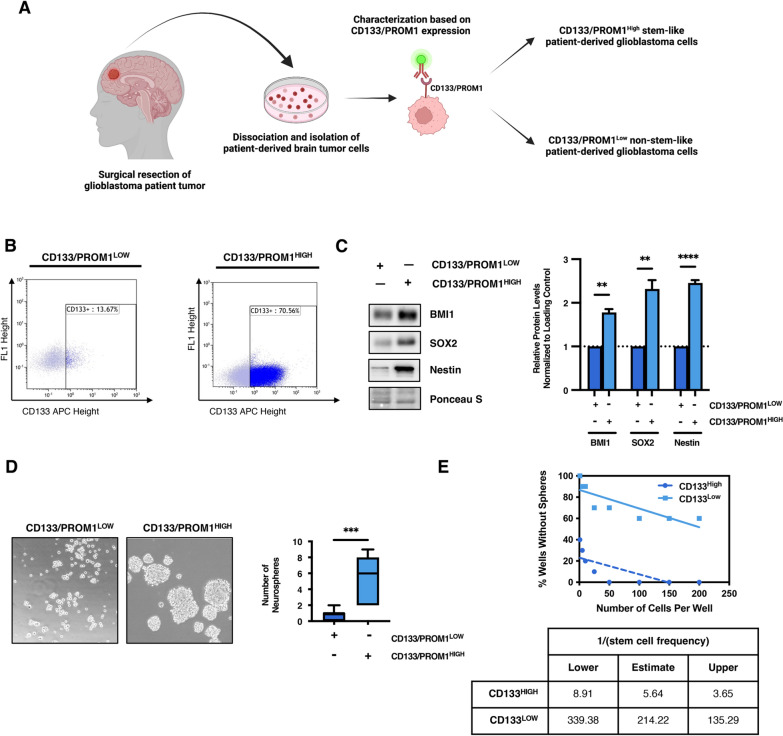
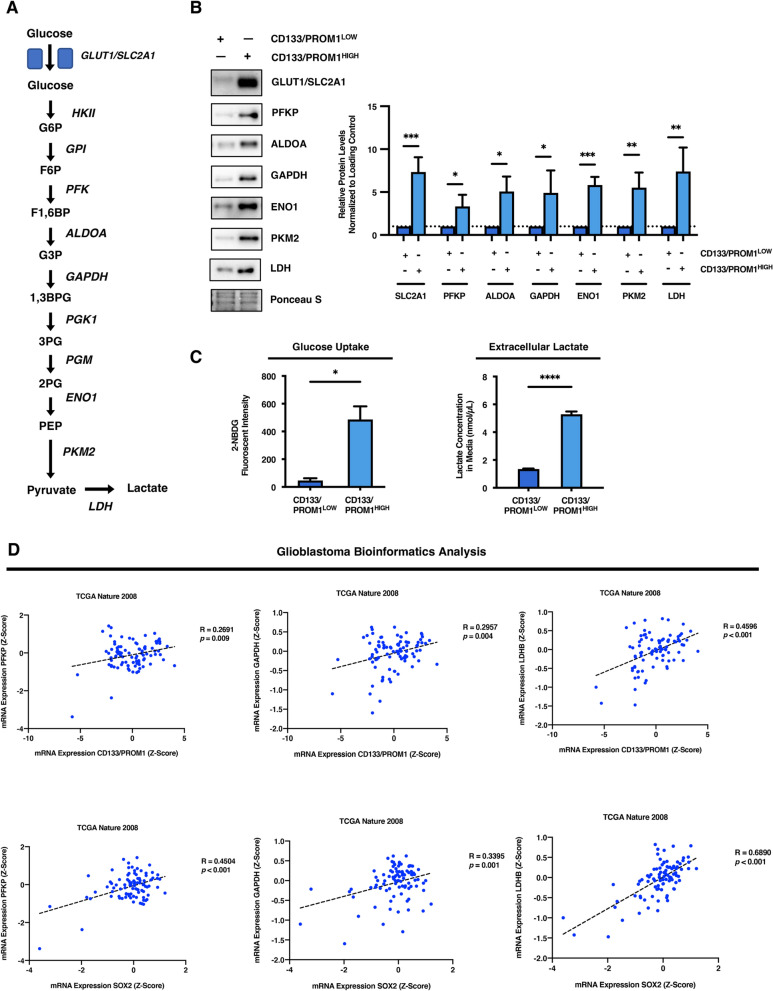
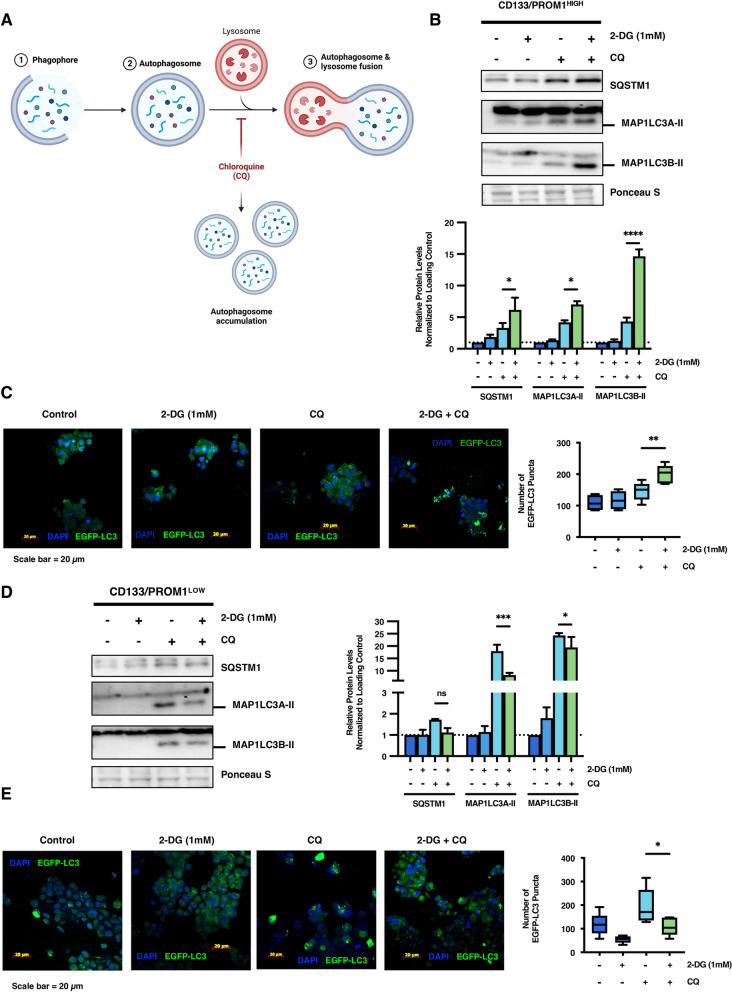
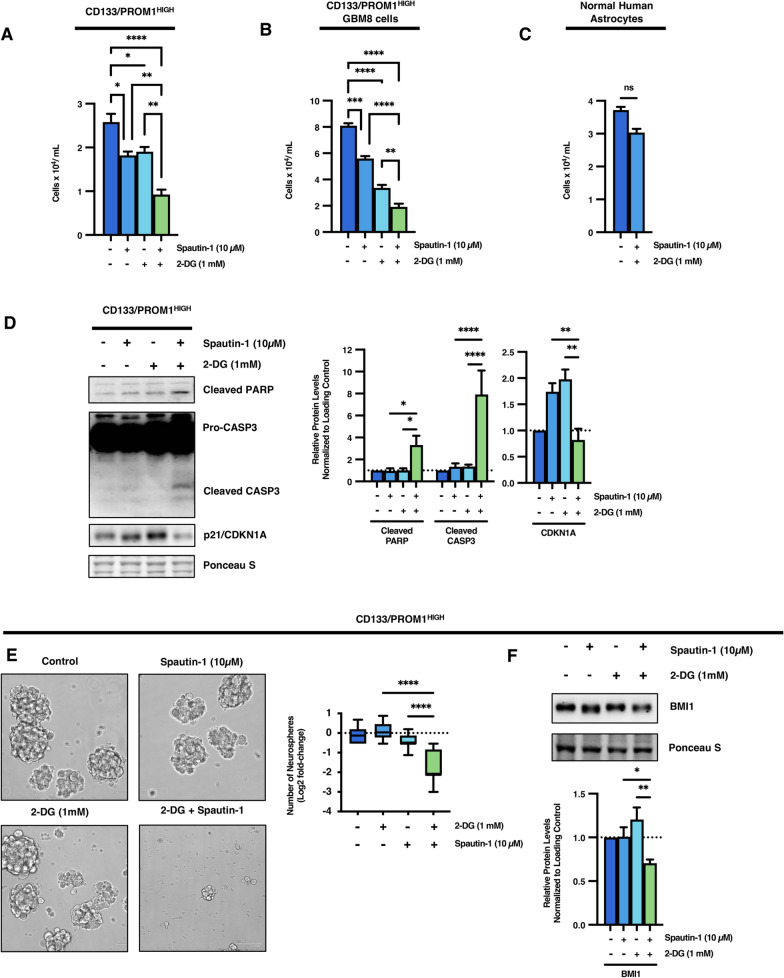
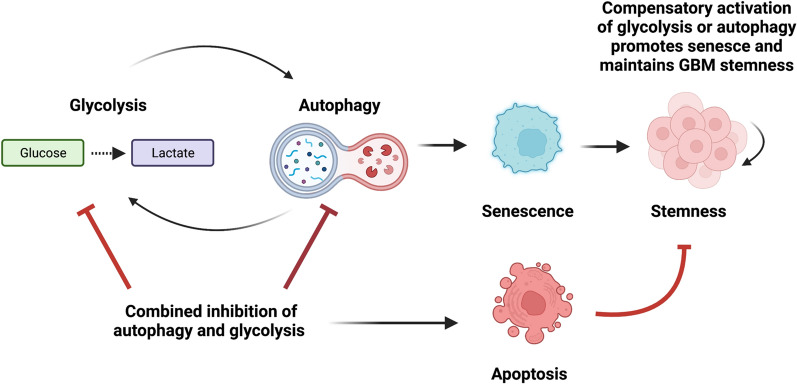
Despite tremendous research efforts, successful targeting of aberrant tumor metabolism in clinical practice has remained elusive. Tumor heterogeneity and plasticity may play a role in the clinical failure of metabolism-targeting interventions for treating cancer patients. Moreover, compensatory growth-related processes and adaptive responses exhibited by heterogeneous tumor subpopulations to metabolic inhibitors are poorly understood. Here, by using clinically-relevant patient-derived glioblastoma (GBM) cell models, we explore the cross-talk between glycolysis, autophagy, and senescence in maintaining tumor stemness. We found that stem cell-like GBM tumor subpopulations possessed higher basal levels of glycolytic activity and increased expression of several glycolysis-related enzymes including, GLUT1/SLC2A1, PFKP, ALDOA, GAPDH, ENO1, PKM2, and LDH, compared to their non-stem-like counterparts. Importantly, bioinformatics analysis also revealed that the mRNA expression of glycolytic enzymes positively correlates with stemness markers (CD133/PROM1 and SOX2) in patient GBM tumors. While treatment with glycolysis inhibitors induced senescence in stem cell-like GBM tumor subpopulations, as evidenced by increased β-galactosidase staining and upregulation of the cell cycle regulators p21Waf1/Cip1/CDKN1A and p16INK4A/CDKN2A, these cells maintained their aggressive stemness features and failed to undergo apoptotic cell death. Using various techniques including autophagy flux and EGFP-MAP1LC3B+ puncta formation analysis, we determined that inhibition of glycolysis led to the induction of autophagy in stem cell-like GBM tumor subpopulations, but not in their non-stem-like counterparts. Similarly, blocking autophagy in stem cell-like GBM tumor subpopulations induced senescence-associated growth arrest without hampering stemness capacity or inducing apoptosis while reciprocally upregulating glycolytic activity. Combinatorial treatment of stem cell-like GBM tumor subpopulations with autophagy and glycolysis inhibitors blocked the induction of senescence while drastically impairing their stemness capacity which drove cells towards apoptotic cell death. These findings identify a novel and complex compensatory interplay between glycolysis, autophagy, and senescence that helps maintain stemness in heterogeneous GBM tumor subpopulations and provides a survival advantage during metabolic stress.

Keywords: Autophagy; Cancer stem cell-like cells; Glioblastoma; Glycolysis; Metabolism; Senescence; Tumor heterogeneity.


Conflict of interest statement

The authors declare that they have no competing interests.

Figures

Fig. 1
Fig. 1
Heterogeneous tumor subpopulations possess different functional stemness capacity. a Schematic diagram depicting the isolation and characterization of patient-derived glioblastoma (GBM) cells. Created using Biorender.com. b Flow cytometry dot plots of CD133/PROM1 expression in CD133/PROM1LOW and CD133/PROM1HIGH patient-derived GBM cells. c Western blot analysis comparing the expression of BMI1, SOX2 and Nestin in CD133/PROM1LOW and CD133/PROM1HIGH patient-derived GBM cells and the graph represents densitometry quantification from three independent experiments. Statistical analysis was performed using two-sided students t test. *p < 0.05; **p < 0.01; ***p < 0.001; ns = non-significant. d CD133/PROM1LOW and CD133/PROM1HIGH patient-derived GBM cells were subjected to neurosphere formation analysis and the graph represents the quantification of neurospheres > 50 µm in size. Statistical analysis was performed using two-sided students t-test. *p < 0.05; **p < 0.01; ***p < 0.001; ns = non-significant. e Graph showing the proportion of wells without neurospheres formed in limiting dilution assay from CD133/PROM1LOW and CD133/PROM1HIGH patient-derived GBM cells. Table represents the Limiting Dilution Analysis calculations generated using ELDA software from https://bioinf.wehi.edu.au/software/elda/
Fig. 2
Fig. 2
Heterogeneous tumor subpopulations differ in their glycolytic metabolic capacity. a Schematic diagram depicting the enzymes which catalyze the metabolic reactions that comprise the glycolytic pathway. b Western blot analysis comparing the expression of the glucose uptake receptor GLUT1/SLC2A1 and several glycolytic enzymes (PFKP, ALDOA, GAPDH, ENO1, PKM2, and LDH) in CD133/PROM1LOW and CD133/PROM1HIGH patient-derived GBM cells. Graph represents densitometry quantification of western blots from three independent experiments. Statistical analysis was performed using two-sided students t-test. *p < 0.05; **p < 0.01; ***p < 0.001; ns = non-significant. c Glucose uptake capacity was compared in CD133/PROM1LOW and CD133/PROM1HIGH patient-derived GBM cells by monitoring the accumulation of intracellular 2-NBDG through measuring the fluorescent intensity. Extracellular lactate levels were quantified in CD133/PROM1LOW and CD133/PROM1HIGH patient-derived GBM cells using a lactate assay and normalized to total protein concentration. Statistical analysis was performed using two-sided students t-test. *p < 0.05; **p < 0.01; ***p < 0.001; ns = non-significant. d Bioinformatic analysis of mRNA expression from 91 GBM biospecimens from the TGCA pilot (Nature, 2008). Pearson correlation between the expression of glycolytic enzymes (PFKP, GAPDH, and LDHB) and stemness markers (CD133/PROM1 and SOX2) was performed and Pearson’s r correlation coefficients were calculated. Statistical analysis was performed using two-sided student’s t-test and exact p values are given.
Fig. 3
Fig. 3
Glycolysis inhibition selectively impairs the growth of stem cell-like tumor subpopulations through induction of senescence but does not induce apoptosis or hamper stemness capacity. a CD133/PROM1LOW and CD133/PROM1HIGH patient-derived GBM cells were treated with increasing doses of 2-deoxyglucose (2-DG) from 0.25 to 3 mM. 24 h post-treatment cells were counted using trypan blue exclusion and then plotted as a percent of non-treated control cells. Statistical analysis was performed using two-sided students t-test. *p < 0.05; **p < 0.01; ***p < 0.001; ns = non-significant. b Western blot analysis of CD133/PROM1HIGH patient-derived GBM cells following treatment with 1 mM of 2-DG for CASP3 (Pro-CASP3 35 kDa and cleaved CASP-3 17 & 19 kDa) and cleaved PARP (89 kDa). Positive control of cells treated with cytotoxic chemical were run in parallel. Graph represents densitometry quantification of western blots from three independent experiments. Statistical analysis was performed using two-sided students t-test. *p < 0.05; **p < 0.01; ***p < 0.001; ns = non-significant. c Western blot analysis of CD133/PROM1HIGH patient-derived GBM cells following treatment with 1 mM of 2-DG for p21/CDKN1A expression. Graph represents densitometry quantification of western blots from three independent experiments. Statistical analysis was performed using two-sided students t-test. *p < 0.05; **p < 0.01; ***p < 0.001; ns = non-significant. d Non-treated controls and 2-DG (1 mM) treated CD133/PROM1HIGH patient-derived GBM cells were subjected to β-galactosidase/GLB1 staining 24-h post-treatment to detect the presence of senescent cells. e Non-treated controls and 2-DG (1 mM) treated CD133/PROM1HIGH patient-derived GBM cells were subjected to western blot analysis for the expression of BMI1. Graph represents densitometry quantification from three independent experiments. Statistical analysis was performed using two-sided students t-test. *p < 0.05; **p < 0.01; ***p < 0.001; ns = non-significant. f Non-treated controls and 2-DG (1 mM) treated CD133/PROM1HIGH patient-derived GBM cells were subjected to neurosphere formation analysis and the graph represents the quantification of neurospheres > 50 µm in size. Statistical analysis was performed using two-sided students t-test. *p < 0.05; **p < 0.01; ***p < 0.001; ns = non-significant.
Fig. 4
Fig. 4
Glycolysis inhibition selectively induces autophagy in CD133/PROM1HIGH stem cell-like patient-derived GBM cells but not CD133/PROM1LOW non-stem-like patient-derived GBM cells. a Schematic diagram depicting the mechanism of action for chloroquine (CQ) and the principal of the autophagy flux assay. Created using Biorender.com. b CD133/PROM1HIGH patient-derived GBM cells were treated with 2-DG (1 mM) and subjected to autophagy flux analysis where cells were treated with the late-stage autophagy inhibitor CQ and subjected to western blot analysis for the autophagosome-associated proteins SQSTM1, MAP1LC3A-II (14 kDa), and MAP1LC3B-II (14 kDa). Graph represents densitometry quantification of western blots from at least 3 independent experiments. Statistical analysis was performed using ANOVA. *p < 0.05; **p < 0.01; ***p < 0.001; ns = non-significant. c CD133/PROM1HIGH patient-derived GBM cells with exogenous overexpression of EGFP-LC3 were treated with 2-DG (1 mM) and/or the late-stage autophagy inhibitor CQ and autophagosome assembly was assessed by monitoring the formation of EGFP-LC3+ punctae and the number of EGFP-LC3+ punctae were quantified. Statistical analysis was performed using ANOVA. *p < 0.05; **p < 0.01; ***p < 0.001; ns = non-significant. d CD133/PROM1LOW patient-derived GBM cells were treated with 2-DG (1 mM) and subjected to autophagy flux analysis where cells were treated with the late-stage autophagy inhibitor CQ and subjected to western blot analysis for the autophagosome-associated proteins SQSTM1, MAP1LC3A-II (14 kDa), and MAP1LC3B-II (14 kDa). Graph represents densitometry quantification of western blots from at least 3 independent experiments. Statistical analysis was performed using ANOVA. *p < 0.05; **p < 0.01; ***p < 0.001; ns = non-significant. e CD133/PROM1LOW patient-derived GBM cells with exogenous overexpression of EGFP-LC3 were treated with 2-DG (1 mM) and/or the late-stage autophagy inhibitor CQ and autophagosome assembly was assessed by monitoring the formation of EGFP-LC3+ punctae and the number of EGFP-LC3+ punctae were quantified. Statistical analysis was performed using ANOVA. *p < 0.05; **p < 0.01; ***p < 0.001; ns = non-significant
Fig. 5
Fig. 5
Autophagy inhibition reciprocally promotes autophagy in stem cell-like tumor subpopulations and regulates senescence to maintain stemness. a CD133/PROM1HIGH patient-derived GBM cells were treated with 10 µM of Spautin-1 and the number of cells were counted after 24 h using trypan blue exclusion. Statistical analysis was performed using two-sided students t-test. *p < 0.05; **p < 0.01; ***p < 0.001; ns = non-significant. b Western blot analysis of CD133/PROM1HIGH patient-derived GBM cells following treatment with 10 µM of Spautin-1 for CASP3 (Pro-CASP 35 kDa and cleaved CASP-3 17 & 19 kDa) and cleaved PARP (89 kDa). Positive control of cells treated with cytotoxic chemical were run in parallel. Graph represents densitometry quantification of western blots from three independent experiments. Statistical analysis was performed using two-sided students t-test. *p < 0.05; **p < 0.01; ***p < 0.001; ns = non-significant. c Western blot analysis of CD133/PROM1HIGH patient-derived GBM cells following treatment with 10 µM of Spautin-1 for p21/CDKN1A expression. Graph represents densitometry quantification of western blots from three independent experiments. Statistical analysis was performed using two-sided students t-test. *p < 0.05; **p < 0.01; ***p < 0.001; ns = non-significant. d Non-treated controls and Spautin-1 (10 µM) treated CD133/PROM1HIGH patient-derived GBM cells were subjected to β-galactosidase/GLB1 staining 24-h post-treatment to detect the presence of senescent cells. e Non-treated controls and Spautin-1 (10 µM) treated CD133/PROM1HIGH patient-derived GBM cells were subjected to western blot analysis for the expression of BMI1. Graph represents densitometry quantification from three independent experiments. Statistical analysis was performed using two-sided students t-test. *p < 0.05; **p < 0.01; ***p < 0.001; ns = non-significant. f Non-treated controls and Spautin-1 (10 µM) treated CD133/PROM1HIGH patient-derived GBM cells were subjected to neurosphere formation analysis and the graph represents the quantification of neurospheres > 50 µm in size. Statistical analysis was performed using two-sided students t-test. *p < 0.05; **p < 0.01; ***p < 0.001; ns = non-significant. g Non-treated controls and Spautin-1 (10 µM) treated CD133/PROM1HIGH patient-derived GBM cells were subjected to glucose uptake assay and the fluorescent intensity of intracellular 2-NBDG was quantified. Statistical analysis was performed using two-sided students t-test. *p < 0.05; **p < 0.01; ***p < 0.001; ns = non-significant. h Extracellular lactate levels were quantified in non-treated controls and Spautin-1 (10 µM) treated CD133/PROM1HIGH patient-derived GBM cells using a lactate assay and normalized to total protein concentration. Statistical analysis was performed using two-sided students t-test. *p < 0.05; **p < 0.01; ***p < 0.001; ns = non-significant
Fig. 6
Fig. 6
Combination of glycolysis and autophagy inhibition cumulatively decreases the growth of stem cell-like tumor subpopulations and suppresses stemness by blocking induction of senescence and promoting apoptosis. a CD133/PROM1HIGH patient-derived GBM cells were treated with 2-DG (1 mM) and/or the autophagy inhibitor Spautin-1 (10 µM) for 24 h and the number of viable cells were counted using trypan blue exclusion. Statistical analysis was performed using ANOVA. *p < 0.05; **p < 0.01; ***p < 0.001. b An additional independent CD133/PROM1HIGH patient-derived GBM cell line, GBM8, was treated with 2-DG (1 mM) and/or the autophagy inhibitor Spautin-1 (10 µM) for 24 h and the number of viable cells were counted using trypan blue exclusion. Statistical analysis was performed using ANOVA. *p < 0.05; **p < 0.01; ***p < 0.001. c Normal human astrocytes were treated with a combination of 2-DG (1 mM) and the autophagy inhibitor Spautin-1 (10 µM) for 24 h and the number of viable cells were counted using trypan blue exclusion. Statistical analysis was performed using two-sided students t-test. *p < 0.05; **p < 0.01; ***p < 0.001. d CD133/PROM1HIGH patient-derived GBM cells were treated with 2-DG (1 mM) and/or Spautin-1 (10 µM) and subjected to western blot analysis for CASP3 (Pro-CASP 35 kDa and cleaved CASP-3 17 & 19 kDa), cleaved PARP (89 kDa), and p21/CDKN1A. Graph represents densitometry quantification from three independent experiments. Statistical analysis was performed using ANOVA. *p < 0.05; **p < 0.01; ***p < 0.001; ns = non-significant. e CD133/PROM1HIGH patient-derived GBM cells were treated with 2-DG (1 mM) and/or Spautin-1 (10 µM) and subjected to neurosphere formation analysis and the graph represents the quantification of neurospheres > 50 µm. Statistical analysis was performed using ANOVA. *p < 0.05; **p < 0.01; ***p < 0.001 ns = non-significant. f CD133/PROM1HIGH patient-derived GBM cells were treated with 2-DG (1 mM) and/or Spautin-1 (10 µM) and subjected to western blot analysis for the expression of BMI1. Graph represents densitometry quantification from three independent experiments. Statistical analysis was performed using ANOVA. *p < 0.05; **p < 0.01; ***p < 0.001; ns = non-significant
Fig. 7
Fig. 7
Glycolysis, autophagy, and senescence engage in a cross-talk that helps maintain the stemness capacity of GBM tumor subpopulations. Schematic diagram summarizing the role of compensatory cross-talk between glycolysis and autophagy on the fate of stem cell-like GBM tumor subpopulations. Created with Biorender.com

References

    1. Andrzejewski S, Klimcakova E, Johnson RM, Tabaries S, Annis MG, McGuirk S, Northey JJ, Chenard V, Sriram U, Papadopoli DJ, et al. PGC-1alpha promotes breast cancer metastasis and confers bioenergetic flexibility against metabolic drugs. Cell Metab. 2017;26:778–787. doi: 10.1016/j.cmet.2017.09.006. - DOI - PubMed
    1. Bao S, Wu Q, McLendon RE, Hao Y, Shi Q, Hjelmeland AB, Dewhirst MW, Bigner DD, Rich JN. Glioma stem cells promote radioresistance by preferential activation of the DNA damage response. Nature. 2006;444:756–760. doi: 10.1038/nature05236. - DOI - PubMed
    1. Ben-Porath I, Thomson MW, Carey VJ, Ge R, Bell GW, Regev A, Weinberg RA. An embryonic stem cell-like gene expression signature in poorly differentiated aggressive human tumors. Nat Genet. 2008;40:499–507. doi: 10.1038/ng.127. - DOI - PMC - PubMed
    1. Boumahdi S, Driessens G, Lapouge G, Rorive S, Nassar D, Le Mercier M, Delatte B, Caauwe A, Lenglez S, Nkusi E, et al. SOX2 controls tumour initiation and cancer stem-cell functions in squamous-cell carcinoma. Nature. 2014;511:246–250. doi: 10.1038/nature13305. - DOI - PubMed
    1. Bryant KL, Stalnecker CA, Zeitouni D, Klomp JE, Peng S, Tikunov AP, Gunda V, Pierobon M, Waters AM, George SD, et al. Combination of ERK and autophagy inhibition as a treatment approach for pancreatic cancer. Nat Med. 2019;25:628–640. doi: 10.1038/s41591-019-0368-8. - DOI - PMC - PubMed

Publication types

Substances