. 2023 Jun 8;23(12):5446.
doi: 10.3390/s23125446.

Healthcare Application of In-Shoe Motion Sensor for Older Adults: Frailty Assessment Using Foot Motion during Gait

Affiliations

Healthcare Application of In-Shoe Motion Sensor for Older Adults: Frailty Assessment Using Foot Motion during Gait

Chenhui Huang et al. Sensors (Basel). .

Abstract

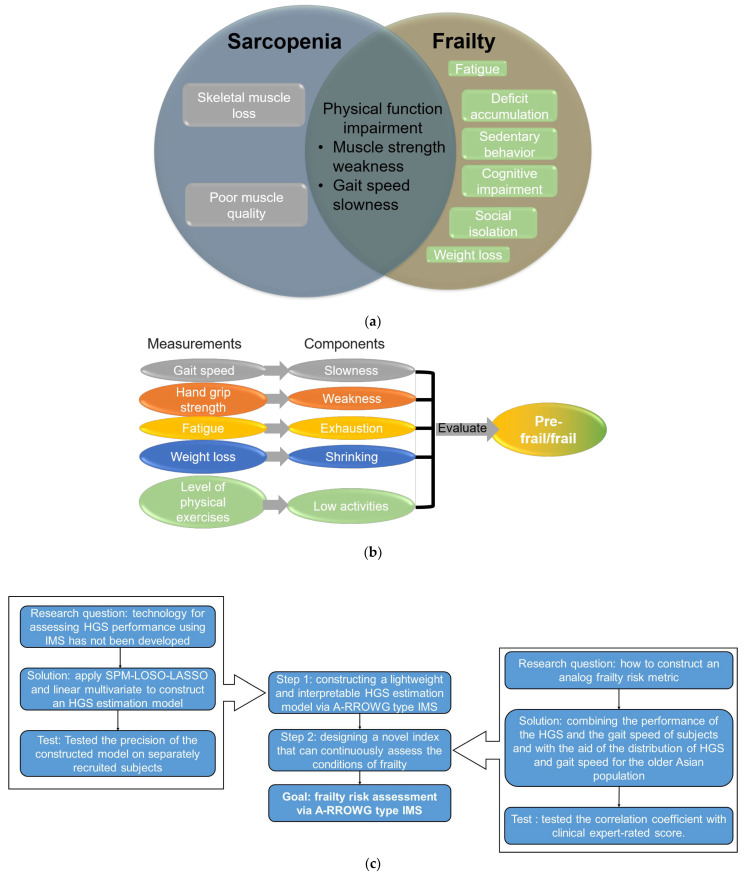
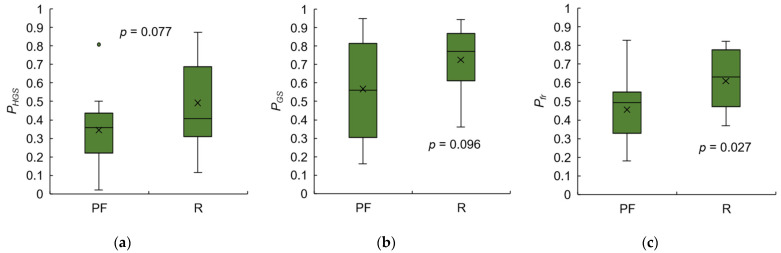
Frailty poses a threat to the daily lives of healthy older adults, highlighting the urgent need for technologies that can monitor and prevent its progression. Our objective is to demonstrate a method for providing long-term daily frailty monitoring using an in-shoe motion sensor (IMS). We undertook two steps to achieve this goal. Firstly, we used our previously established SPM-LOSO-LASSO (SPM: statistical parametric mapping; LOSO: leave-one-subject-out; LASSO: least absolute shrinkage and selection operator) algorithm to construct a lightweight and interpretable hand grip strength (HGS) estimation model for an IMS. This algorithm automatically identified novel and significant gait predictors from foot motion data and selected optimal features to construct the model. We also tested the robustness and effectiveness of the model by recruiting other groups of subjects. Secondly, we designed an analog frailty risk score that combined the performance of the HGS and gait speed with the aid of the distribution of HGS and gait speed of the older Asian population. We then compared the effectiveness of our designed score with the clinical expert-rated score. We discovered new gait predictors for HGS estimation via IMSs and successfully constructed a model with an "excellent" intraclass correlation coefficient and high precision. Moreover, we tested the model on separately recruited subjects, which confirmed the robustness of our model for other older individuals. The designed frailty risk score also had a large effect size correlation with clinical expert-rated scores. In conclusion, IMS technology shows promise for long-term daily frailty monitoring, which can help prevent or manage frailty for older adults.

Keywords: frailty assessment; gait analysis; healthcare application; in-shoe motion sensor; older adults.


Conflict of interest statement

The authors declare no conflict of interest.

Figures

Figure 1
Figure 1
(a) Relationship between sarcopenia and frailty. (b) Revised Japanese version of Cardiovascular Health Study criteria. (c) Diagram which explains the development process of achieving frailty risk assessment via A-RROWG-type IMS.
Figure 2
Figure 2
Schematic of (a) measurement of HGS. The subjects were asked to sit on an armchair sitting with the elbow in 90° flexion, but the elbow cannot touch the chair arms. The dynamometer was set at handle position “two”. (b) The structure of an IMS (left side). IMS was embedded in an insole placed under the foot arch near the calcaneus side and then inserted into a sport shoe.
Figure 3
Figure 3
The flowchart of procedures to obtain GP predictors.
Figure 4
Figure 4
(a) Process of feature construction, feature selection, and model construction for HGS estimation. Ω1–Ω100: 100 types of features combinations in accordance with different regularization coefficients set in LASSO for HGS estimation; H1H100: 100 types of candidate multivariate regression models for HGS estimation; ICCk denotes ICC value of model Hk; Mo: optimal models for HGS estimation. (b) Details of LOSO-LASSO; U: total number of participants for training data; λu: u-th regularization coefficient vector for LASSO, 100 dimensions; λui: i-th element of λu; βui: fitted least-squares regression coefficients corresponding to λui; Bu: u-th label matrix obtained by substituting nonzero elements in LASSO coefficient by 1; B0: label counter matrix; B: final label matrix obtained by substituting elements over and below 0.95 × U by 1 and 0 in B0. (c) Other three models derived by optimizing three other predictor combinations by the same process as Mo, M1: gait speed (GP02), M2: M1 plus other GPs in one stride, and M3: M2 plus IPAs. Green dashed boxes in (c) indicate the corresponding process included in the same box shown in (a).
Figure 4
Figure 4
(a) Process of feature construction, feature selection, and model construction for HGS estimation. Ω1–Ω100: 100 types of features combinations in accordance with different regularization coefficients set in LASSO for HGS estimation; H1H100: 100 types of candidate multivariate regression models for HGS estimation; ICCk denotes ICC value of model Hk; Mo: optimal models for HGS estimation. (b) Details of LOSO-LASSO; U: total number of participants for training data; λu: u-th regularization coefficient vector for LASSO, 100 dimensions; λui: i-th element of λu; βui: fitted least-squares regression coefficients corresponding to λui; Bu: u-th label matrix obtained by substituting nonzero elements in LASSO coefficient by 1; B0: label counter matrix; B: final label matrix obtained by substituting elements over and below 0.95 × U by 1 and 0 in B0. (c) Other three models derived by optimizing three other predictor combinations by the same process as Mo, M1: gait speed (GP02), M2: M1 plus other GPs in one stride, and M3: M2 plus IPAs. Green dashed boxes in (c) indicate the corresponding process included in the same box shown in (a).
Figure 5
Figure 5
Results of correlation analysis between foot motion and HGS using SPM for both (a) males (blue lines) and (b) females (red lines). Foot motion waveforms Ax, Ay, Az, Gx, Gy, and Gz were normalized by the maximum instantaneous speed in one stride. The 95% confidence interval of a waveform is shown by double dotted lines linked to foot motion signals. Statistic curves outside gray zones for each signal type indicate that intervals of GCs significantly correlated with HGS defined as GPCs. GC: gait cycle, SPM{F}: F statistic of vector field analysis by SPM-CCA, SPM{t}: statistic of post hoc scalar trajectory linear correlation test by SPM-PC. Single and double dotted lines linked to SPM{F} and SPM{t} indicate critical RFT threshold of F and Šidák-corrected critical RFT threshold of t.
Figure 6
Figure 6
Results of LOSO-LASSO analysis to determine optimal predictor combination, Mo. (a) Male, (b) female. The upper panels depict the regularization coefficient input into LOSO-LASSO. The middle panels depict the number of predictors output from LOSO-LASSO. The bottom panels depict the ICC(2, 1) values of the models constructed from each predictor combination output from LOSO-LASSO.
Figure 7
Figure 7
Selected IMS predictors for Mo and their corresponding GPCs for male and female subjects. Qt’s are marked as black blocks surrounded by green dashed line frames. Selected GPCs of each type of foot motion are also marked as blocks (male: blue, female: red). Qt: Quadricep-activation %GCs, including %GCs for which only rectus femoris (RF) activated and for both RF and vastus muscles (VAs). LR: loading response; MSt: mid-stance; TSt: terminal stance; PS: pre-swing; IS: initial swing; MSw: mid-swing; TSw: terminal swing; HS: heel strike; TO: toe-off.
Figure 8
Figure 8
Precision evaluation results of gait speed. (a) Agreement plots. (b) BA plots of data in Group I (green) and Group II+III (yellow). PA line: black chained line; ULoA and LLoA: black dashed line; UULoA, LULoA, ULLoA, and LLLoA: black dotted line; fitting proportional bias line: blue dashed line. For data in Group II+III, lower to upper limits of KA, i.e., KA = KALKAU, are depicted in the figure.
Figure 9
Figure 9
(a) HGS estimation agreement plots of males and females by models constructed by predictor combinations of Mo, M1, M2, and M3. Blue and red dots mean data of males and females, and black dashed lines in all panels of (a) mean perfect agreement. “ICC” in figures means ICC value of ICC(2, 1). (b) Bland–Altman plots of Mo case for males and females of Group I. PA line: black chained line; ULoA and LLoA: black dashed line; UULoA, LULoA, ULLoA, and LLLoA: black dotted line; fitting proportional bias line: blue dashed line. (c) Results of HGS estimation model test using data from Group II+III and optimistic agreement interval determined using data from Group I shown in (b). All male subjects belonged to Group III, marked as blue triangles. Lower to upper limits of KA, i.e., KA = KALKAU, are depicted in (c). Black dashed circle in (c) means subjects in Group III who did not agree with the reference data well.
Figure 9
Figure 9
(a) HGS estimation agreement plots of males and females by models constructed by predictor combinations of Mo, M1, M2, and M3. Blue and red dots mean data of males and females, and black dashed lines in all panels of (a) mean perfect agreement. “ICC” in figures means ICC value of ICC(2, 1). (b) Bland–Altman plots of Mo case for males and females of Group I. PA line: black chained line; ULoA and LLoA: black dashed line; UULoA, LULoA, ULLoA, and LLLoA: black dotted line; fitting proportional bias line: blue dashed line. (c) Results of HGS estimation model test using data from Group II+III and optimistic agreement interval determined using data from Group I shown in (b). All male subjects belonged to Group III, marked as blue triangles. Lower to upper limits of KA, i.e., KA = KALKAU, are depicted in (c). Black dashed circle in (c) means subjects in Group III who did not agree with the reference data well.
Figure 10
Figure 10
ICC agreement between three types of performance scores calculated from reference and IMS-estimated values: (a) PHGS, (b) PGS, (c) Pfr. Points in dashed circles mean subjects whose data are outside the agreement interval in Figure 9c (the same data in dashed circles in Figure 9c). Blue points: male subjects. Red points: female subjects.
Figure 11
Figure 11
Correlations between expert-rated score and three types of performance scores calculated from reference value: (a) PHGS, (b) PGS, (c) Pfr. Blue points: male subjects. Red points: female subjects.
Figure 12
Figure 12
Correlations between expert-rated score and three types of performance scores calculated from IMS-estimated value: (a) PHGS, (b) PGS, (c) Pfr. Blue points: male subjects. Red points: female subjects.
Figure 13
Figure 13
Boxplot of expert-rated score in pre-frail and robust groups. Lines in the boxes indicate the median values; crosses in the boxes indicate the mean values of each group. PF: pre-frail, R: robust.
Figure 14
Figure 14
Boxplot of three types of performance scores calculated from IMS-estimated values in pre-frail and robust groups: (a) PHGS, (b) PGS, (c) Pfr. The green dot in (a) means the outlier point (values exceeding 1.5 times the interquartile range are displayed as outliers). Lines in the boxes indicate the median values; crosses in the boxes indicate the mean values of each group. PF: pre-frail, R: robust.
Figure 15
Figure 15
Gait motion of early and late initial swing phase. Spring mark means rectus femoris. Red lines mean segments of lower limbs. Gray dashed line means original position of each segment. Red circles mean approximate position of knee and ankle joints. Orange dashed line means central line of body. Black bold point means approximate position of hip joint. Blue arrow means rotational motion direction, which increases angular velocity in dorsiflexion direction on IMS. Yellow arrow means rotational motion direction, which decreases angular velocity in dorsiflexion direction on IMS. Green line arrow means direction of gravity, and green dashed arrow means projection of gravity vector in direction perpendicular to segment of lower leg.

References

    1. Janssen I., Heymsfield S.B., Wang Z.M., Ross R. Skeletal muscle mass and distribution in 468 men and women aged 18–88 yr. J. Appl. Physiol. 2000;89:81–88. doi: 10.1152/jappl.2000.89.1.81. - DOI - PubMed
    1. Fritz S., Lusardi M. White paper: “walking speed: The sixth vital sign”. [(accessed on 6 June 2023)];J. Geriatr. Phys. Ther. 2009 32:2–5. doi: 10.1519/00139143-200932020-00002. Available online: https://digitalcommons.sacredheart.edu/cgi/viewcontent.cgi?article=1134&.... - DOI - PubMed
    1. Sialino L.D., Schaap L.A., van Oostrom S.H., Picavet H.S.J., Twisk J.W., Verschuren W., Visser M., Wijnhoven H.A. The sex difference in gait speed among older adults: How do sociodemographic, lifestyle, social and health determinants contribute? BMC Geriatr. 2021;21:340. doi: 10.1186/s12877-021-02279-7. - DOI - PMC - PubMed
    1. Janssen I., Heymsfield S.B., Ross R. Low relative skeletal muscle mass (sarcopenia) in older persons is associated with functional impairment and physical disability. J. Am. Geriatr. Soc. 2002;50:889–896. doi: 10.1046/j.1532-5415.2002.50216.x. - DOI - PubMed
    1. Cesari M., Landi F., Vellas B., Bernabei R., Marzetti E. Sarcopenia and physical frailty: Two sides of the same coin. Front. Aging Neurosci. 2014;6:192. doi: 10.3389/fnagi.2014.00192. - DOI - PMC - PubMed

LinkOut - more resources