

A Hierarchical Siamese Network for Noninvasive Staging of Liver Fibrosis Based on US Image Pairs of the Liver and Spleen
- PMID: 37420617
- PMCID: PMC10302592
- DOI: 10.3390/s23125450
A Hierarchical Siamese Network for Noninvasive Staging of Liver Fibrosis Based on US Image Pairs of the Liver and Spleen
Abstract
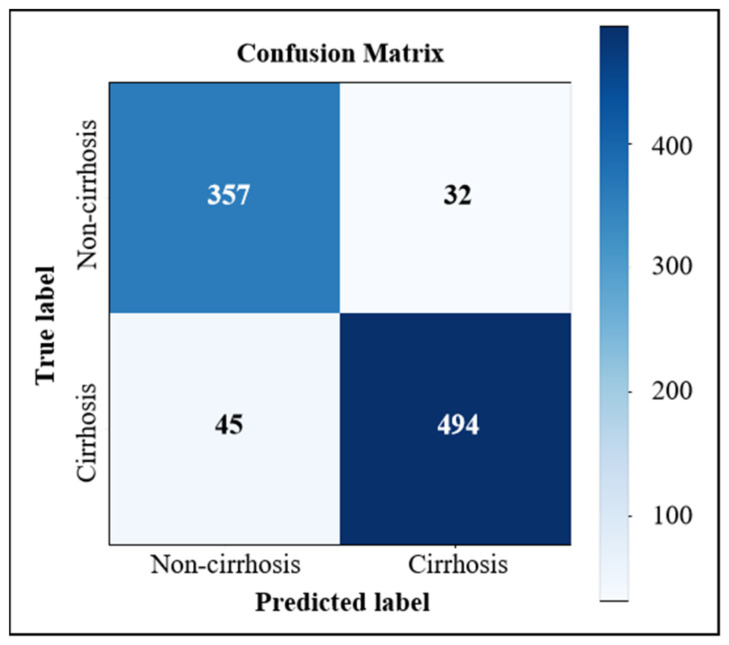
Due to the heterogeneity of ultrasound (US) images and the indeterminate US texture of liver fibrosis (LF), automatic evaluation of LF based on US images is still challenging. Thus, this study aimed to propose a hierarchical Siamese network that combines the information from liver and spleen US images to improve the accuracy of LF grading. There were two stages in the proposed method. In stage one, a dual-channel Siamese network was trained to extract features from paired liver and spleen patches that were cropped from US images to avoid vascular interferences. Subsequently, the L1 distance was used to quantify the liver-spleen differences (LSDs). In stage two, the pretrained weights from stage one were transferred into the Siamese feature extractor of the LF staging model, and a classifier was trained using the fusion of the liver and LSD features for LF staging. This study was retrospectively conducted on US images of 286 patients with histologically proven liver fibrosis stages. Our method achieved a precision and sensitivity of 93.92% and 91.65%, respectively, for cirrhosis (S4) diagnosis, which is about 8% higher than that of the baseline model. The accuracy of the advanced fibrosis (≥S3) diagnosis and the multi-staging of fibrosis (≤S2 vs. S3 vs. S4) both improved about 5% to reach 90.40% and 83.93%, respectively. This study proposed a novel method that combined hepatic and splenic US images and improved the accuracy of LF staging, which indicates the great potential of liver-spleen texture comparison in noninvasive assessment of LF based on US images.
Keywords: Siamese network; US images; liver fibrosis; liver–spleen texture comparison.
Conflict of interest statement
The authors declare no conflict of interest.
Figures


Similar articles
-
Noninvasive assessment of liver fibrosis with acoustic radiation force impulse imaging: increased liver and splenic stiffness in patients with liver fibrosis and cirrhosis.Ultraschall Med. 2011 Apr;32(2):160-6. doi: 10.1055/s-0029-1245807. Epub 2010 Nov 23. Ultraschall Med. 2011. PMID: 21104600
-
Imaging-Based Staging of Hepatic Fibrosis in Patients with Hepatitis B: A Dynamic Radiomics Model Based on Gd-EOB-DTPA-Enhanced MRI.Biomolecules. 2021 Feb 18;11(2):307. doi: 10.3390/biom11020307. Biomolecules. 2021. PMID: 33670596 Free PMC article.
-
Transfer learning radiomics based on multimodal ultrasound imaging for staging liver fibrosis.Eur Radiol. 2020 May;30(5):2973-2983. doi: 10.1007/s00330-019-06595-w. Epub 2020 Jan 21. Eur Radiol. 2020. PMID: 31965257 Free PMC article.
-
Comparison of laboratory tests, ultrasound, or magnetic resonance elastography to detect fibrosis in patients with nonalcoholic fatty liver disease: A meta-analysis.Hepatology. 2017 Nov;66(5):1486-1501. doi: 10.1002/hep.29302. Epub 2017 Sep 26. Hepatology. 2017. PMID: 28586172 Review.
-
Multidetector Computed Tomography for Retrospective, Noninvasive Staging of Liver Fibrosis.Gastroenterol Clin North Am. 2018 Sep;47(3):569-584. doi: 10.1016/j.gtc.2018.04.012. Epub 2018 Jul 7. Gastroenterol Clin North Am. 2018. PMID: 30115438 Review.
References
MeSH terms
Grants and funding
LinkOut - more resources
Full Text Sources
