. 2023 Jun 9;23(12):5454.
doi: 10.3390/s23125454.

Naturalistic Hyperscanning with Wearable Magnetoencephalography

Affiliations

Naturalistic Hyperscanning with Wearable Magnetoencephalography

Niall Holmes et al. Sensors (Basel). .

Abstract

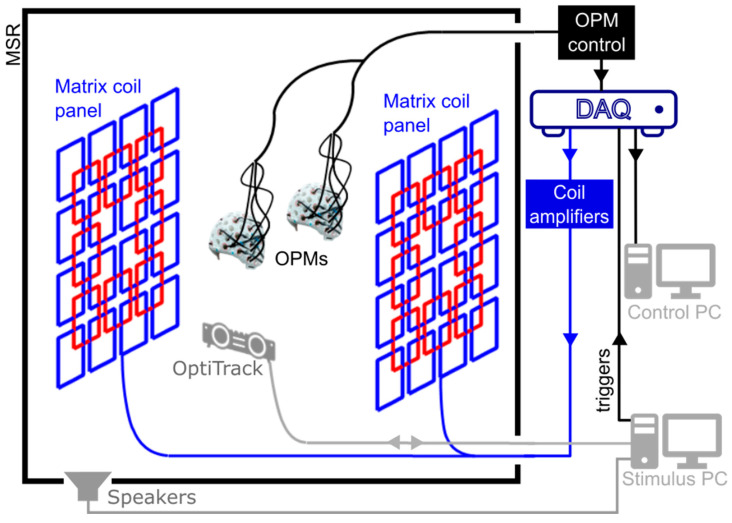
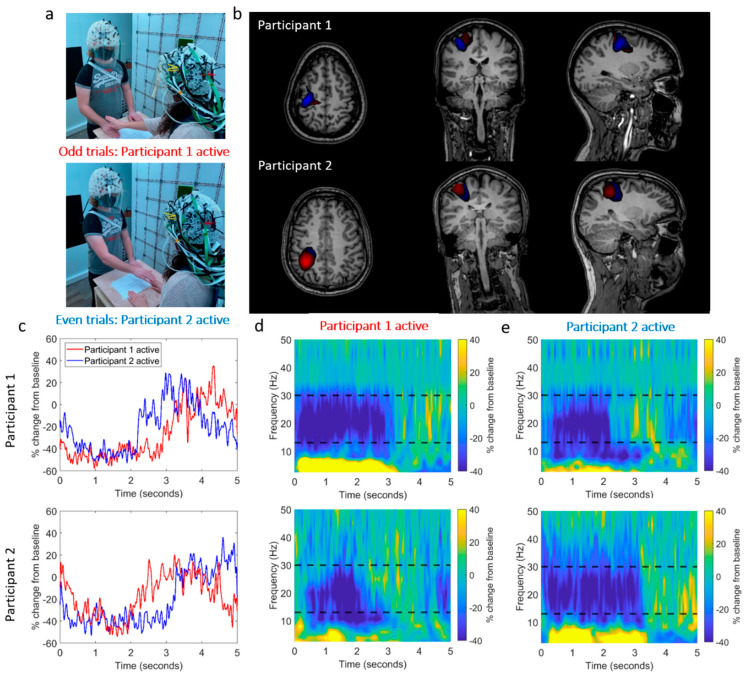
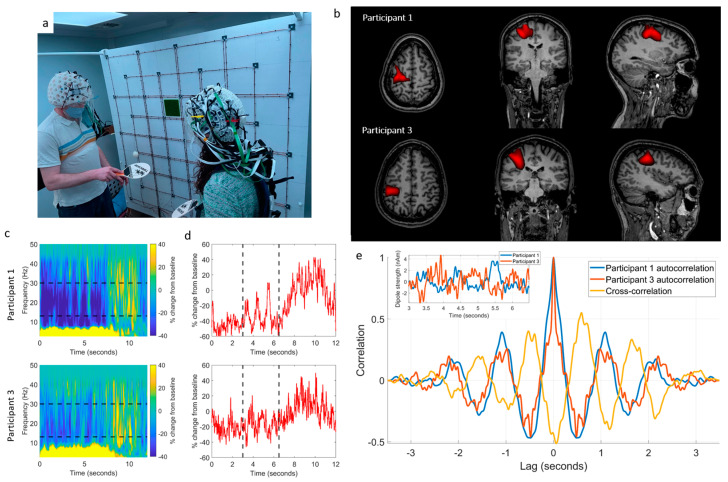
The evolution of human cognitive function is reliant on complex social interactions which form the behavioural foundation of who we are. These social capacities are subject to dramatic change in disease and injury; yet their supporting neural substrates remain poorly understood. Hyperscanning employs functional neuroimaging to simultaneously assess brain activity in two individuals and offers the best means to understand the neural basis of social interaction. However, present technologies are limited, either by poor performance (low spatial/temporal precision) or an unnatural scanning environment (claustrophobic scanners, with interactions via video). Here, we describe hyperscanning using wearable magnetoencephalography (MEG) based on optically pumped magnetometers (OPMs). We demonstrate our approach by simultaneously measuring brain activity in two subjects undertaking two separate tasks-an interactive touching task and a ball game. Despite large and unpredictable subject motion, sensorimotor brain activity was delineated clearly, and the correlation of the envelope of neuronal oscillations between the two subjects was demonstrated. Our results show that unlike existing modalities, OPM-MEG combines high-fidelity data acquisition and a naturalistic setting and thus presents significant potential to investigate neural correlates of social interaction.

Keywords: electromagnetic coil; hyperscanning; magnetic shielding; magnetoencephalography; on-scalp MEG; optically pumped magnetometer.


Conflict of interest statement

E.B. and M.J.B. are directors of Cerca Magnetics Limited, a spin-out company whose aim is to commercialise aspects of OPM-MEG technology. E.B., M.J.B., R.B., N.H. and R.H. hold founding equity in Cerca Magnetics Limited, and R.B., N.H. and R.H. sit on the scientific advisory board. M.R. is an employee of Cerca Magnetics Limited. V.S. is the founding director of QuSpin Inc., a commercial entity selling the OPM magnetometers used in this work. J.O. is an employee of QuSpin Inc. N.H, M.J.B. and R.B. declare that they have a patent pending to the UK Government Intellectual Property Office (Application No. GB2109459.4) regarding the multi-coil active magnetic shielding systems described in this work. T.M.F, M.J.B. and R.B. declare that they have a worldwide patent (WIPO Patent Application WO/2021/053356) regarding related electromagnetic coil design techniques. The remaining authors J.L., L.J.E., P.G. and P.R.M. declare no competing interest.

Figures

Figure 1
Figure 1
A schematic representation of the OPM-MEG system. The system is housed in a magnetically shielded room (MSR). OPMs are interfaced with a series of data acquisition devices. Data from the OPMs are used to drive the matrix coil field nulling process, before an MEG recording begins. Optical tracking of the helmets is performed to monitor motion during a session. Instruction is passed to the participants via auditory cues controlled using a separate stimulus PC.
Figure 2
Figure 2
The position and orientation of the OPMs used in each experiment. Sensors that were used to inform the field nulling are shown in blue and additional sensors are shown in red. OPMs were concentrated over the left sensorimotor cortex, with additional sensors placed at the right and the front of the head, to inform the nulling process. (a) Sensor layout for Participant 1 during the two-person touch and ball game tasks. (b) Sensor layout for Participant 2 during the two-person touching task. (c) Sensor layout for Participant 3 during the two-person ball game.
Figure 3
Figure 3
Effect of field nulling. (a) The strength of the DC field, reported by the 48 total field measurements from 24 OPMs (12 per participant), with and without the matrix coils active, during the 2-person touch task. The error bars show standard errors across sensors. (b) Equivalent to (a) for the 2-person ball game.
Figure 4
Figure 4
OPM-MEG data collected during a two-person naturalistic touching experiment. (a) Two participants stood on either side of a table. In odd-numbered trials, Participant 1 strokes the right hand of Participant 2, with their right hand. In even-numbered trials, the roles are reversed. (b) Beamformer images show the spatial signature of beta band modulation (thresholded to 80% of the maximum value). The odd trials (Participant 1 active) are shown in red and the even trials (Participant 2 active) are shown in blue. The spatial pattern suggests activity in the sensorimotor regions. (Note that there is a large overlap, so the blue overlay is partially obscured). (c) Timecourses showing the trial-averaged envelope of beta oscillations, extracted from the left sensorimotor cortex (peak in the beamformer images). Data from Participants 1 and 2 are shown in the top and bottom rows, respectively. In both cases, the red trace shows data recorded when Participant 1 was touching Participant 2. Similarly, (d,e) show time-frequency spectra of virtual electrodes at the peak of the beamformer images for each participant for both cases. Black dashed lines show the beta band.
Figure 5
Figure 5
OPM-MEG data collected during a two-person ball game. (a) Two participants each held a table-tennis bat in their right hand and hit the ball back and forth to each other; a 5 s rally was followed by 7 s rest. (b) Beamformer images of beta band modulation between task and rest (thresholded to 70% of the maximum value). The spatial pattern suggests beta power reduction in the sensorimotor regions during the rally. (c) Time–frequency spectrograms were extracted from the left sensorimotor cortex for Participant 1 (top) and Participant 3 (bottom). Black dashed lines show the beta band. (d) Timecourses of the envelope of beta band activity (again Participant 1 top, and Participant 3 bottom). Data suggest anti-correlation between 3 and 6.5 s (marked with black dashed lines). (e) Inset: the timecourses extracted in the 3–6.5 s window and overlaid. Main: comparison of the autocorrelations of the two extracted timecourses (blue/red) with their cross-correlation (yellow) reveals anti-correlation with a lag of ~0.6 s between the participant’s brain activity. The photographs shown are of the authors.

References

    1. Hari R., Henriksson L., Malinen S., Parkkonen L. Centrality of Social Interaction in Human Brain Function. Neuron. 2015;88:181–193. doi: 10.1016/j.neuron.2015.09.022. - DOI - PubMed
    1. Hari R., Kujala M.V. Brain Basis of Human Social Interaction: From Concepts to Brain Imaging. Physiol. Rev. 2009;89:453–479. doi: 10.1152/physrev.00041.2007. - DOI - PubMed
    1. Czeszumski A., Eustergerling S., Lang A., Menrath D., Gerstenberger M., Schuberth S., Schreiber F., Rendon Z.Z., König P. Hyperscanning: A Valid Method to Study Neural Inter-Brain Underpinnings of Social Interaction. Front. Hum. Neurosci. 2020;14:39. doi: 10.3389/fnhum.2020.00039. - DOI - PMC - PubMed
    1. Renvall V., Kauramäki J., Malinen S., Hari R., Nummenmaa L. Imaging Real-Time Tactile Interaction with Two-Person Dual-Coil FMRI. Front. Psychiatry. 2020;11:279. doi: 10.3389/fpsyt.2020.00279. - DOI - PMC - PubMed
    1. Lee R.F., Dai W., Jones J. Decoupled Circular-Polarized Dual-Head Volume Coil Pair for Studying Two Interacting Human Brains with Dyadic FMRI. Magn. Reson. Med. 2012;68:1087–1096. doi: 10.1002/mrm.23313. - DOI - PubMed

LinkOut - more resources