. 2023 Jun 16;23(12):5635.
doi: 10.3390/s23125635.

Toward Improvements in Pressure Measurements for Near Free-Field Blast Experiments

Affiliations

Toward Improvements in Pressure Measurements for Near Free-Field Blast Experiments

Maylis Lavayssière et al. Sensors (Basel). .

Abstract

This paper proposes two ways to improve pressure measurement in air-blast experimentations, mostly for close-in detonations defined by a small-scaled distance below 0.4 m.kg-1/3. Firstly, a new kind of custom-made pressure probe sensor is presented. The transducer is a piezoelectric commercial, but the tip material has been modified. The dynamic response of this prototype is established in terms of time and frequency responses, both in a laboratory environment, on a shock tube, and in free-field experiments. The experimental results show that the modified probe can meet the measurement requirements of high-frequency pressure signals. Secondly, this paper presents the initial results of a deconvolution method, using the pencil probe transfer function determination with a shock tube. We demonstrate the method on experimental results and draw conclusions and prospects.

Keywords: blast experiment; close-in detonation; deconvolution; dynamic calibration; metrology; near-field experimentation; pressure sensors; shock tube; transfer function.


Conflict of interest statement

The authors declare no conflict of interest.

Figures

Figure 1
Figure 1
(a) Drawing of a PCB Piezotronic 137A22 with the replacement tip zone colored in blue. Dimensional values are given in inch and (mm) [15]. (b) Photograph of the 137A22 probes tested in this paper with a short blue plastic tip. (c) Drawing of a PCB Piezotronic 137B27. Dimensional values are given in inch and (mm) [15]. (d) Photograph of the 137B27 probe, showing its greater length regarding the 137A22 probe, and modified 137A22 with long blue plastic tip. In both sketches and photographs, the red zone shows the sensing element of interest in this paper, on the unique transducer element of the 137A22 probe and the rear element of the 137B27 probe.
Figure 2
Figure 2
Schematic representation of a measurement chain with cable lengths used in blast free-field campaign.
Figure 3
Figure 3
S21 parameter module determined by a vector network analyzer in “Full 2 Ports” configuration to characterize the loss of the coaxial measurement chain for an input impedance of (a) 50 Ω (experimental data) and (b) 1 MΩ (deduced after (a) measurements), in blue before the beginning of the campaign and in orange, at the end.
Figure 4
Figure 4
(a) Experimental free-field scene. (b) Schematic representation of free-field blast sensor installation: the positions of the pencil probes around the charge (red circle) are marked. The identification of the four probes of interest, whose details are given in Table 4, is marked by colored squares.
Figure 5
Figure 5
(a) Example of raw pressure measurement for 2.459 kg of composition 2 on pencil probe sensors at different Z ranges. (b) Example of raw pressure measurement for 1.639 kg of composition 1 on pencil probe sensors at different Z ranges. The pressure measurements by the three sensors of interest in this paper are visible. The signal’s shape is a Friedlander-Type, as expected from a dynamic measurement of blast pressure.
Figure 6
Figure 6
The shock tube experiment in the initial state and after the diaphragm burst: (a) wave diagram and (b) pressure and temperature evolution with respect to time and distance within the tube. The circled numbers show the different states of the gases defined in the shock tube theory.
Figure 7
Figure 7
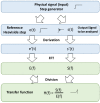
Schematic principle of the influence of the measurement chain transfer function h(t) on a signal e(t) to be measured, leading to the recording of the output s(t).
Figure 8
Figure 8
Process leading to the transfer function determination of a measurement chain.
Figure 9
Figure 9
Example of pressure steps measured by a 137B27 pencil probe in the shock tube: P2 for incident shock, P5 for reflection shock. The zone of interest is highlighted by the dashed zone: P2 (red) and reference Heaviside step estimation (dot line in light blue), which will be the reference for the transfer function calculation in incident configuration.
Figure 10
Figure 10
Transfer function comparison for piezoelectric probe sensors: 137A22 (red), 137B27 rear (green) for a pressure step of 15 bar. The ± 3dB zone is delimited by horizontal black-dot lines.
Figure 11
Figure 11
Transfer function of the pencil probe 137A22: the commercial one (red) and two pencils with modified tips, short (light blue), and long (dark blue). The ±3dB zone is delimited by horizontal black dot lines.
Figure 12
Figure 12
(a) Pressure measurement of two probes with 2.459 kg of composition 1, located at the same distance from the center of the charge (~1 m): one commercial 137B27 (green) and the plastic-tip custom one 137A22 (blue). (b) Zoom on the signal noise before the arrival of the shock wave (yellow dashed zone visible in (a)). (c) Zoom on the pressure rise region (red dashed zone visible in (a)).
Figure 13
Figure 13
Experimental pressure measurements in the frequency domain for the 137A22 probe with the optimized tip. The colors correspond to the four experiments performed, characterized by the Z factor.
Figure 14
Figure 14
Process leading to the deconvolution of an experimental signal with the transfer function of a previously determined measurement chain.
Figure 15
Figure 15
Experimental pressure-time profile obtained from near-field experimentation: (a) raw measurement (grey) of a 137B28 probe sensor located at 0.55 m from the center of the charge (Z = 0.41 m.kg−1/3), and its deconvolution (in gain only) in blue. The red curve estimates the Friedlander fit of the pressure decay to determine the overpressure peak. (b) Details of the Friedlander fit (red) presented in (a) are deduced from the raw data (grey).
Figure 16
Figure 16
Spectra of the pressure measurement presented in Figure 15: raw measurement of the 137B28 probe sensor (grey), and deconvoluted measurement (blue).

References

    1. Walter P.L. Air-blast and the science of dynamic pressure measurements. Sound Vib. 2004;38:10–17.
    1. Lukić S., Draganić H., Gazić G., Radić I. Statistical analysis of blast wave decay coefficient and maximum pressure based on experimental results; Proceedings of the RISK/SAFE 2022; Rome, Italy. 12–14 October 2022; pp. 65–78.
    1. Silver P.L. Blast Overpressure Measurement for CFD Model Validation in the Development of Large Caliber Gun Systems. U.S. Army Aberdeen Test Center, Ballistics Instrumentation; Aberdeen, MD, USA: 2006.
    1. Showalter B. Utilization of Pencil Probes in Blast Experiments for the Explosive Effects Branch. DEVCOM Army Research Laboratory; Adelphi, MD, USA: 2020.
    1. Dvořák P., Hejmal Z., Dubec B., Holub J. Use of Pencil Probes for Blast Pressure Measurement; Proceedings of the 2021 International Conference on Military Technologies (ICMT); Brno, Czech Republic. 8–11 June 2021; pp. 1–4.