

Design and Development of a Traveling Wave Ferro-Microfluidic Device and System Rig for Potential Magnetophoretic Cell Separation and Sorting in a Water-Based Ferrofluid
- PMID: 37421122
- PMCID: PMC10145302
- DOI: 10.3390/mi14040889
Design and Development of a Traveling Wave Ferro-Microfluidic Device and System Rig for Potential Magnetophoretic Cell Separation and Sorting in a Water-Based Ferrofluid
Abstract
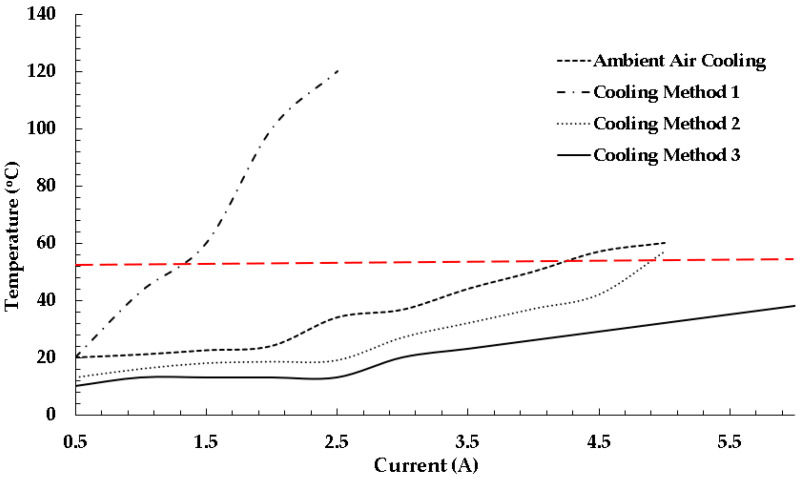
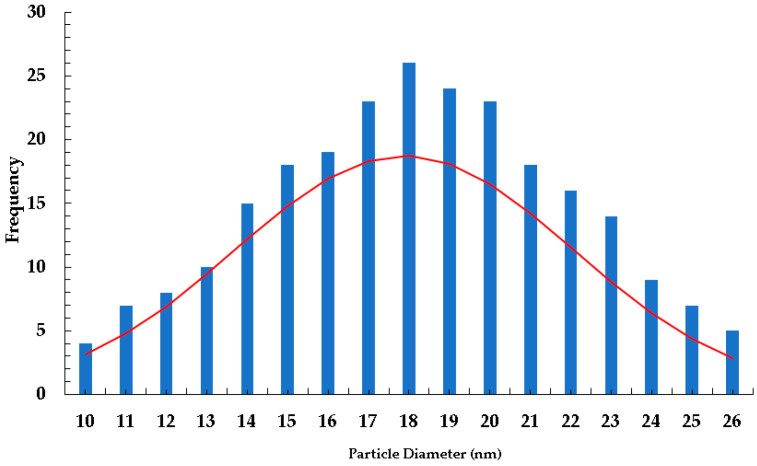
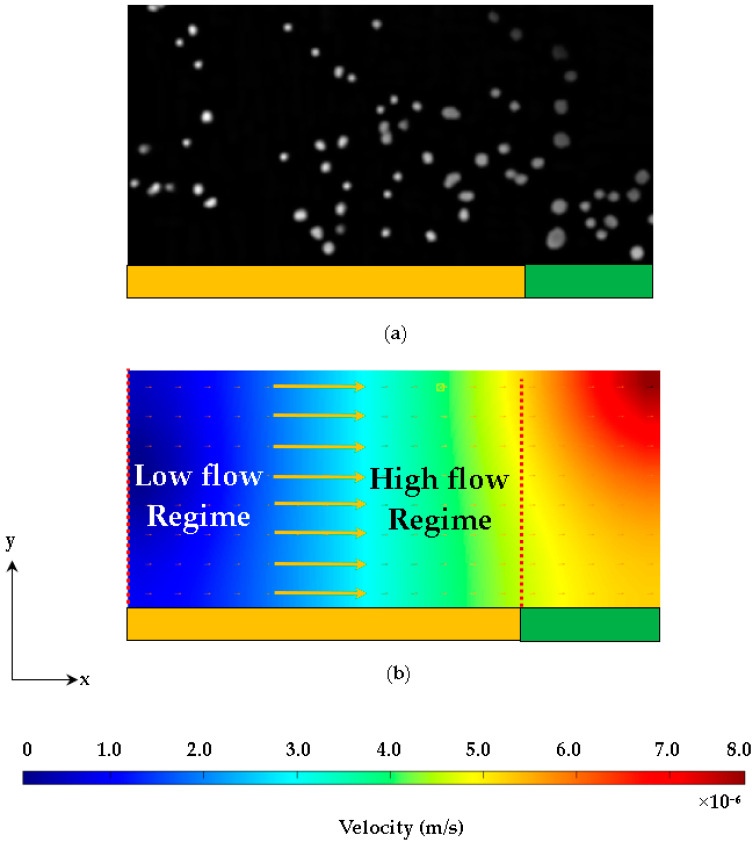
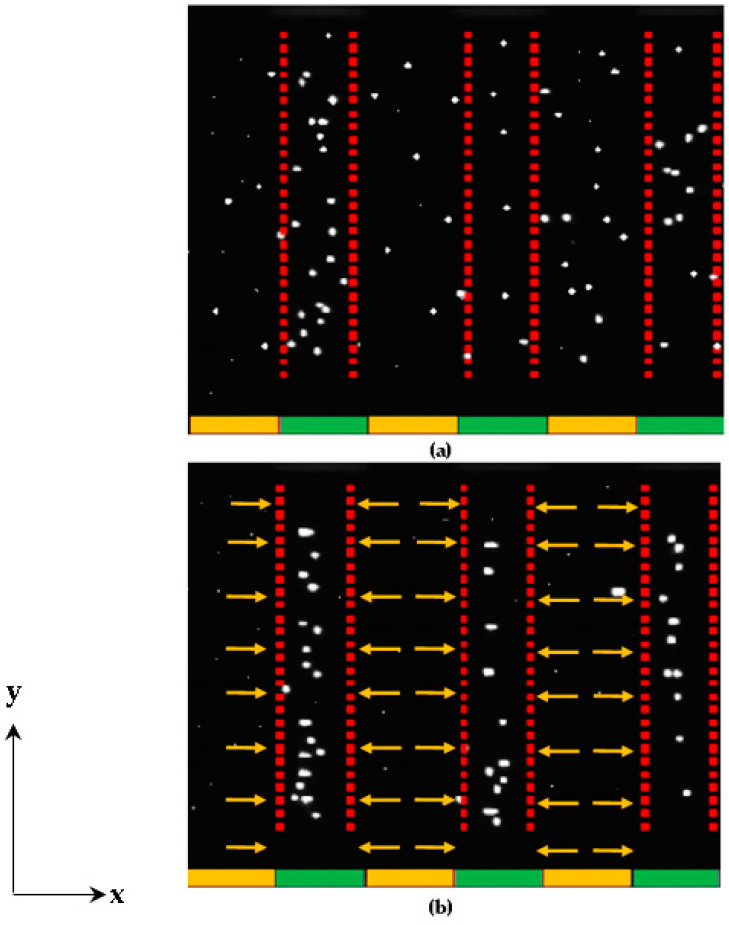
The timely detection and diagnosis of diseases and accurate monitoring of specific genetic conditions require rapid and accurate separation, sorting, and direction of target cell types toward a sensor device surface. In that regard, cellular manipulation, separation, and sorting are progressively finding application potential within various bioassay applications such as medical disease diagnosis, pathogen detection, and medical testing. The aim of this paper is to present the design and development of a simple traveling wave ferro-microfluidic device and system rig purposed for the potential manipulation and magnetophoretic separation of cells in water-based ferrofluids. This paper details in full: (1) a method for tailoring cobalt ferrite nanoparticles for specific diameter size ranges (10-20 nm), (2) the development of a ferro-microfluidic device for potentially separating cells and magnetic nanoparticles, (3) the development of a water-based ferrofluid with magnetic nanoparticles and non-magnetic microparticles, and (4) the design and development of a system rig for producing the electric field within the ferro-microfluidic channel device for magnetizing and manipulating nonmagnetic particles in the ferro-microfluidic channel. The results reported in this work demonstrate a proof of concept for magnetophoretic manipulation and separation of magnetic and non-magnetic particles in a simple ferro-microfluidic device. This work is a design and proof-of-concept study. The design reported in this model is an improvement over existing magnetic excitation microfluidic system designs in that heat is efficiently removed from the circuit board to allow a range of input currents and frequencies to manipulate non-magnetic particles. Although this work did not analyze the separation of cells from magnetic particles, the results demonstrate that non-magnetic (surrogates for cellular materials) and magnetic entities can be separated and, in some cases, continuously pushed through the channel based on amperage, size, frequency, and electrode spacing. The results reported in this work establish that the developed ferro-microfluidic device may potentially be used as an effective platform for microparticle and cellular manipulation and sorting.
Keywords: cellular; circuit board; design; diagnosis; diseases; ferro-microfluidic; ferrofluid; frequency; heat; magnetic; manipulation; medical; non-magnetic; separation; traveling wave.
Conflict of interest statement
The authors declare no conflict of interest.
Figures


Similar articles
-
Label-free separation of nanoscale particles by an ultrahigh gradient magnetic field in a microfluidic device.Nanoscale. 2021 Feb 25;13(7):4029-4037. doi: 10.1039/d0nr08383f. Nanoscale. 2021. PMID: 33533377
-
Multiphase ferrofluid flows for micro-particle focusing and separation.Biomicrofluidics. 2016 May 5;10(3):034101. doi: 10.1063/1.4948656. eCollection 2016 May. Biomicrofluidics. 2016. PMID: 27190567 Free PMC article.
-
A novel viscoelastic-based ferrofluid for continuous sheathless microfluidic separation of nonmagnetic microparticles.Lab Chip. 2016 Oct 5;16(20):3947-3956. doi: 10.1039/c6lc01007e. Lab Chip. 2016. PMID: 27722618
-
[Research progress in the application of external field separation technology and microfluidic technology in the separation of micro/nanoscales].Se Pu. 2021 Nov;39(11):1157-1170. doi: 10.3724/SP.J.1123.2020.12032. Se Pu. 2021. PMID: 34677011 Free PMC article. Review. Chinese.
-
Recent microfluidic advances in submicron to nanoparticle manipulation and separation.Lab Chip. 2023 Mar 1;23(5):982-1010. doi: 10.1039/d2lc00793b. Lab Chip. 2023. PMID: 36367456 Review.
Cited by
-
Using SMART Magnetic Fluids and Gels for Prevention and Destruction of Bacterial Biofilms.Microorganisms. 2023 Jun 7;11(6):1515. doi: 10.3390/microorganisms11061515. Microorganisms. 2023. PMID: 37375017 Free PMC article.
-
Predictive Modeling and Experimental Validation of Magnetophoretic Delivery of Magnetic Nanocultures.ACS Mater Lett. 2025 Jun 25;7(7):2679-2685. doi: 10.1021/acsmaterialslett.5c00753. eCollection 2025 Jul 7. ACS Mater Lett. 2025. PMID: 40641610 Free PMC article.
-
Digital Magnetic Sorting for Fractionating Cell Populations with Variable Antigen Expression in Cell Therapy Process Development.Magnetochemistry. 2024 Nov;10(11):81. doi: 10.3390/magnetochemistry10110081. Epub 2024 Oct 23. Magnetochemistry. 2024. PMID: 40822566 Free PMC article.
-
Numerical Solution of the Electric Field and Dielectrophoresis Force of Electrostatic Traveling Wave System.Micromachines (Basel). 2023 Jun 30;14(7):1347. doi: 10.3390/mi14071347. Micromachines (Basel). 2023. PMID: 37512658 Free PMC article.
-
Computational Assessment of Unsteady Flow Effects on Magnetic Nanoparticle Targeting Efficiency in a Magnetic Stented Carotid Bifurcation Artery.Cardiovasc Eng Technol. 2023 Oct;14(5):694-712. doi: 10.1007/s13239-023-00681-3. Epub 2023 Sep 18. Cardiovasc Eng Technol. 2023. PMID: 37723333
References
-
- Dielectrophoresis H.P. The Behavior of Neutral Matter in Non-Uniform Electric Field. Cambridge University Press; Cambridge, UK: 1978.
LinkOut - more resources
Full Text Sources
