

An anoikis-based gene signature for predicting prognosis in malignant pleural mesothelioma and revealing immune infiltration
- PMID: 37421452
- PMCID: PMC11796784
- DOI: 10.1007/s00432-023-05128-9
An anoikis-based gene signature for predicting prognosis in malignant pleural mesothelioma and revealing immune infiltration
Abstract
Introduction: Malignant pleural mesothelioma (MPM) is an aggressive, treatment-resistant tumor. Anoikis is a particular type of programmed apoptosis brought on by the separation of cell-cell or extracellular matrix (ECM). Anoikis has been recognized as a crucial element in the development of tumors. However, few studies have comprehensively examined the role of anoikis-related genes (ARGs) in malignant mesothelioma.
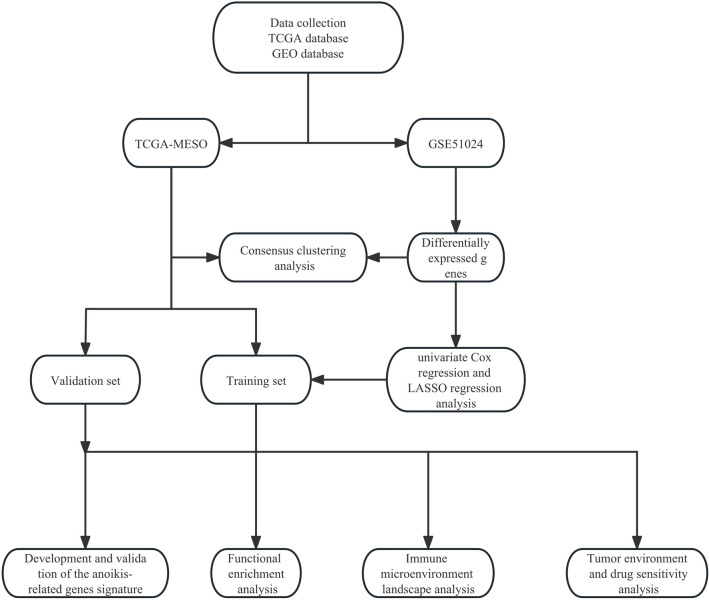
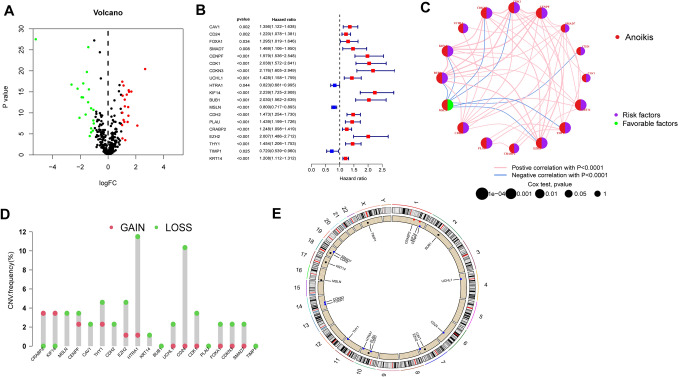
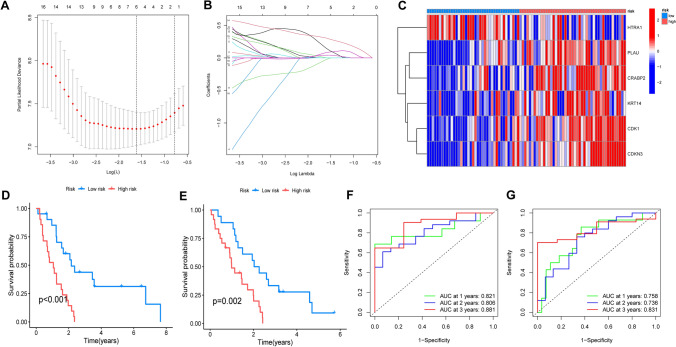
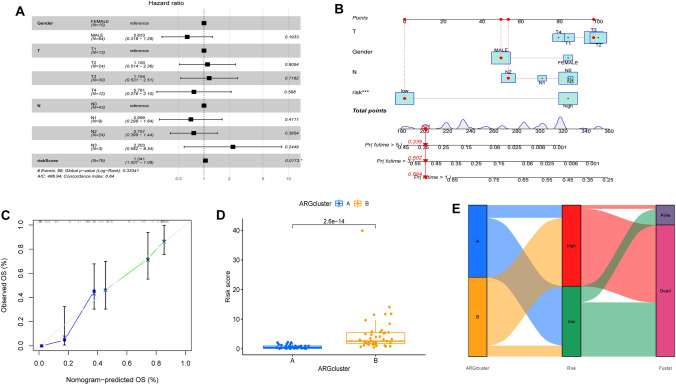
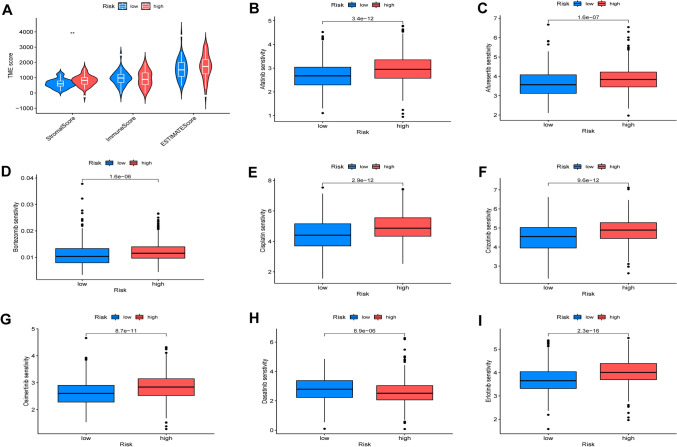
Methods: ARGs were gathered from the GeneCard database and the Harmonizome portals. We obtained differentially expressed genes (DEGs) using the GEO database. Univariate Cox regression analysis, and the least absolute shrinkage and selection operator (LASSO) algorithm were utilized to select ARGs associated with the prognosis of MPM. We then developed a risk model, and time-dependent receiver operating characteristic (ROC) analysis and calibration curves were employed to confirm the ability of the model. The patients were divided into various subgroups using consensus clustering analysis. Based on the median risk score, patients were divided into low- and high-risk groups. Functional analysis and immune cell infiltration analysis were conducted to estimate molecular mechanisms and the immune infiltration landscape of patients. Finally, drug sensitivity analysis and tumor microenvironment landscape were further explored.
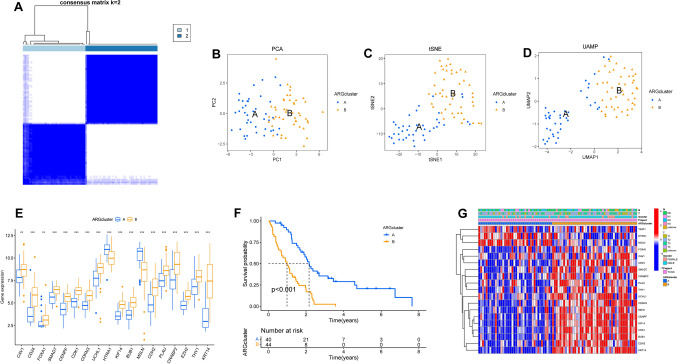
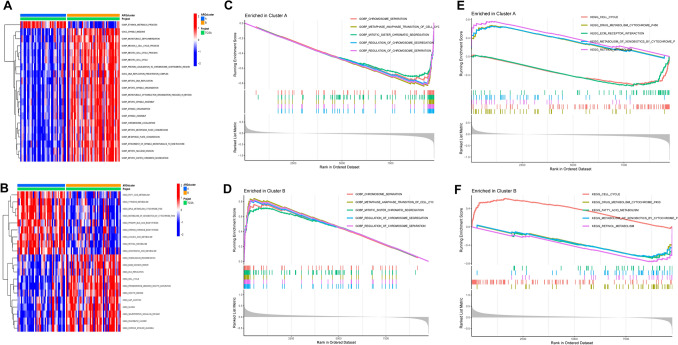
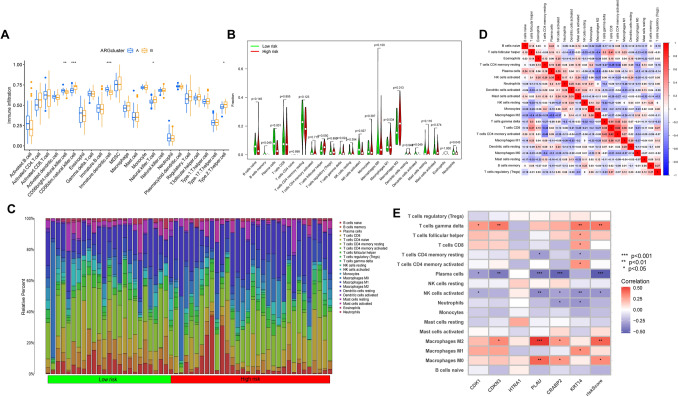
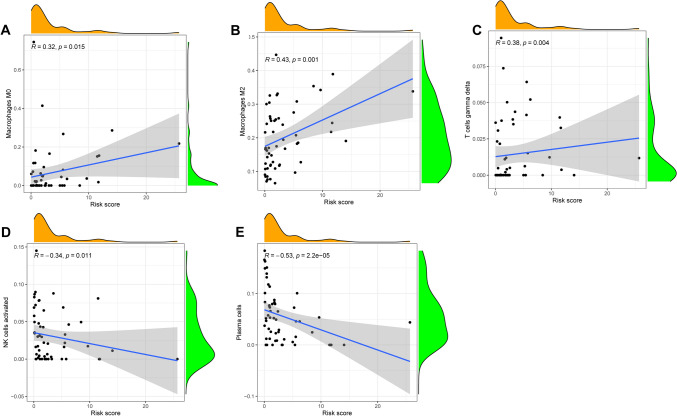
Results: A novel risk model was constructed based on the six ARGs. The patients were successfully divided into two subgroups by consensus clustering analysis, with a striking difference in the prognosis and landscape of immune infiltration. The Kaplan-Meier survival analysis indicated that the OS rate of the low-risk group was significantly higher than the high-risk group. Functional analysis, immune cell infiltration analysis, and drug sensitivity analysis showed that high- and low-risk groups had different immune statuses and drug sensitivity.
Conclusions: In summary, we developed a novel risk model to predict MPM prognosis based on six selected ARGs, which could broaden comprehension of personalized and precise therapy approaches for MPM.
Keywords: Anoikis; Immune infiltration landscape; Malignant pleural mesothelioma; Prognosis; Risk model.
© 2023. The Author(s), under exclusive licence to Springer-Verlag GmbH Germany, part of Springer Nature.
Conflict of interest statement
The authors declare no potential conflicts of interest.
Figures
Similar articles
-
Characterization of novel anoikis-related genes as prognostic biomarkers and key determinants of the immune microenvironment in esophageal cancer.Front Immunol. 2025 Jul 11;16:1599171. doi: 10.3389/fimmu.2025.1599171. eCollection 2025. Front Immunol. 2025. PMID: 40746552 Free PMC article.
-
Identification and verification of a novel anoikis-related gene signature with prognostic significance in clear cell renal cell carcinoma.J Cancer Res Clin Oncol. 2023 Oct;149(13):11661-11678. doi: 10.1007/s00432-023-05012-6. Epub 2023 Jul 5. J Cancer Res Clin Oncol. 2023. PMID: 37402968 Free PMC article.
-
Anoikis-related lncRNA signature predicts prognosis and is associated with immune infiltration in hepatocellular carcinoma.Anticancer Drugs. 2024 Jun 1;35(5):466-480. doi: 10.1097/CAD.0000000000001589. Epub 2024 Mar 11. Anticancer Drugs. 2024. PMID: 38507233
-
Signs and symptoms to determine if a patient presenting in primary care or hospital outpatient settings has COVID-19.Cochrane Database Syst Rev. 2022 May 20;5(5):CD013665. doi: 10.1002/14651858.CD013665.pub3. Cochrane Database Syst Rev. 2022. PMID: 35593186 Free PMC article.
-
Cost-effectiveness of using prognostic information to select women with breast cancer for adjuvant systemic therapy.Health Technol Assess. 2006 Sep;10(34):iii-iv, ix-xi, 1-204. doi: 10.3310/hta10340. Health Technol Assess. 2006. PMID: 16959170
Cited by
-
Mesothelioma survival prediction based on a six-gene transcriptomic signature.iScience. 2024 Sep 23;27(10):111011. doi: 10.1016/j.isci.2024.111011. eCollection 2024 Oct 18. iScience. 2024. PMID: 39474071 Free PMC article.
-
Anoikis in cell fate, physiopathology, and therapeutic interventions.MedComm (2020). 2024 Sep 15;5(10):e718. doi: 10.1002/mco2.718. eCollection 2024 Oct. MedComm (2020). 2024. PMID: 39286778 Free PMC article. Review.
-
CD312 Promotes Paediatric Acute Lymphoblastic Leukaemia Through GNA15-Mediated Non-Classical GPCR Signalling Pathway.J Cell Mol Med. 2024 Dec;28(23):e70283. doi: 10.1111/jcmm.70283. J Cell Mol Med. 2024. PMID: 39656442 Free PMC article.
References
-
- Amoedo ND, Rodrigues MF, Rumjanek FD (2014) Mitochondria: are mitochondria accessory to metastasis? Int J Biochem Cell Biol 51:53–57. 10.1016/j.biocel.2014.03.009 - PubMed
MeSH terms
LinkOut - more resources
Full Text Sources
