. 2023 Jul 25;42(7):112771.
doi: 10.1016/j.celrep.2023.112771. Epub 2023 Jul 7.

A circuit from the locus coeruleus to the anterior cingulate cortex modulates offspring interactions in mice

Affiliations

A circuit from the locus coeruleus to the anterior cingulate cortex modulates offspring interactions in mice

Alberto Corona et al. Cell Rep. .

Abstract

Social sensitivity to other individuals in distress is crucial for survival. The anterior cingulate cortex (ACC) is a structure involved in making behavioral choices and is influenced by observed pain or distress. Nevertheless, our understanding of the neural circuitry underlying this sensitivity is incomplete. Here, we reveal unexpected sex-dependent activation of ACC when parental mice respond to distressed pups by returning them to the nest ("pup retrieval"). We observe sex differences in the interactions between excitatory and inhibitory ACC neurons during parental care, and inactivation of ACC excitatory neurons increased pup neglect. Locus coeruleus (LC) releases noradrenaline in ACC during pup retrieval, and inactivation of the LC-ACC pathway disrupts parental care. We conclude that ACC maintains sex-dependent sensitivity to pup distress under LC modulation. We propose that ACC's involvement in parenting presents an opportunity to identify neural circuits that support sensitivity to the emotional distress of others.

Keywords: CP: Neuroscience; anterior cingulate; chemogenetics; in vivo; locus coeruleus; noradrenaline; parental behavior; prosocial behavior.


Conflict of interest statement

Declaration of interests P.O. has a financial interest in Certerra, a company that offers whole-brain imaging services.

Figures

Figure 1.
Figure 1.. Sex-dependent differences in pup retrieval behavior
(A) Schematic of behavioral paradigm. (B and C) Scatterplots showing a normalized measure of latency to gather pups for dams (n = 20) and sires (n = 10). (D and E) Plot of retrieval latency of sires in the home and a novel cage, respectively. Lines track each individual’s performance. (F and G) Plot of retrieval latency of dams in the home and a novel cage, respectively. Lines track each individual’s performance. (H) Plot of mean latency index (PPD0–PPD5); n = 10 sires and 20 dams; two-way ANOVA; Holm-Sidak test, main factor (sex) p < 0.0001, main factor (context) p < 0.0001, interaction p = 0.0001; ****p < 0.0001. (I) Plot of percentage of pups retrieved averaged across PPD0–PPD5; n = 10 sires and 20 dams; two-way ANOVA; Holm-Sidak test, main factor (sex) p < 0.0001, main factor (context) p < 0.0001, interaction p = 0.0031; ****p < 0.0001, **p = 0.0023. (J) Plot of mean latency to retrieve the first pup (PPD0–PPD5); n = 10 sires and 20 dams; two-way ANOVA; Holm-Sidak test, main factor (sex) p < 0.0001, main factor (context) p = 0.0013, interaction p = 0.0001; ****p < 0.0001, ***p = 0.0003). (K) Plot of mean duration of retrieval events in the home cage (n = 20 dams and n = 10 sires, unpaired t test, p = 0.6903). (L) Plot of mean duration of intervals between retrieval events in the home cage (n = 20 dams and n = 10 sires, unpaired t test, **p = 0.0014). (M) Schematic of jar behavioral paradigm. (N) Plot of mean duration of time subjects interacted with pups in a jar and an empty jar (n = 6 dams and n = 4 sires; one-way ANOVA p < 0.0001; Tukey tests for individual group comparisons, ****p < 0.0001). (O) Plot of the number of USVs emitted by the pups in the jar in the nest without the dam. Paired t test *p = 0.0262. All values are reported as mean ± SEM, and all error bars denote SEM.
Figure 2.
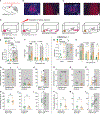
Figure 2.. Brain-wide c-fos expression screen
(A) Schematic of behavioral protocol, performed in dams and sires (dams n = 10 per group; sires n = 10 baseline, nine isolated, eight reunion, and nine retrieval). (B) Plots of brain regions in which c-fos expression was uniquely upregulated in the retrieval vs. baseline comparison in dams. PVR, periventricular region; LSr, lateral septal nucleus, rostral part; MSC, medial septal complex; MEZ, medial hypothalamic zone; CEAm, central amygdala, medial part; CEAc, central amygdala, capsular part; CEA, central amygdala; BSTpr, bed nucleus of the stria terminalis, posterior division, principal nucleus; BSTp, bed nucleus of the stria terminalis, posterior division; BSTif, bed nucleus of the stria terminalis, posterior division, interfascicular nucleus; BST, bed nucleus of the stria terminalis; BMAp, basomedial amygdalar nucleus, posterior part; BMAa, basomedial amygdalar nucleus, anterior part; BMA, basomedial amygdalar nucleus; BLAv, basolateral amygdalar nucleus, ventral part; SSs, supplemental somatosensory area; SSp-bfd, primary somatosensory area, barrel field; RSPv, retrosplenial area, ventral part; PIR2, piriform area, pyramidal layer; MOs, secondary motor area; ILA, infralimbic area; ENTl, entorhinal area, lateral part; ECT5, ectorhinal area/layer 5; COA, cortical amygdalar area; AUDv6b, ventral auditory area, layer 6b; ACCv1, anterior cingulate area, ventral part, layer 1; ACCd, anterior cingulate area, dorsal part. (C) Plot of c-fos+ cell count in ACC of dams and sires following pup interactions; Dams, mixed-effects model, factor (behavioral condition) p < 0.0001, factor (brain region) p < 0.00001; Tukey test, *p < 0.05. Sires, mixed-effects model, factor (behavioral condition) p = 0.0022, factor (brain region) p < 0.00001; Tukey test *p < 0.05. (D) Volcano plot of c-fos induction in baseline vs. retrieval conditions in dams as fold change in c-fos+ cells by region. False discovery rate (FDR) analysis was performed by the Benjamini-Hochberg procedure. Purple data points denote unique significantly different ROIs when comparing baseline vs. retrieval groups only. The purple horizontal line indicates the significance threshold (FDR < 0.05). (E) Volcano plot comparing retrieval groups between dams and sires. Positive fold change indicates an upregulation in dams and negative fold changes indicate an upregulation in sires. Significant data points are red. The purple horizontal line indicates the significance threshold (FDR < 0.05).
Figure 3.
Figure 3.. ACCCAMKII but not ACCVGAT neurons are differentially activated in dams and sires during pup retrieval behavior
(A) Schematic depicting our viral strategy to express GCaMP in excitatory and inhibitory neurons in ACC. (B) Behavioral paradigm. (C) Photomicrograph of a coronal brain section showing fiber placement and GCaMP6s expression in ACCCAMKII neurons. (D) Photomicrograph of a coronal brain section showing fiber placement and GCaMP7s expression in ACCVGAT neurons. (E) Heatmaps of mean GCaMP6s signals from ACCCAMKII neurons during pup retrieval events in dams (n = 7). (Top) Heatmap aligned to pup contact. Each row is the mean activity of all mice by day. (Bottom) The same data aligned to the end of the retrieval events. (F) Heatmaps of mean GCaMP6s signals from ACCCAMKII neurons during pup retrieval events in sires (n = 6). Panels as in (E). (G) Heatmaps of mean GCaMP7s signals from ACCVGAT neurons during pup retrieval events in dams (n = 9). (Top) Heatmap of data aligned to pup contact. Each row is the mean activity of all mice by day. (Bottom) The same data aligned to the end of the retrieval events. (H) Heatmaps of mean GCaMP7s signals from ACCVGAT neurons during pup retrieval events in sires (n = 9). Panels are arranged as in (G). (I) Plots of the mean Z-scored traces of ACCCAMKII neurons for all mice and all days. Dams (red), sires (black). (J) Comparison of the mean AUC of traces of retrieval-related activity of ACCCAMKII neurons between dams and sires (Mann-Whitney U test, *p = 0.035). (K) Comparison of the mean AUC of traces of retrieval-related activity of ACCCAMKII neurons, showing a decline in the magnitude of activity over PPD0–PPD5. (Left) Dams’ responses (Kruskal-Wallis test, **p = 0.0093; Benjamini, Krieger, and Yekutiel test, P0 vs. P3 **p = 0.0049; P0 vs. P4 **p = 0.0033; P0 vs. P5 *p = 0.0209). (Right) Sires’ responses (Kruskal-Wallis test *p = 0.0433; Benjamini, Krieger, and Yekutieli test, P0 vs. P3 *p = 0.0083; P0 vs. P5 **p = 0.0030). (L) Plots of the mean traces of ACCVGAT neurons for all mice and all days comparing dams (green) and sires (blue). (M) Comparison of the mean AUC of traces of retrieval-related activity of inhibitory neurons between dams and sires. (Mann-Whitney test, p = 0.3401). (N) Comparison of the mean AUC of traces of retrieval-related activity of ACCVGAT neurons, showing a decline in the magnitude of activity over PPD0–PPD5. (Left) Dams’ responses (Kruskal-Wallis test, not significant [n.s.], p = 0.2914). (Right) Sires’ responses (Kruskal-Wallis test ***p = 0.0008; Benjamini, Krieger, and Yekutieli test P0 vs. P2 *p = 0.0228; P0 vs. P3 *p = 0.0571; P0 vs. P4 **p = 0.0020; P0 vs. P5 ***p < 0.0001).
Figure 4.
Figure 4.. ACCCAMKII and ACCVGAT cell populations show opposite activation patterns during pup retrieval in dams but not sires
(A) Schematic depicting our viral strategy to express GCaMP in ACCVGAT and ACCCAMKII neurons. (B and C) Plots of the mean traces of ACCCAMKII neurons (cyan) and ACCVGAT neurons (magenta) during pup retrieval for all dams and all days (n = 7 mice and n = 9 mice respectively). Plot in (C) is aligned to the end of the retrieval events. (D and E) Comparison of the mean AUC of traces of retrieval-related activity between ACCCAMKII neurons and ACCVGAT neurons in dams, aligned to pup contact (unpaired t test ****p < 0.0001) (D) and the end of retrieval (unpaired t test **p = 0.0074) (E). (F and G) Heatmaps of mean GCaMP7s signals from ACCVGAT neurons in dams. Signals are aligned to the entry of the dam to the nest (F) and the exit of the dam from the nest (G) after retrieval of all pups. Each row represents the mean Z score from PPD0–PPD5 for each mouse (n = 5 mice). (H and I) Plots of the mean traces of ACCCAMKII neurons (cyan) and ACCVGAT neurons (magenta) for all dams and all days aligned to the dams’ entry to the nest (H) and exit from the nest (I) (n = 5 mice). (J and K) Comparison of the mean AUC of traces of nest entry/exit-related activity between ACCCAMKII neurons and ACCVGAT neurons in dams, aligned to the dam entering the nest (unpaired t test *p = 0.0378) (J) and exiting the nest (K) (unpaired t test n.s. [p = 0.9613]). (L and M) Plot of the mean traces of ACCCAMKII neurons (cyan) and ACCVGAT neurons (magenta) for all sires and all days (n = 6 mice and n = 9 mice respectively) aligned to pup contact during pup retrieval (L) and the end of the retrieval events (K). (N and O) Comparison of the mean AUC of traces of retrieval-related activity between ACCCAMKII neurons and ACCVGAT neurons in sires from all days aligned to pup contact (unpaired t test, n.s. [p = 0.0581]) (N) and to the end of retrieval (unpaired t test, n.s. [p = 0.5936]) (O). (P and Q) Heatmaps of mean GCaMP7s signals from ACCVGAT neurons in sires. The signals are aligned to the sire’s entry (P) and exit (Q) from the nest after retrieval of all pups. Each row represents the mean Z score from PPD0–PPD5 for each mouse (n = 5 mice). (R and S) Plots of the mean traces of ACCCAMKII (cyan) and ACCVGAT neurons (magenta) for all sires and all days aligned to the sire’s entry (R) and exit (S) from the nest (n = 5 mice). (T and U) Comparison of the mean AUC of traces of nest entry/exit-related activity between ACCCAMKII and ACCVGAT neurons in sires from all days aligned to the sires’ entry (unpaired t test, n.s. [p = 0.3085]) (T) and exit from the nest (unpaired t test, n.s [p = 0.1092]) (U).
Figure 5.
Figure 5.. Chemogenetic inactivation of ACCCAMKII neurons disrupts pup-directed behaviors
(A) Schematic of the viral strategy used to inactivate ACCCAMKII neurons. (B and C) Photomicrographs of hM4D(Gi) expression in ACC. (D) Behavioral paradigm. (E) Scatterplot of mean latency index (±SEM) in GFP-expressing dams (green) injected with saline or clozapine (n = 10), and hM4D(Gi)-expressing dams (orange) injected with saline or clozapine (n = 12), one-way ANOVA, ****p < 0.0001; Tukey test, **p = 0.0039, ****p < 0.0001. (F) Scatterplot of the data in (E), separated by day. Two-way ANOVA with Sidak test, main effect (day ****p < 0.0001, main effect (virus) **p = 0.0025, interaction p = 0.05, ***p = 0.0009. (G and H) Plots comparing time interacting with the trapped pups for GFP-expressing dams (green, n = 10) and hM4D(Gi)-expressing dams (orange, n = 12) injected with clozapine (G) (Mann-Whitney test, *p = 0.0426) and injected with saline (H) (Mann-Whitney test, p = 0.6277). (I and J) Plots comparing time interacting with the empty jar for GFP-expressing dams (green; n = 10) and hM4D(Gi)-expressing dams (orange, n = 12) injected with clozapine (I) (Mann-Whitney test, p = 0.4176) and injected with saline (J) (Mann-Whitney test, p = 0.3463). (K) Plot comparing time interacting with the trapped pups by hM4D(Gi)-expressing dams injected with saline or clozapine (n = 12) (paired t test, *p = 0.0369). (L) Plot comparing time interacting with the trapped pups by GFP-expressing dams injected with saline or clozapine (n = 10) (paired t test, p = 0.4038). (M) Scatterplot of mean latency index (±SEM) in the same GFP-expressing sires (n = 10, green) when injected with saline or clozapine, and the same hM4D(Gi)-expressing sires (n = 9, orange) when injected with saline or clozapine; one-way ANOVA, *p = 0.02; Tukey test, asterisk indicates significant differences, *p = 0.0168. (N) Scatterplot of the data in (M) separated by day. Two-way ANOVA with Sidak test, main effect (day) **p = 0.0014, main effect (virus) ***p = 0.0008, interaction p = 0.7601. (O and P) Plot comparing time interacting with the trapped pups for GFP-expressing sires (n = 8) and hM4D(Gi)-expressing sires (n = 9) injected with clozapine (O) (Mann-Whitney test, p = 0.0592) and injected with saline (P) (Mann-Whitney test, n.s.). (Q and R) Plot comparing time interacting with the empty jar for GFP-expressing sires (n = 8) and hM4D(Gi)-expressing sires (n = 9) injected with clozapine (Q) and saline (R) (Mann-Whitney test, n.s.). (S) Plot comparing time interacting with the trapped pups by hM4D(Gi)-expressing sires injected with saline or clozapine (n = 9), (paired t test, p = 0.1392). (T) Plot comparing time spent interacting with the trapped pups for GFP-expressing sires injected with saline or clozapine (n = 8) (paired t test, p = 0.1024).
Figure 6.
Figure 6.. Timing and magnitude of LC activity associated with pup retrieval behavior is different in sires compared to dams
(A) Schematic of virus injection (left). Photomicrograph of a coronal brain section showing retrograde labeling from ACC to LC (right). Green shows tyrosine hydroxylase (TH) antibody staining and red shows tdTomato expression driven by the rAAV injection. (B) Schematic of our viral strategy for expressing GCaMP7s in LCDBH neurons (left). Photomicrograph of a coronal brain section showing GCaMP7s expression in the LC (right). The placement of the optical fiber is also visible (inset). (C and D) Heatmaps of mean GCaMP7 signals from LC during pup retrieval events in dams (n = 8 mice) (C) and sires (n = 5 mice) (D). Each row is the mean activity for all mice by day. (Top) Data aligned to pup contact. (Bottom) Data aligned to the end of retrieval. (E) Plot of the mean traces of GCaMP7 signals in LC for all mice and all days, contrasting dams (red) and sires (black). (Top) Data aligned to pup contact. (Bottom) Data aligned to the end of the retrieval. (F) Comparison of the mean AUC of traces of the retrieval-related activity of LCDBH neurons in dams and sires aligned to pup contact (Mann-Whitney test, p = 0.0451). (G) Violin plots comparing the duration of retrieval events between dams and sires (sires n = 5 mice, 618 events; dams n = 8 mice, 1,238 events; Mann-Whitney test, p < 0.0001). (H) Plot showing the duration of intervals in between retrieval events (n = 5 sires, n = 508 events; n = 8 dams, n = 1072 events; Mann-Whitney test, p < 0.0001). (I) Scatterplot of coefficients (r) obtained from Spearman correlation of the duration of the retrieval events and the magnitude of LC responses during pup retrieval. (J) Example scatterplot of the duration of retrieval events and the magnitude of LC responses in a dam. The green line represents a linear regression. (K) Example scatterplot of the time between retrieval events and the magnitude of LC responses in a sire. The green line represents a linear regression. (L) Scatterplot of coefficients (r) obtained from Spearman correlation of the intervals between retrieval events and the magnitude of LC responses during pup retrieval for all mice. Gray dots represent correlations that were not significant.
Figure 7.
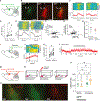
Figure 7.. LC-ACC neurons are active during pup retrieval behavior, release NA in ACC, and selective inactivation of LC-ACC neurons disrupts pup retrieval behavior
(A) Schematic of our viral strategy for expressing GCaMP7s in LC neurons that project to ACC. (B) Photomicrographs of a coronal brain section showing GCaMP7s expression (green), tyrosine hydroxylase (TH) antibody staining (red), and fiber placement in LC. (C) Plots of activity of LC-ACC neurons during pup retrieval. The left panel shows a heatmap (top), wherein each row is the mean activity for all mice by day, and a plot (bottom) of mean GCaMP7s traces from LC-ACC neurons for all mice and all days. Data are aligned to pup contact. The right panel is the same data aligned to the end of retrieval. (D) Plot of the mean AUC of the traces of retrieval-related activity of LC-ACC aligned to pup contact compared with baseline activity (Wilcoxon matched-pairs signed rank test, *p = 0.0312). (E) Plots of activity from LC-ACC neurons during retrieval from one representative dam, arranged as in (C). (F) Example scatterplot of the duration of retrieval events and the magnitude of LC-ACC responses in a dam. The black line represents a linear regression. (G) Example scatterplot of the time between retrieval events and the magnitude of LC-ACC responses in a dam. The black line represents a linear regression. (H) Scatterplot of coefficients (r) obtained by Spearman correlation of the duration of the retrieval events and the duration of intervals between retrieval events with the magnitude of LC-ACC responses during pup retrieval. Gray dots represent correlations that did not reach significance. (I) Schematic of our viral strategy to express the GRABNE sensor in ACC. (J) Plots of mean fluorescent GRABNE signal from ACC during pup retrieval events in dams (n = 6) and sires (n = 4). (Top) Heatmap wherein each row is the mean activity across all sessions from one mouse. (Bottom) Mean fluorescence trace for all mice. Data are aligned to pup contact. (K) Plot comparing the AUC of fluorescent GRABNE signal from ACC during pup retrieval events extending 2 s from pup contact with 2 s of baseline (paired t test, *p = 0.0173). (L) Representative ΔF/F trace of GRABNE fluorescence reflecting NA release while a dam interacted with pups. The black line above the trace indicates the time period when the dam was retrieving the pups to the nest. (M) Schematic of the viral strategy used to express inhibitory DREADDs in LC-ACC neurons. (N) Behavioral paradigm. (O) Photomicrograph of a coronal brain section showing hM4D(Gi) expression in LC neurons that project to ACC (red) and TH antibody staining. (P) Scatterplot of mean latency index (±SEM) in GFP-expressing dams (green) injected with saline or clozapine (n = 10) and hM4D(Gi)-expressing dams (orange) injected with saline or clozapine (n = 9). Ordinary one-way ANOVA, **p = 0.0075; Benjamini, Krieger, and Yekutieli test, clozapine, GFP vs. clozapine, hM4D(Gi) *p = 0.0137, saline, hM4D(Gi) vs. clozapine, hM4D(Gi) **p < 0.0028, saline, GFP vs. clozapine, hM4D(Gi) *p = 0.0072.

Similar articles

Cited by

References

    1. Kohl J, Autry AE, and Dulac C (2017). The neurobiology of parenting: A neural circuit perspective. Bioessays 39, 1–11. 10.1002/bies.201600159. - DOI - PMC - PubMed
    1. Dulac C, O’Connell LA, and Wu Z (2014). Neural control of maternal and paternal behaviors. Science 345, 765–770. 10.1126/science.1253291. - DOI - PMC - PubMed
    1. Lonstein JS, and De Vries GJ (2000). Sex differences in the parental behavior of rodents. Neurosci. Biobehav. Rev 24, 669–686. 10.1016/S0149-7634(00)00036-1. - DOI - PubMed
    1. Rogers FD, and Bales KL (2019). Mothers, Fathers, and Others: Neural Substrates of Parental Care. Trends Neurosci. 42, 552–562. 10.1016/j.tins.2019.05.008. - DOI - PMC - PubMed
    1. Numan M (2020). The Parental Brain Mechanisms, Development an Evolution (Oxford University Press; ).

Publication types

LinkOut - more resources