. 2023 Jul 25;42(7):112733.
doi: 10.1016/j.celrep.2023.112733. Epub 2023 Jul 6.

ADAR1 Zα domain P195A mutation activates the MDA5-dependent RNA-sensing signaling pathway in brain without decreasing overall RNA editing

Affiliations

ADAR1 Zα domain P195A mutation activates the MDA5-dependent RNA-sensing signaling pathway in brain without decreasing overall RNA editing

Xinfeng Guo et al. Cell Rep. .

Abstract

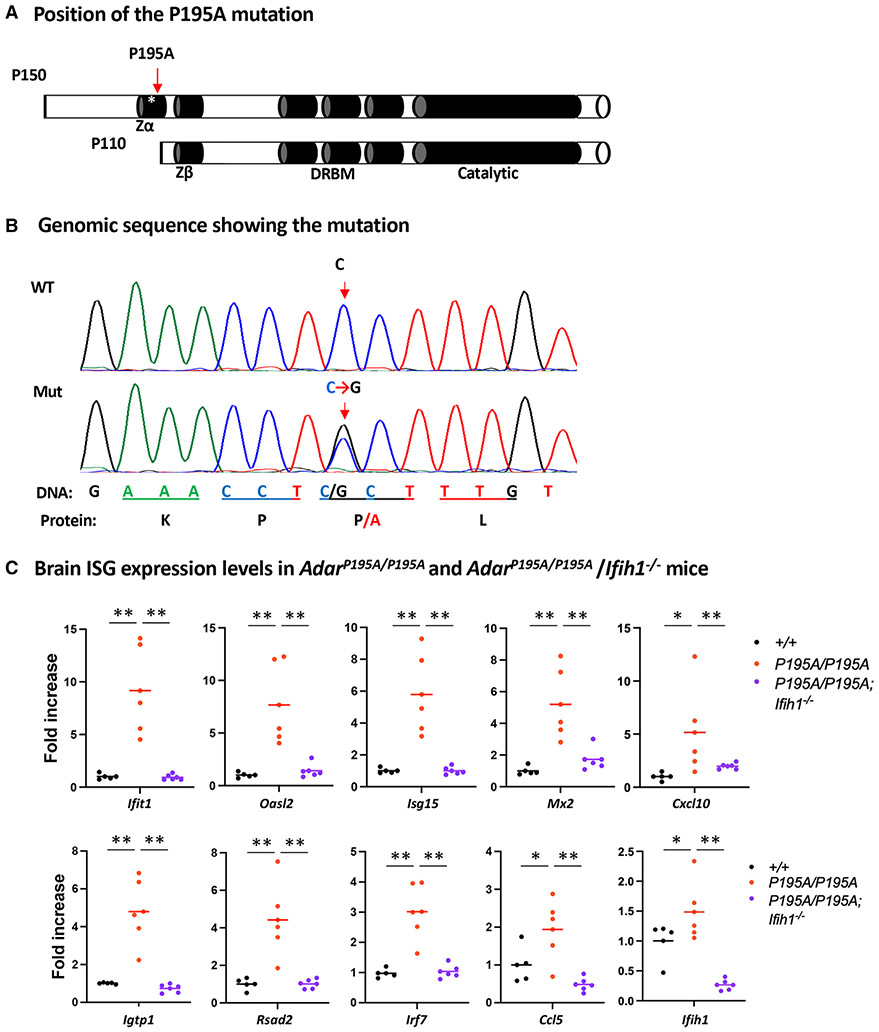
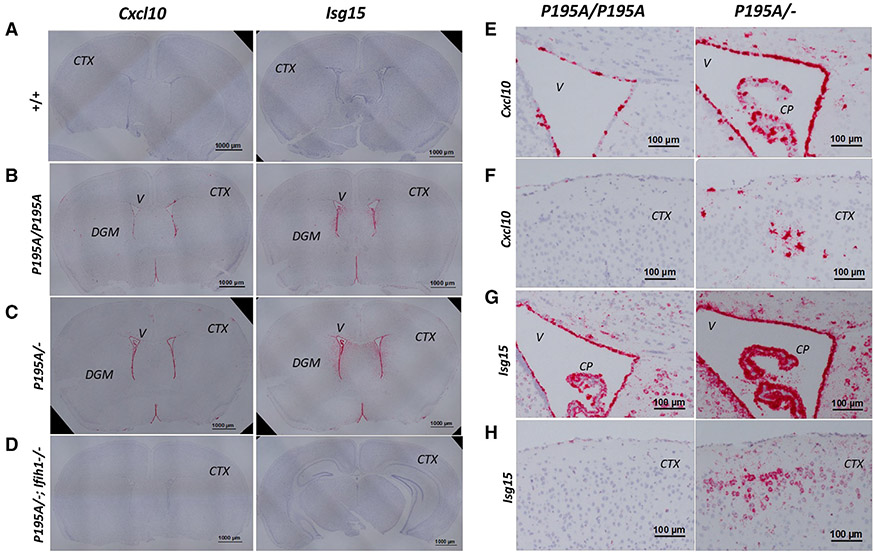
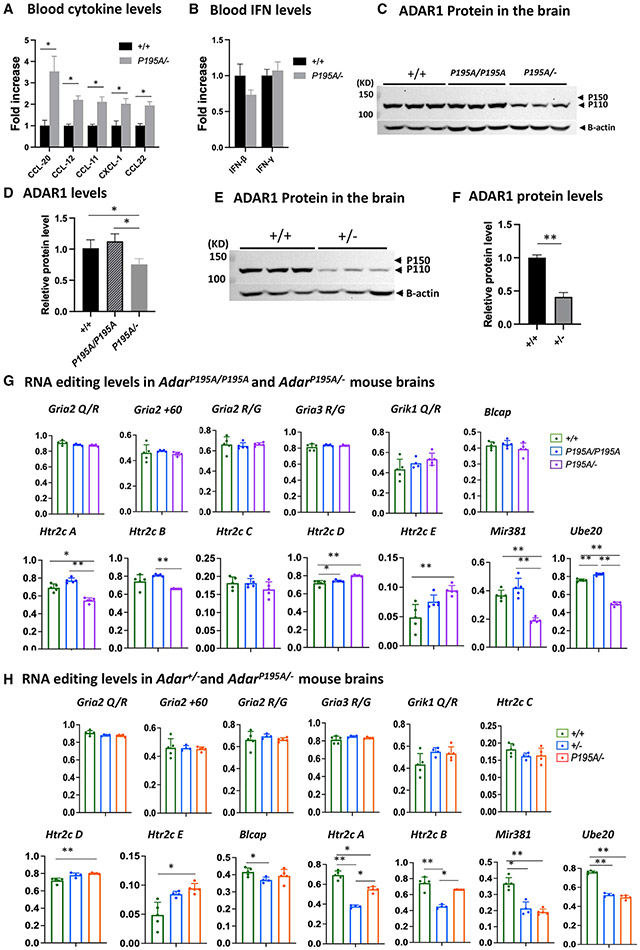
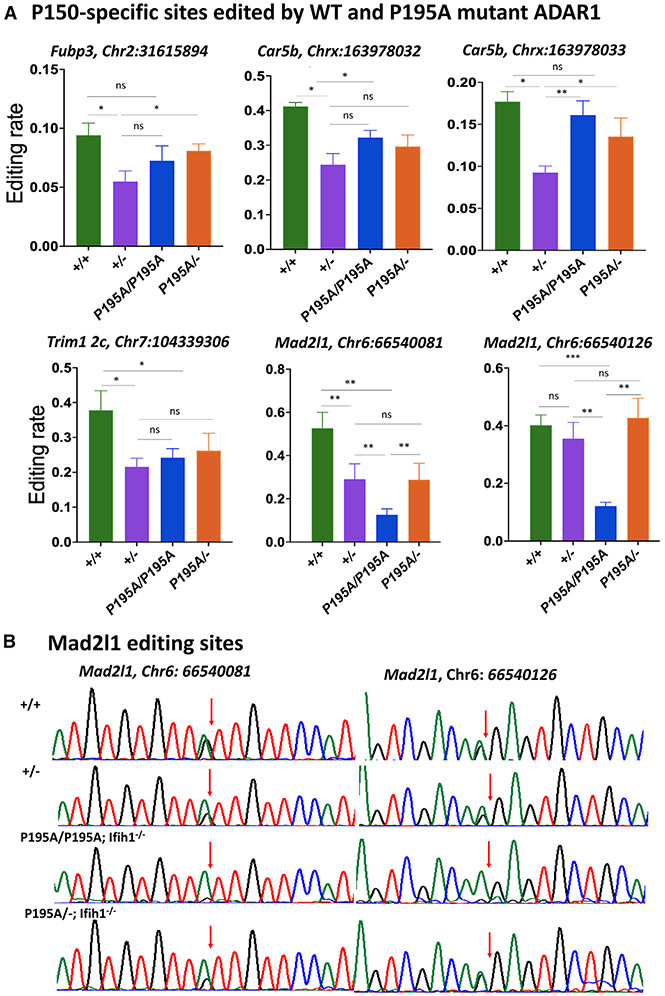
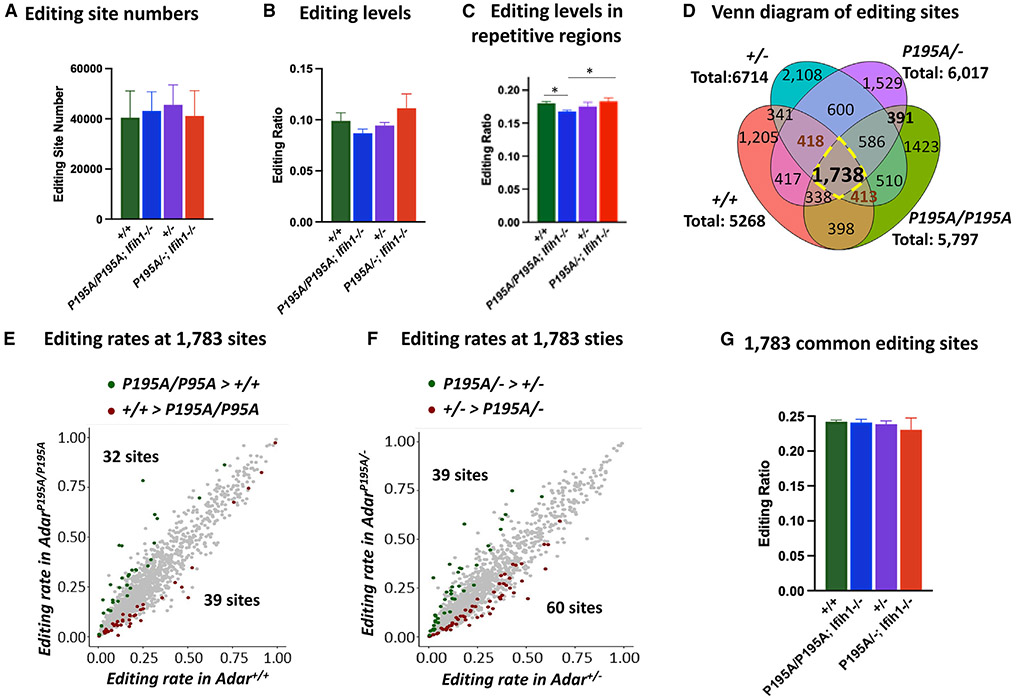
Variants of the RNA-editing enzyme ADAR1 cause Aicardi-Goutières syndrome (AGS), in which severe inflammation occurs in the brain due to innate immune activation. Here, we analyze the RNA-editing status and innate immune activation in an AGS mouse model that carries the Adar P195A mutation in the N terminus of the ADAR1 p150 isoform, the equivalent of the P193A human Zα variant causal for disease. This mutation alone can cause interferon-stimulated gene (ISG) expression in the brain, especially in the periventricular areas, reflecting the pathologic feature of AGS. However, in these mice, ISG expression does not correlate with an overall decrease in RNA editing. Rather, the enhanced ISG expression in the brain due to the P195A mutant is dose dependent. Our findings indicate that ADAR1 can regulate innate immune responses through Z-RNA binding without changing overall RNA editing.

Keywords: A-to-I RNA editing; ADAR1; AGS; Aicardi-Goutières syndrome; CP: Immunology; IFN-stimulated gene; ISG; MDA-5; RNA-sensing signaling pathway; Z-RNA; adenosine deaminase acting on RNA 1; melanoma differentiation-associated protein 5; neuroinflammation.


Conflict of interest statement

Declaration of interests The authors declare no competing interests.

Figures

Figure 1.
Figure 1.. ADAR1 P195A mutation activates MDA5-dependent ISG expression in mouse brains
(A) Two isoforms of ADAR1, p150 and p110, are expressed from the Adar1 gene. The p150 isoform contains the Zα domain at the N terminus; the Zβ domain, which is not known to bind nucleic acids, the three dsRNA-binding motifs (DRBMs), and the catalytic domain in the C terminus are shared by p150 and p110 isoforms. The asterisk marks the P195A site in the Zα domain; the Zα domain is not present in the p110 isoform. (B) Mouse genomic sequences flanking the mutation site were confirmed using Sanger sequencing analysis. A single C>G nucleotide replacement that codes the P195A mutation is shown on the sequence histography indicated by the arrows, and the corresponding protein sequence is shown at the bottom. (C) Mouse brain ISG expression was assessed at mRNA levels. Expression of a panel of 10 selected ISGs was measured using real-time RT-PCR, and the ISG expression levels in AdarP195A/P195A mice (n = 6) were compared with those of WT control (n = 5) and AdarP195A/P195A; Ifih1−/− mice (n = 6). Each dot shows the ISG level of a mouse, and the bars represent the means. The nonparametric Wilcoxon rank-sum test was used to test the differences between the two groups. *p < 0.05, **p < 0.01.
Figure 2.
Figure 2.. Phenotype and ISG expression in the brain of AdarP195A/− mice
(A) AdarP195A/− mice were produced via breeding of AdarP195A/P195A mice and heterozygous ADAR1 KO Adar+/− mice. The ADAR1 KO allele did not produce detectable ADAR1 protein. (B) AdarP195A/− mice were viable and healthy; the survival rate of AdarP195A/− mice was not significantly different from the WT control mice up to 30 weeks of age, as observed in 27 AdarP195A/− mice. (C) Expression levels of ISR pathway genes Asns, Cdkn, and Homox in AdarP195A/− mice (n = 5) were not different from the expression levels in the livers of WT controls (n = 5). Cdkn and Homox expression in the brain of AdarP195A/− mice (n = 5) was increased by less than 2-fold from WT controls (n = 5), while Asns expression was not significantly different. The nonparametric Wilcoxon rank-sum test was used to test the differences between the two groups. *p < 0.05, **p < 0.01. (D) The body weight of AdarP195A/− mice was less than that of the controls. In male mice, the body weight showed a statistically significant difference at 4 weeks of age, while the body weight of female mice showed more variation and was statistically different at 2 and 3 weeks of age. n = 5–11 (control male), n = 4–6 (AdarP195A/P195A male), n = 7–8 (control female), and n = 6–14 (AdarP195A/P195A female). The nonparametric Wilcoxon rank-sum test was used to test the differences between the two groups. *p < 0.05, **p < 0.01. (E) The brain ISG expression levels of AdarP195A/− mice were compared with those of the controls and AdarP195A/−/Ifih1−/− mice. All 10 tested ISG mRNA levels were significantly increased in AdarP195A/− mice, which were significantly decreased in AdarP195A/−; Ifih1−/− mice. n = 5 (WT) and n = 6 (AdarP195A/P195A and AdarP195A/P195A; Ifih1−/−). The nonparametric Wilcoxon rank-sum test was used to test the differences between the two groups. **p < 0.01.
Figure 3.
Figure 3.. Distribution of ISG expression in AdarP195A/P195A and AdarP195A/− mouse brains determined by RNA ISH
(A–D) Interferon-stimulated gene (ISG) expression in mouse brains was detected using RNA ISH on formalin-fixed paraffin-embedded sections of 8-week-old Adar+/+, AdarP195A/P195A, AdarP195A/−, and AdarP195A/−; Ifih1−/− mice. Shown are brain coronal sections stained with Cxcl10 or Isg15 probes. Both probes show ISG expression in the periventricular areas and on cell clusters scattered in the cortex and DGM areas of AdarP195A/P195A (B) and AdarP195A/− mice (C), while no staining was observed in Adar+/+ (A) and AdarP195A/−; Ifih1−/− triple-mutant mice (D). V, ventricle; CTX, cortex. Scale bar, 1,000 μm in (A)–(D). (E) ISG expression in the periventricular areas detected with the CXCL10 probe in AdarP195A/P195A and AdarP195A/− mice. Ependymocytes and choroid plexus epithelial cells were highly stained on sections of AdarP195A/P195A and AdarP195A/− mice. Staining in AdarP195A/P195A mice was mainly on the ependymocytes, and more intense staining was observed in AdarP195A/− mice, including the adjacent cells in periventricular areas. V, ventricle; CP, choroid plexus. Scale bar, 100 μm. (F) ISG expression in the brain surface cortical areas detected with the Cxcl10 probe in AdarP195A/P195A and AdarP195A/− mice. Scattered focuses were stained with the typical morphology of microglial cells in AdarP195A/− mice. Much fewer cells were stained in the AdarP195A/P195A mice. CTX, cortex. Scale bar, 100 μm. (G) ISG expression detected with ISG-15 probe in the periventricular areas on brain sections of AdarP195A/P195A and AdarP195A/− mice. The staining pattern of the ISG-15 probe on ependymocytes and choroid plexus epithelial cells was similar to that of the CXCL-10 probe. The ISG-15 probe also stained cells in the periventricular areas showing neuron morphologic features. Staining in AAdarP195A/− mice was more intense than in AdarP195A/− mice. V, ventricle; CP, choroid plexus. Scale bar, 100 μm. (H) ISG expression detected with Isg15 probe in the brain surface cortical areas on brain sections of AdarP195A/P195A and AdarP195A/− mice. Scattered areas with cells showing typical morphology of neurons were stained in AdarP195A/− mice, whereas much less staining was observed in AdarP195A/P195A mice. CTX, cortex. Scale bar, 100 μm.
Figure 4.
Figure 4.. Decreased ADAR1 protein and RNA-editing levels in AdarP195A/− and Adar+/− mice
(A) Luminex assay was used to measure the blood cytokine/chemokine levels of AdarP195A/− mice. Among the tested cytokines of the available panels, levels of CCL-20, CCL12, CCL-11, CXCL-1, and CCL22 were significantly increased in AdarP195A/− mice in comparison to the WT mice. n = 5 for both control and AdarP195A/− groups. The nonparametric Wilcoxon rank-sum test was used to test the differences between the two groups. *p < 0.05. The complete panel is listed in Table S1. (B) IFN-β and IFN-γ levels in the blood were assessed in the Luminex panels. n = 5 for both control and AdarP195A/− groups. Their levels were not different between AdarP195A/− and WT mice. (C) Brain ADAR1 protein levels in AdarP195A/P195A and AdarP195A/− mice were analyzed by western blotting and compared with WT mice. ADAR1 p110 isoform was abundantly expressed in the brains of the WT and AdarP195A/P195A mice, while no obvious expression of ADAR1 p150 isoform was observed. ADAR1 protein in AdarP195A/P195A mice was not significantly different from that in WT mice. However, much less ADAR1 protein was observed in AdarP195A/− mouse brains. (D) Quantification of ADAR1 protein shown in (C). There is no significant difference between WT and AdarP195A/P195A mice, while the ADAR1 protein level in AdarP195A/− mice is significantly lower than in WT and AdarP195A/P195A mice. n = 3, *p < 0.05 (nonparametric Wilcoxon rank-sum test). (E) To determine whether a single copy of WT Adar allele also causes ADAR1 protein level decrease, ADAR1 in Adar+/− mice was assessed and compared with WT mice. Significantly less ADAR1 was observed in Adar+/− mice. (F) ADAR1 protein levels in Adar+/− and Adar+/+ mice were quantified and compared. The ADAR1 protein level in Adar+/− mice was significantly less than that in Adar+/+ mice. n = 3, *p < 0.05 (nonparametric Wilcoxon rank-sum test). (G) Brain RNAs were isolated from AdarP195A/P195A and AdarP195A/− mouse brains, and A-to-I RNA-editing levels were assessed via Sanger sequencing analysis. RNA editing at the known editing sites in defined neural RNA-editing substrates, including editing sites in the Gira2, Rria3, Grik1, and Htr2c neuron receptor, as well as the editing sites in mRNAs for Blcap, Ube2o, and the miR381, were compared with the WT control mice and between AdarP195A/P195A and AdarP195A/− mice. At all tested sites, RNA-editing levels in AdarP195A/P195A mice were the same or even higher than the WT control mice, while, in AdarP195A/− mice, only editing in miR381 and Ube2o mRNAs was significantly lower than that in AdarP195A/P195A and WT control mice. (H) RNA-editing activities in the brain of Adar+/− and AdarP195A/− mice were assessed by Sanger sequencing analysis to determine whether the P195A mutation affects the RNA-editing activity of ADAR1 at a low protein dose. As shown in (G), the RNA-editing levels at the defined editing sites were assessed and compared with the WT control mice. Except for Htr2c A and B sites and in miR381 and Ube2o mRNA, RNA-editing levels in Adar+/− and AdarP195A/− mice were the same or even higher than those in the WT control mice. RNA-editing levels at Htr2c A and B sites and in miR381 and Ube2o mRNA were significantly lower in Adar+/− and AdarP195A/− mice. However, editing levels in Htr2c and Ube20 mRNAs in AdarP195A/− mice were not different from those in Adar+/− mice and were even higher than those in Adar+/− mice at the Htr2c A and B sites. In (G) and (H), the average editing levels and SDs are shown. n = 5 (WT) and n = 6 (AdarP195A/P195A and AdarP195A/P195A/Ifih1−/−). The nonparametric Wilcoxon rank-sum test was used to test the differences between the two groups. The significant differences are indicated. *p < 0.05, **p < 0.01.
Figure 5.
Figure 5.. RNA editing at the P150-specific sites in AdarP195A/− and Adar1+/− mice
(A) RNA-editing levels at typical ADAR1 p150 isoform-specific editing sites in Adar+/+, Adar+/−, AdarP195A/P195A; Ifih1−/−, and AdarP195A/−; Ifih1−/− mice were assessed, including the editing sites in the mRNAs of Fub3 (Chr2: 31615894), Trim12c (Chr7: 104339306), Car5b (Chrx: 163978032, 163978033), and Mad2l1 (Chr6: 66540081, 66540126). Except for the site of Mad2l1 (Chr6: 66540126), editing levels in in Adar+/− mice were significantly lower than those in Adar+/+ mice, whereas editing levels in AdarP195A/P195A; Ifih1−/− and AdarP195A/−; Ifih1−/− mice were the same as those in Adar+/− mice or between Adar+/+ mice and Adar+/− mice. Editing at the two sites in Mad2l1 mRNA (Chr6: 66540081, 66540126) were the only sites with significantly lower editing levels in AdarP195A/P195A; Ifih1−/− mice than those in Adar+/+, Adar+/-, and AdarP195A/−; Ifih1−/− mice, while editing at these two sites in AdarP195A/−; Ifih1−/− mice was not significantly different from Adar+/− and Adar+/+ mice. Shown in the figure are the average editing levels with SD values. n = 5 for all the groups. The nonparametric Wilcoxon rank-sum test was used to test the differences between the two groups. *p < 0.05, **p < 0.01. (B) Different RNA-editing levels at the two specific sites in Mad2l1 mRNA (Chr6: 66540081, 66540126) in Adar+/+, Adar+/−, AdarP195A/P195A; Ifih1−/−, and AdarP195A/−; Ifih1−/− mice were shown by Sanger sequencing analysis. Shown here are the representative chromatograms of the editing sites. The arrows indicate the editing sites, and the editing level was calculated by the A and G peak values (G/(A + G)). Significantly decreased editing levels were observed in AdarP195A/P195A; Ifih1−/− mice.
Figure 6.
Figure 6.. RNA editing assessed at whole-transcriptome level
(A) High-throughput RNA sequencing (RNA-seq) study was performed with brain RNAs from Adar+/+, Adar+/−, AdarP195A/P195A; Ifih1−/−, and AdarP195A/−; Ifih1−/− mice. The numbers of RNA-editing sites identified in three mice of each genotype were compared. n = 3 for each group. Welch two-sample t test was used to test the differences between the two groups. No significant difference was observed in these four groups of mice. (B) The average editing rates of all the editing sites in three mice of each genotype were compared, which showed no significant difference. (C) The average editing rates of all the editing sites in repetitive sequences in three mice of each genotype were compared. The average editing rate in AdarP195A/P195A; Ifih1−/− mice was significantly lower than that in Adar+/+ and AdarP195A/−; Ifih1−/− mice but not significant compared with Adar+/− mice. For(A)–(C), the bars show the means of the three mice of each genotype, and the error bars are the corresponding SD values. n = 3 for each group. *p < 0.05, **<0.01 (Welch two-sample t test). (D) The editing sites found in three mice of each genotype are compared in the Venn diagram. The total sites shown for each genotype are the shared editing sites found in all three mice of each genotype. Each genotype shows a unique selection of editing sites, with 1,738 editing sites shared by all the analyzed mice. Subgroups of the editing sites differ between the genotypes. (E) Comparison of the editing rates of the 1,738 shared editing sites in AdarP195A/P195A; Ifih1−/− mice versus Adar+/+ mice; 32 sites were edited at significantly higher levels in AdarP195A/P195A; Ifih1−/− mice and 39 sites were edited significantly more in Adar+/+ mice. (F) Comparison of the editing rates of the 1,738 shared editing sites in AdarP195A/−; Ifih1−/− mice versus Adar+/− mice; 39 sites were edited at significantly higher level in AdarP195A/−; Ifih1−/− mice and 60 sites were editing significantly more in Adar+/− mice. (G) The average editing rates of the 1,783 editing sites in the Adar+/+, Adar+/−, AdarP195A/P195A; Ifih1−/−, and AdarP195A/−; Ifih1−/− mice were compared. The bars show the means of three mice of each genotype, and the error bars are the corresponding SD values. n = 3 for each genotype. Welch two-sample t test was used to test the differences between the two groups. No significant difference was observed in these four groups of mice.

Similar articles

Cited by

References

    1. Heraud-Farlow JE, and Walkley CR (2016). The role of RNA editing by ADAR1 in prevention of innate immune sensing of self-RNA. J. Mol. Med 94, 1095–1102. 10.1007/s00109-016-1416-1. - DOI - PubMed
    1. Liddicoat BJ, Piskol R, Chalk AM, Ramaswami G, Higuchi M, Hartner JC, Li JB, Seeburg PH, and Walkley CR (2015). RNA editing by ADAR1 prevents MDA5 sensing of endogenous dsRNA as nonself. Science 349, 1115–1120. 10.1126/science.aac7049. - DOI - PMC - PubMed
    1. Pestal K, Funk CC, Snyder JM, Price ND, Treuting PM, and Stetson DB (2015). Isoforms of RNA-Editing Enzyme ADAR1 Independently Control Nucleic Acid Sensor MDA5-Driven Autoimmunity and Multi-organ Development. Immunity 43, 933–944. 10.1016/j.immuni.2015.11.001. - DOI - PMC - PubMed
    1. Mannion NM, Greenwood SM, Young R, Cox S, Brindle J, Read D, Nellåker C, Vesely C, Ponting CP, McLaughlin PJ, et al. (2014). The RNA-editing enzyme ADAR1 controls innate immune responses to RNA. Cell Rep. 9, 1482–1494. 10.1016/j.celrep.2014.10.041. - DOI - PMC - PubMed
    1. Yang S, Deng P, Zhu Z, Zhu J, Wang G, Zhang L, Chen AF, Wang T, Sarkar SN, Billiar TR, and Wang Q (2014). Adenosine deaminase acting on RNA 1 limits RIG-I RNA detection and suppresses IFN production responding to viral and endogenous RNAs. J. Immunol 193, 3436–3445. 10.4049/jimmunol.1401136. - DOI - PMC - PubMed

Publication types