

Cancer stem cells promote lymph nodes metastasis of breast cancer by reprogramming tumor microenvironment
- PMID: 37421907
- PMCID: PMC10339262
- DOI: 10.1016/j.tranon.2023.101733
Cancer stem cells promote lymph nodes metastasis of breast cancer by reprogramming tumor microenvironment
Abstract
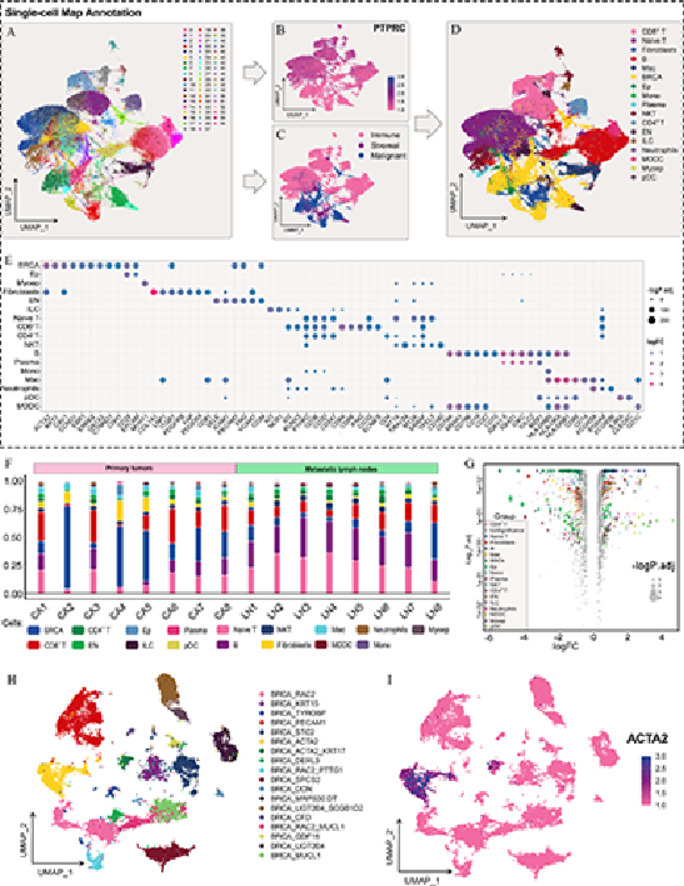
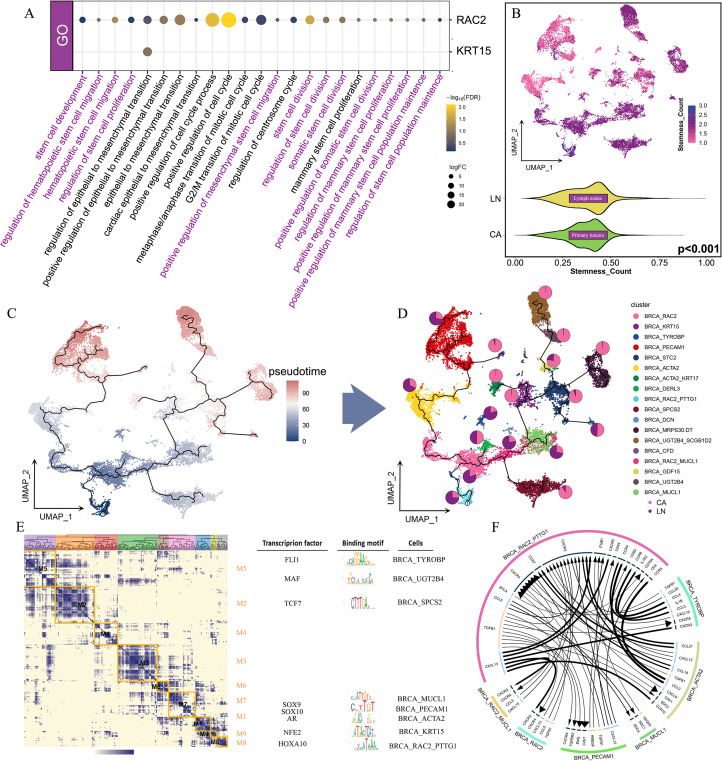
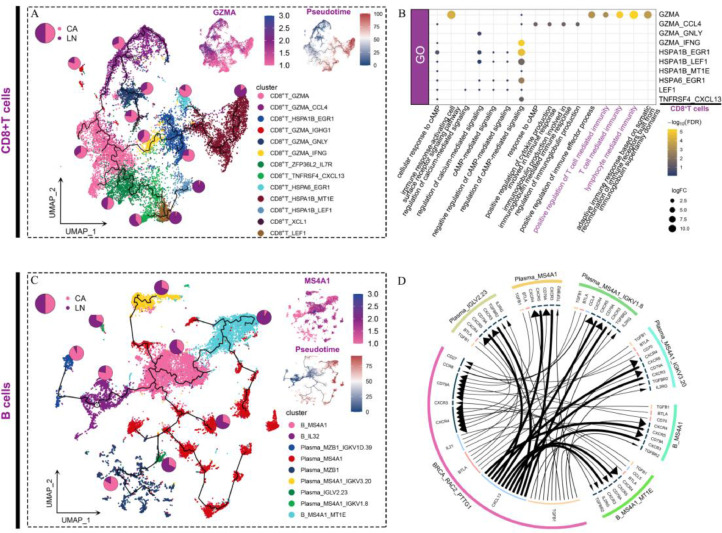
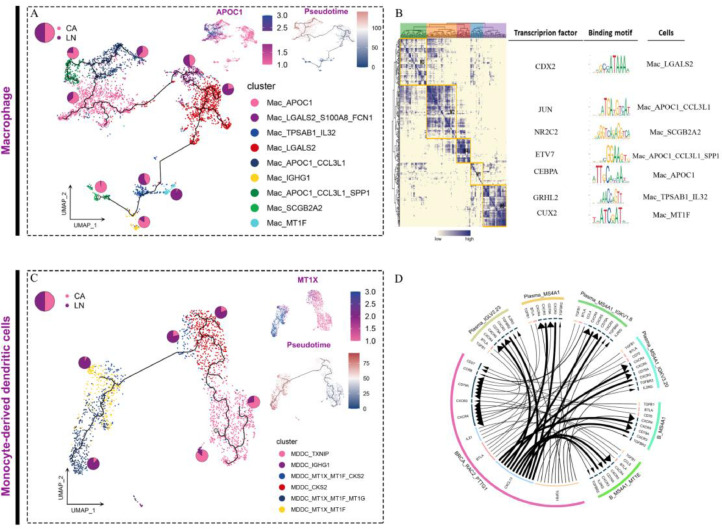
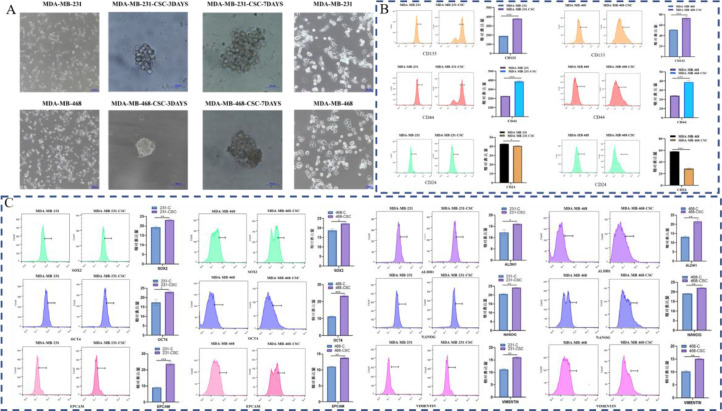
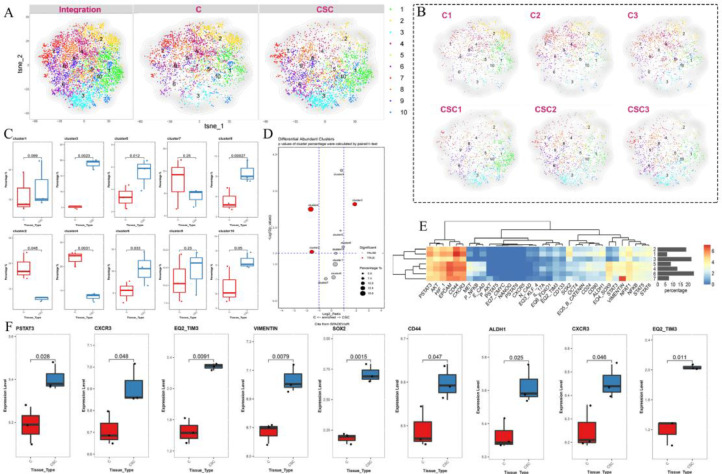
Breast cancer progression and metastasis are governed by a complex interplay within the tumor immune microenvironment (TIME), involving numerous cell types. Lymph node metastasis (LNM) is a key prognostic marker associated with distant organ metastasis and reduced patient survival, but the mechanisms underlying its promotion by breast cancer stem cells (CSCs) remain unclear. Our study sought to unravel how CSCs reprogram TIME to facilitate LNM. Utilizing single-cell RNA sequencing, we profiled TIME in primary cancer and corresponding metastatic lymph node samples from patients at our institution. To verify the derived data, we cultured CSCs and performed validation assays employing flow cytometry and CyTOF. Our analysis revealed distinct differences in cellular infiltration patterns between tumor and LNM samples. Importantly, RAC2 and PTTG1 double-positive CSCs, which exhibit the highest stem-like attributes, were markedly enriched in metastatic lymph nodes. These CSCs are hypothesized to foster metastasis via activation of specific metastasis-related transcription factors and signaling pathways. Additionally, our data suggest that CSCs might modulate adaptive and innate immune cell evolution, thereby further contributing to metastasis. In summary, this study illuminates a critical role of CSCs in modifying TIME to facilitate LNM. The enrichment of highly stem-like CSCs in metastatic lymph nodes offers novel therapeutic targeting opportunities and deepens our understanding of breast cancer metastasis.
Keywords: Breast cancer 1; Cancer stem cells (CSCs) 2; Lymph node metastasis 5; Single-cell RNA sequencing (scRNA-seq) 4; Tumor immune microenvironment (TIME) 3.
Copyright © 2023. Published by Elsevier Inc.
Conflict of interest statement
Declaration of Competing Interest The authors declare that they have no known competing financial interests or personal relationships that could have appeared to influence the work reported in this paper.
Figures

Similar articles
-
Single-cell analyses reveal metastasis mechanism and microenvironment remodeling of lymph node in intrahepatic cholangiocarcinoma.JHEP Rep. 2024 Nov 15;7(3):101275. doi: 10.1016/j.jhepr.2024.101275. eCollection 2025 Mar. JHEP Rep. 2024. PMID: 40041119 Free PMC article.
-
Microenvironment components and spatially resolved single-cell transcriptome atlas of breast cancer metastatic axillary lymph nodes.Acta Biochim Biophys Sin (Shanghai). 2022 Sep 25;54(9):1336-1348. doi: 10.3724/abbs.2022131. Acta Biochim Biophys Sin (Shanghai). 2022. PMID: 36148946 Free PMC article.
-
ScRNA-seq revealed an immunosuppression state and tumor microenvironment heterogeneity related to lymph node metastasis in prostate cancer.Exp Hematol Oncol. 2023 May 23;12(1):49. doi: 10.1186/s40164-023-00407-0. Exp Hematol Oncol. 2023. PMID: 37221625 Free PMC article.
-
Beyond tumorigenesis: cancer stem cells in metastasis.Cell Res. 2007 Jan;17(1):3-14. doi: 10.1038/sj.cr.7310118. Cell Res. 2007. PMID: 17179981 Review.
-
Reprogramming of sentinel lymph node microenvironment during tumor metastasis.J Biomed Sci. 2022 Oct 20;29(1):84. doi: 10.1186/s12929-022-00868-1. J Biomed Sci. 2022. PMID: 36266717 Free PMC article. Review.
Cited by
-
Prolonged Low-Dose Administration of FDA-Approved Drugs for Non-Cancer Conditions: A Review of Potential Targets in Cancer Cells.Int J Mol Sci. 2025 Mar 18;26(6):2720. doi: 10.3390/ijms26062720. Int J Mol Sci. 2025. PMID: 40141362 Free PMC article. Review.
-
The PTTG1/VASP axis promotes oral squamous cell carcinoma metastasis by modulating focal adhesion and actin filaments.Mol Oncol. 2025 May;19(5):1517-1531. doi: 10.1002/1878-0261.13779. Epub 2025 Jan 10. Mol Oncol. 2025. PMID: 39792809 Free PMC article.
-
Application of mass cytometry in the immune microenvironment of breast cancer.Med Oncol. 2025 May 19;42(6):215. doi: 10.1007/s12032-025-02770-w. Med Oncol. 2025. PMID: 40388018 Review.
-
Establishment of an interpretable MRI radiomics-based machine learning model capable of predicting axillary lymph node metastasis in invasive breast cancer.Sci Rep. 2025 Jul 18;15(1):26030. doi: 10.1038/s41598-025-10818-0. Sci Rep. 2025. PMID: 40676103 Free PMC article.
-
Multi-Omics Profiling Identifies a High-Risk Subgroup of Breast Cancer Stem Cells for Prognostic Stratification and Personalized Treatment.J Cancer. 2025 Feb 28;16(6):1860-1872. doi: 10.7150/jca.109589. eCollection 2025. J Cancer. 2025. PMID: 40092692 Free PMC article.
References
-
- Siegel R.L., Miller K.D., Jemal A. Cancer statistics, 2019. CA Cancer J. Clin. 2019;69:7–34. - PubMed
-
- Harbeck N., Gnant M. Breast cancer. Lancet (London, England) 2017;389:1134–1150. - PubMed
-
- Rizzo A., Cusmai A., Acquafredda S., Rinaldi L., Palmiotti G. Ladiratuzumab vedotin for metastatic triple negative cancer: preliminary results, key challenges, and clinical potential. Expert Opin. Investig. Drugs. 2022;31:495–498. - PubMed
LinkOut - more resources
Full Text Sources
