

Coordinated human sleeping brainwaves map peripheral body glucose homeostasis
- PMID: 37421946
- PMCID: PMC10394167
- DOI: 10.1016/j.xcrm.2023.101100
Coordinated human sleeping brainwaves map peripheral body glucose homeostasis
Abstract
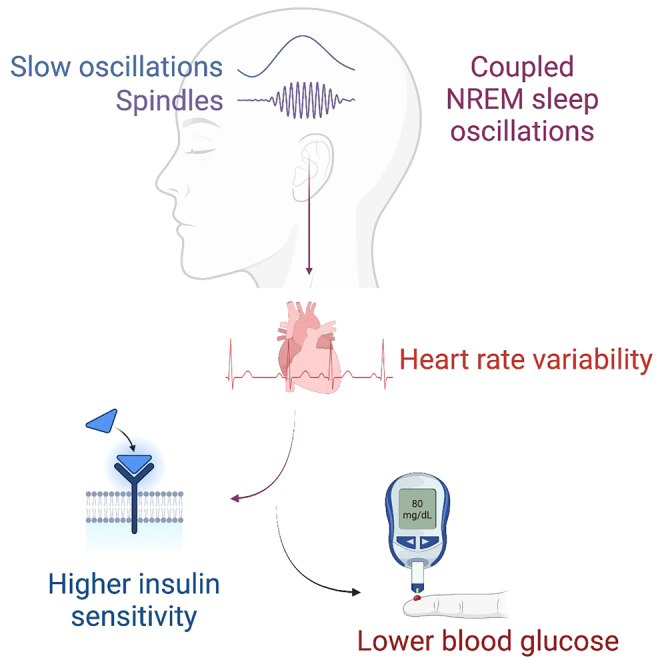
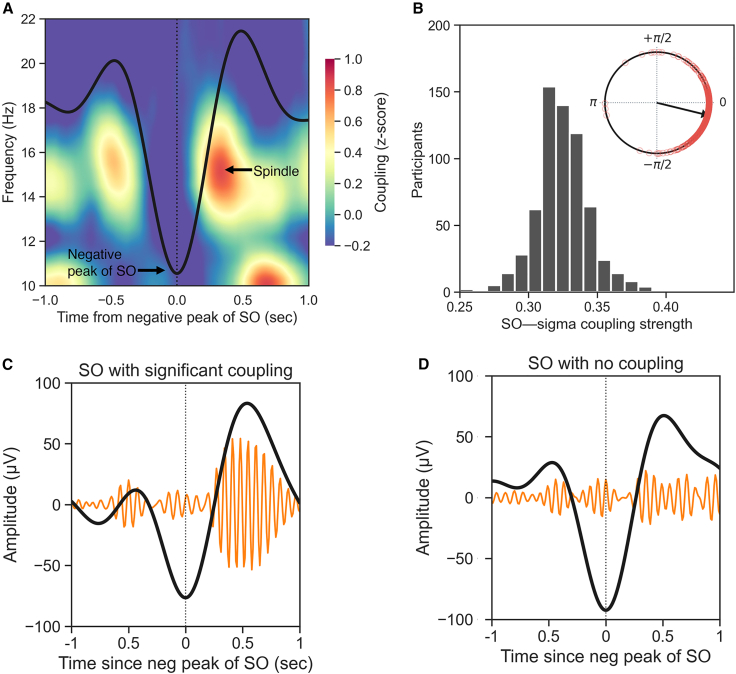
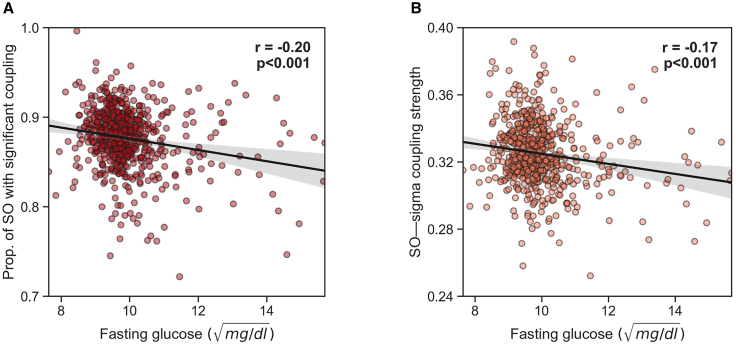
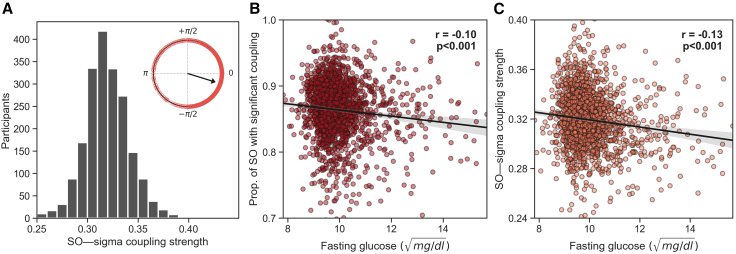
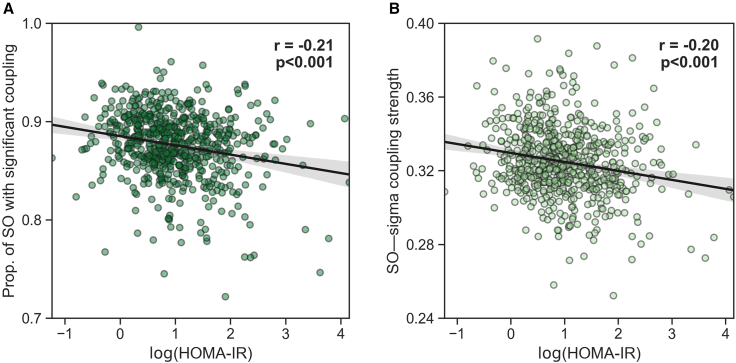
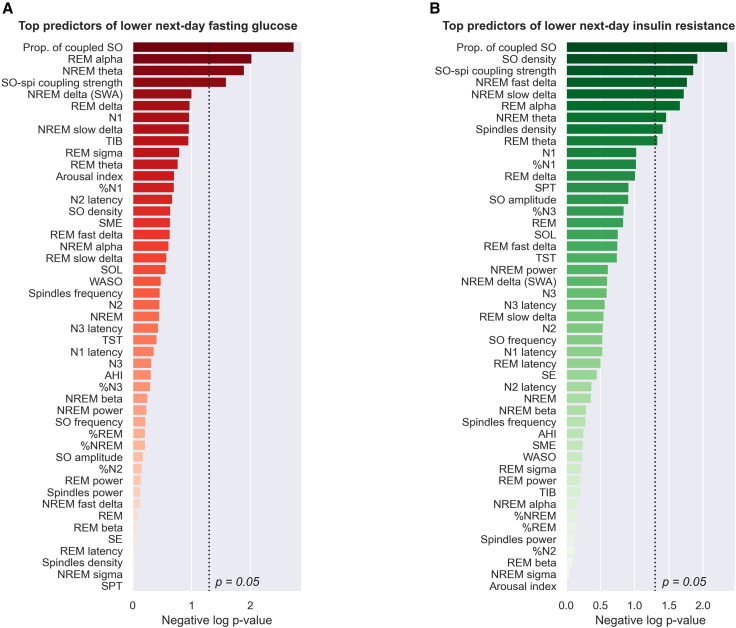
Insufficient sleep impairs glucose regulation, increasing the risk of diabetes. However, what it is about the human sleeping brain that regulates blood sugar remains unknown. In an examination of over 600 humans, we demonstrate that the coupling of non-rapid eye movement (NREM) sleep spindles and slow oscillations the night before is associated with improved next-day peripheral glucose control. We further show that this sleep-associated glucose pathway may influence glycemic status through altered insulin sensitivity, rather than through altered pancreatic beta cell function. Moreover, we replicate these associations in an independent dataset of over 1,900 adults. Of therapeutic significance, the coupling between slow oscillations and spindles was the most significant sleep predictor of next-day fasting glucose, even more so than traditional sleep markers, relevant to the possibility of an electroencephalogram (EEG) index of hyperglycemia. Taken together, these findings describe a sleeping-brain-body framework of optimal human glucose homeostasis, offering a potential prognostic sleep signature of glycemic control.
Keywords: NREM sleep; autonomic nervous system; diabetes; glycemia; heart rate variability; insulin resistance; sleep spindles; slow oscillations.
Copyright © 2023 The Author(s). Published by Elsevier Inc. All rights reserved.
Conflict of interest statement
Declaration of interests M.P.W. serves as a consultant for and has equity interest in Bryte, The Sleepfoundation.org, Oura, and StimScience.
Figures
Comment in
-
A sweet spot for the sleeping brain: Linking human sleep physiology and glucoregulation.Cell Rep Med. 2023 Jul 18;4(7):101123. doi: 10.1016/j.xcrm.2023.101123. Cell Rep Med. 2023. PMID: 37467713 Free PMC article.
Similar articles
-
A sweet spot for the sleeping brain: Linking human sleep physiology and glucoregulation.Cell Rep Med. 2023 Jul 18;4(7):101123. doi: 10.1016/j.xcrm.2023.101123. Cell Rep Med. 2023. PMID: 37467713 Free PMC article.
-
Co-ordination of brain and heart oscillations during non-rapid eye movement sleep.J Sleep Res. 2022 Apr;31(2):e13466. doi: 10.1111/jsr.13466. Epub 2021 Aug 31. J Sleep Res. 2022. PMID: 34467582 Free PMC article.
-
Dynamics of sleep spindles and coupling to slow oscillations following motor learning in adult mice.Neurobiol Learn Mem. 2019 Dec;166:107100. doi: 10.1016/j.nlm.2019.107100. Epub 2019 Oct 14. Neurobiol Learn Mem. 2019. PMID: 31622665 Free PMC article.
-
EEG slow waves and sleep spindles: windows on the sleeping brain.Behav Brain Res. 1995 Jul-Aug;69(1-2):109-16. doi: 10.1016/0166-4328(95)00007-g. Behav Brain Res. 1995. PMID: 7546301 Review.
-
The visual scoring of sleep and arousal in infants and children.J Clin Sleep Med. 2007 Mar 15;3(2):201-40. J Clin Sleep Med. 2007. PMID: 17557427 Review.
Cited by
-
Mulberry leaf extract combined with tryptophan improves sleep and post wake mood in adults with sleep complaints - A randomized cross-over study.Eur J Nutr. 2025 Mar 12;64(3):124. doi: 10.1007/s00394-025-03643-8. Eur J Nutr. 2025. PMID: 40072601 Clinical Trial.
-
A Multimodal Sleep Foundation Model Developed with 500K Hours of Sleep Recordings for Disease Predictions.medRxiv [Preprint]. 2025 Feb 9:2025.02.04.25321675. doi: 10.1101/2025.02.04.25321675. medRxiv. 2025. PMID: 39974074 Free PMC article. Preprint.
-
Differences in brain spindle density during sleep between patients with and without type 2 diabetes.Comput Biol Med. 2025 Jan;184:109484. doi: 10.1016/j.compbiomed.2024.109484. Epub 2024 Dec 1. Comput Biol Med. 2025. PMID: 39622099
-
A sweet spot for the sleeping brain: Linking human sleep physiology and glucoregulation.Cell Rep Med. 2023 Jul 18;4(7):101123. doi: 10.1016/j.xcrm.2023.101123. Cell Rep Med. 2023. PMID: 37467713 Free PMC article.
-
Food intake enhances hippocampal sharp wave-ripples.bioRxiv [Preprint]. 2025 Feb 25:2024.10.08.617304. doi: 10.1101/2024.10.08.617304. bioRxiv. 2025. Update in: Elife. 2025 Apr 14;14:RP105059. doi: 10.7554/eLife.105059. PMID: 39416018 Free PMC article. Updated. Preprint.
References
-
- Williams R., Karuranga S., Malanda B., Saeedi P., Basit A., Besançon S., Bommer C., Esteghamati A., Ogurtsova K., Zhang P., Colagiuri S. Global and regional estimates and projections of diabetes-related health expenditure: Results from the International Diabetes Federation Diabetes Atlas. Diabetes Res. Clin. Pract. 2020;162:108072. 9th edition. - PubMed
-
- Zimmet P., Alberti K.G., Shaw J. Global and societal implications of the diabetes epidemic. Nature. 2001;414:782–787. - PubMed
-
- Schmid S.M., Hallschmid M., Schultes B. The metabolic burden of sleep loss. Lancet Diabetes Endocrinol. 2015;3:52–62. - PubMed
Publication types
MeSH terms
Substances
Grants and funding
LinkOut - more resources
Full Text Sources
Other Literature Sources
